

Share of Million-Dollar Homes Rising — Here Are the Metros Where They’re Most Prevalent
Though home prices have remained steep after rapid growth during the height of the pandemic, paying $1 million or more for a house may seem excessive to most Americans. That said, just because most people aren’t spending seven figures on a house doesn’t mean million-dollar homes aren’t prevalent in some parts of the U.S.
To see where million-dollar houses are most common, LendingTree analyzed data from the U.S. Census Bureau’s American Community Survey to find the share of million-dollar homes in each of the nation’s 50 largest metropolitan areas.
While million-dollar houses aren’t common in most of the nation’s largest metros, they make up a majority share of homes in two California metros, San Jose and San Francisco — notoriously high-cost areas.
On this page
Key findings
- Million-dollar homes are relatively uncommon in most of the country. An average of 6.68% of owner-occupied homes in the nation’s 50 largest metros in 2021 were valued at $1 million or more. Though this means there’ll likely be plenty of sub-million-dollar homes from which buyers can choose, the share of million-dollar homes is growing. According to our research last year, an average of 4.71% of owner-occupied homes in the nation’s 50 largest metros in 2020 were valued at $1 million or more.
- San Jose and San Francisco, Calif., have the largest share of million-dollar homes. Respectively, 66.28% and 52.91% of owner-occupied homes in these metros are worth $1 million or more — making them the only two in our study where a majority of homes are worth at least $1 million. In last year’s study, San Jose was the only metro where a majority of owner-occupied homes were worth $1 million or more.
- Including San Jose and San Francisco, the four metros with the highest percentage of million-dollar homes are in California. Driven by factors including dense populations and the significant wealth generated by the tech and entertainment industries, an average of 42.21% of owner-occupied homes across San Jose, San Francisco, Los Angeles and San Diego are valued at at least $1 million.
- Only four metros — Buffalo, N.Y., Cleveland, Pittsburgh and Louisville, Ky. — have fewer than 1.00% of owner-occupied homes valued at at least $1 million. An average of only 0.85% of owner-occupied houses in these generally affordable metros are worth $1 million or more. Last year, Columbus, Ohio, Cincinnati, Indianapolis, Detroit and Memphis, Tenn. were also on the list of metros where fewer than 1.00% of owner-occupied homes were valued at $1 million or more, but their share of million-dollar homes has since grown.
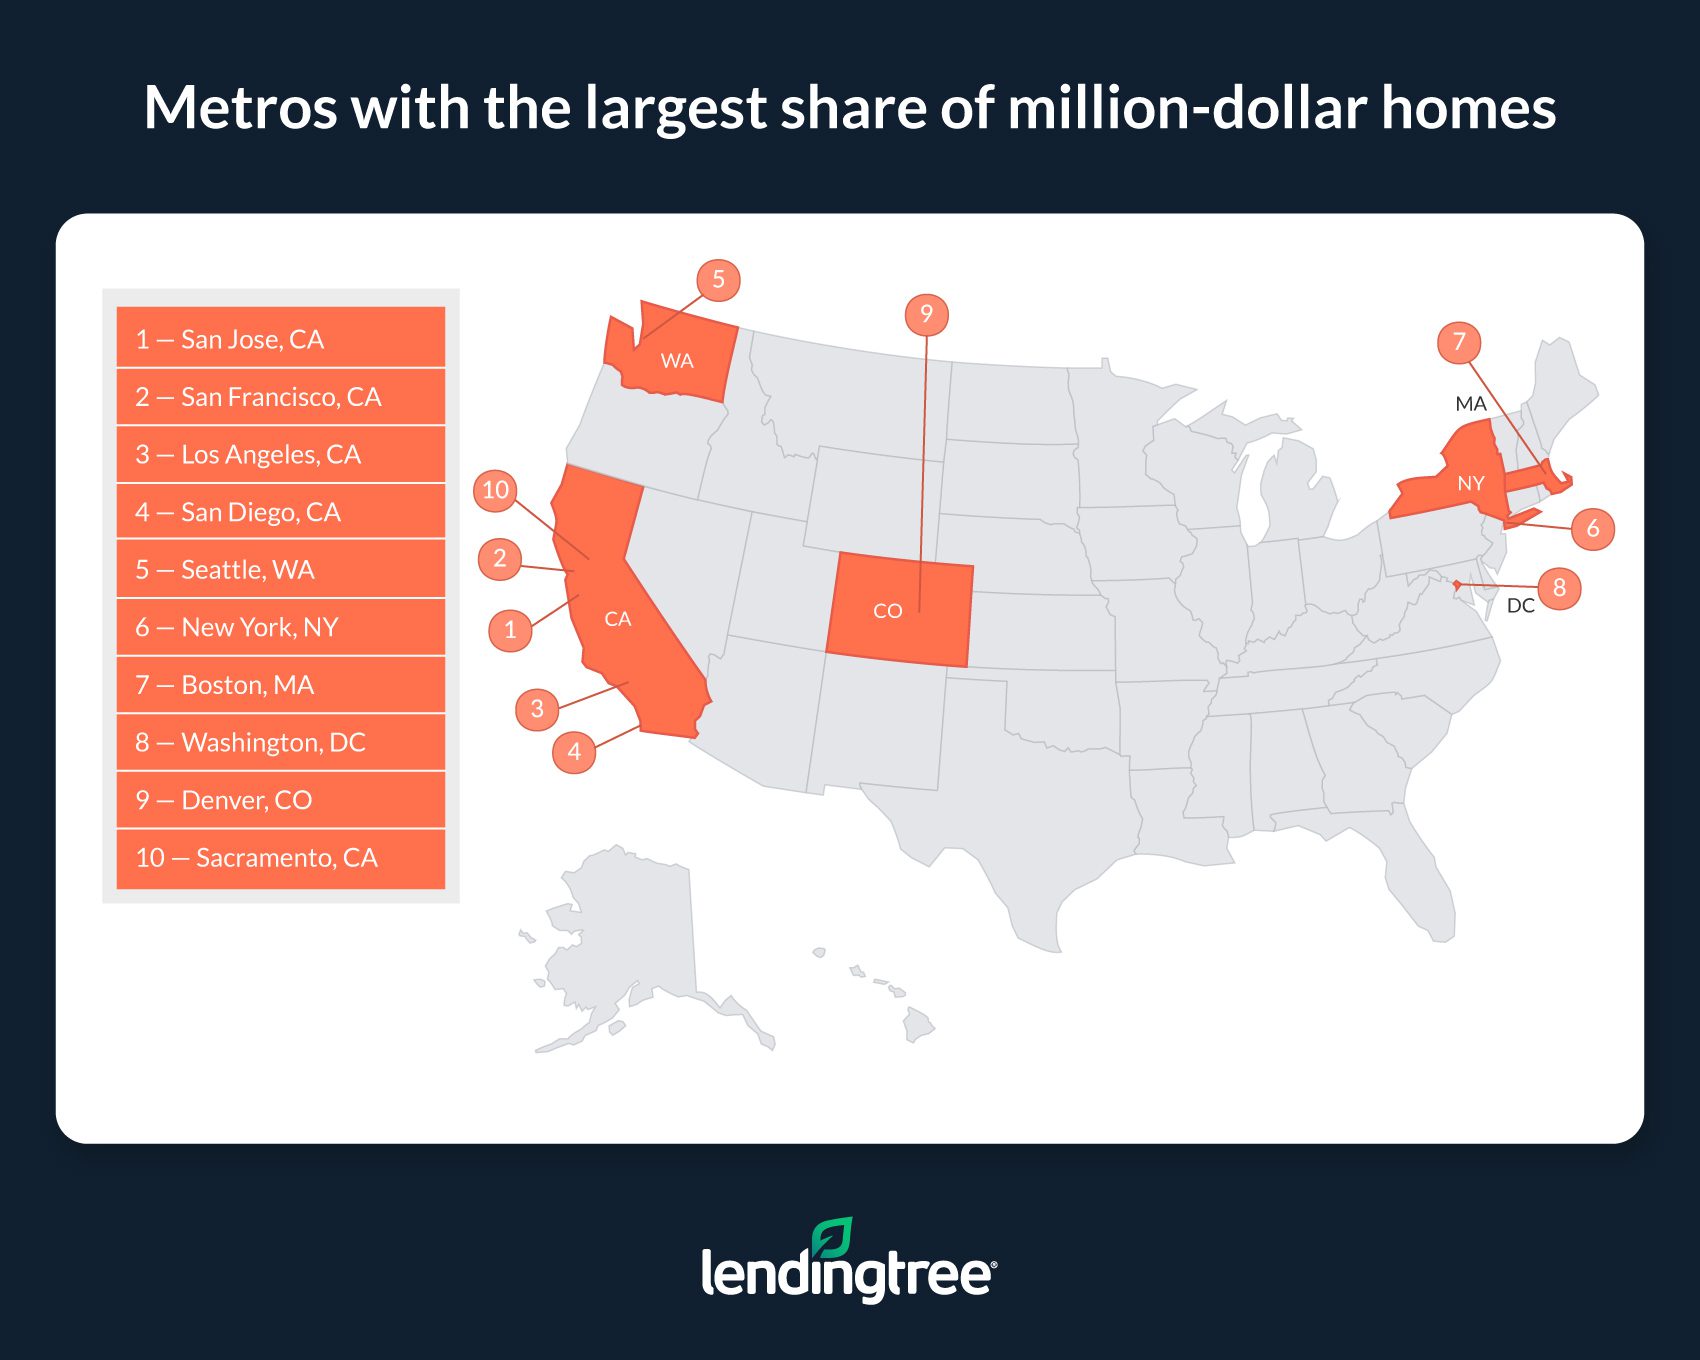
Metros with the highest share of million-dollar homes
1. San Jose, Calif.
- Number of owner-occupied housing units: 377,447
- Number of owner-occupied units valued at $1 million or more: 250,179
- Percentage of owner-occupied units valued at $1 million or more: 66.28%
- Median value of owner-occupied housing units: $1,237,800
2. San Francisco
- Number of owner-occupied housing units: 959,987
- Number of owner-occupied units valued at $1 million or more: 507,914
- Percentage of owner-occupied units valued at $1 million or more: 52.91%
- Median value of owner-occupied housing units: $1,042,300
3. Los Angeles
- Number of owner-occupied housing units: 2,176,998
- Number of owner-occupied units valued at $1 million or more: 576,537
- Percentage of owner-occupied units valued at $1 million or more: 26.48%
- Median value of owner-occupied housing units: $748,700
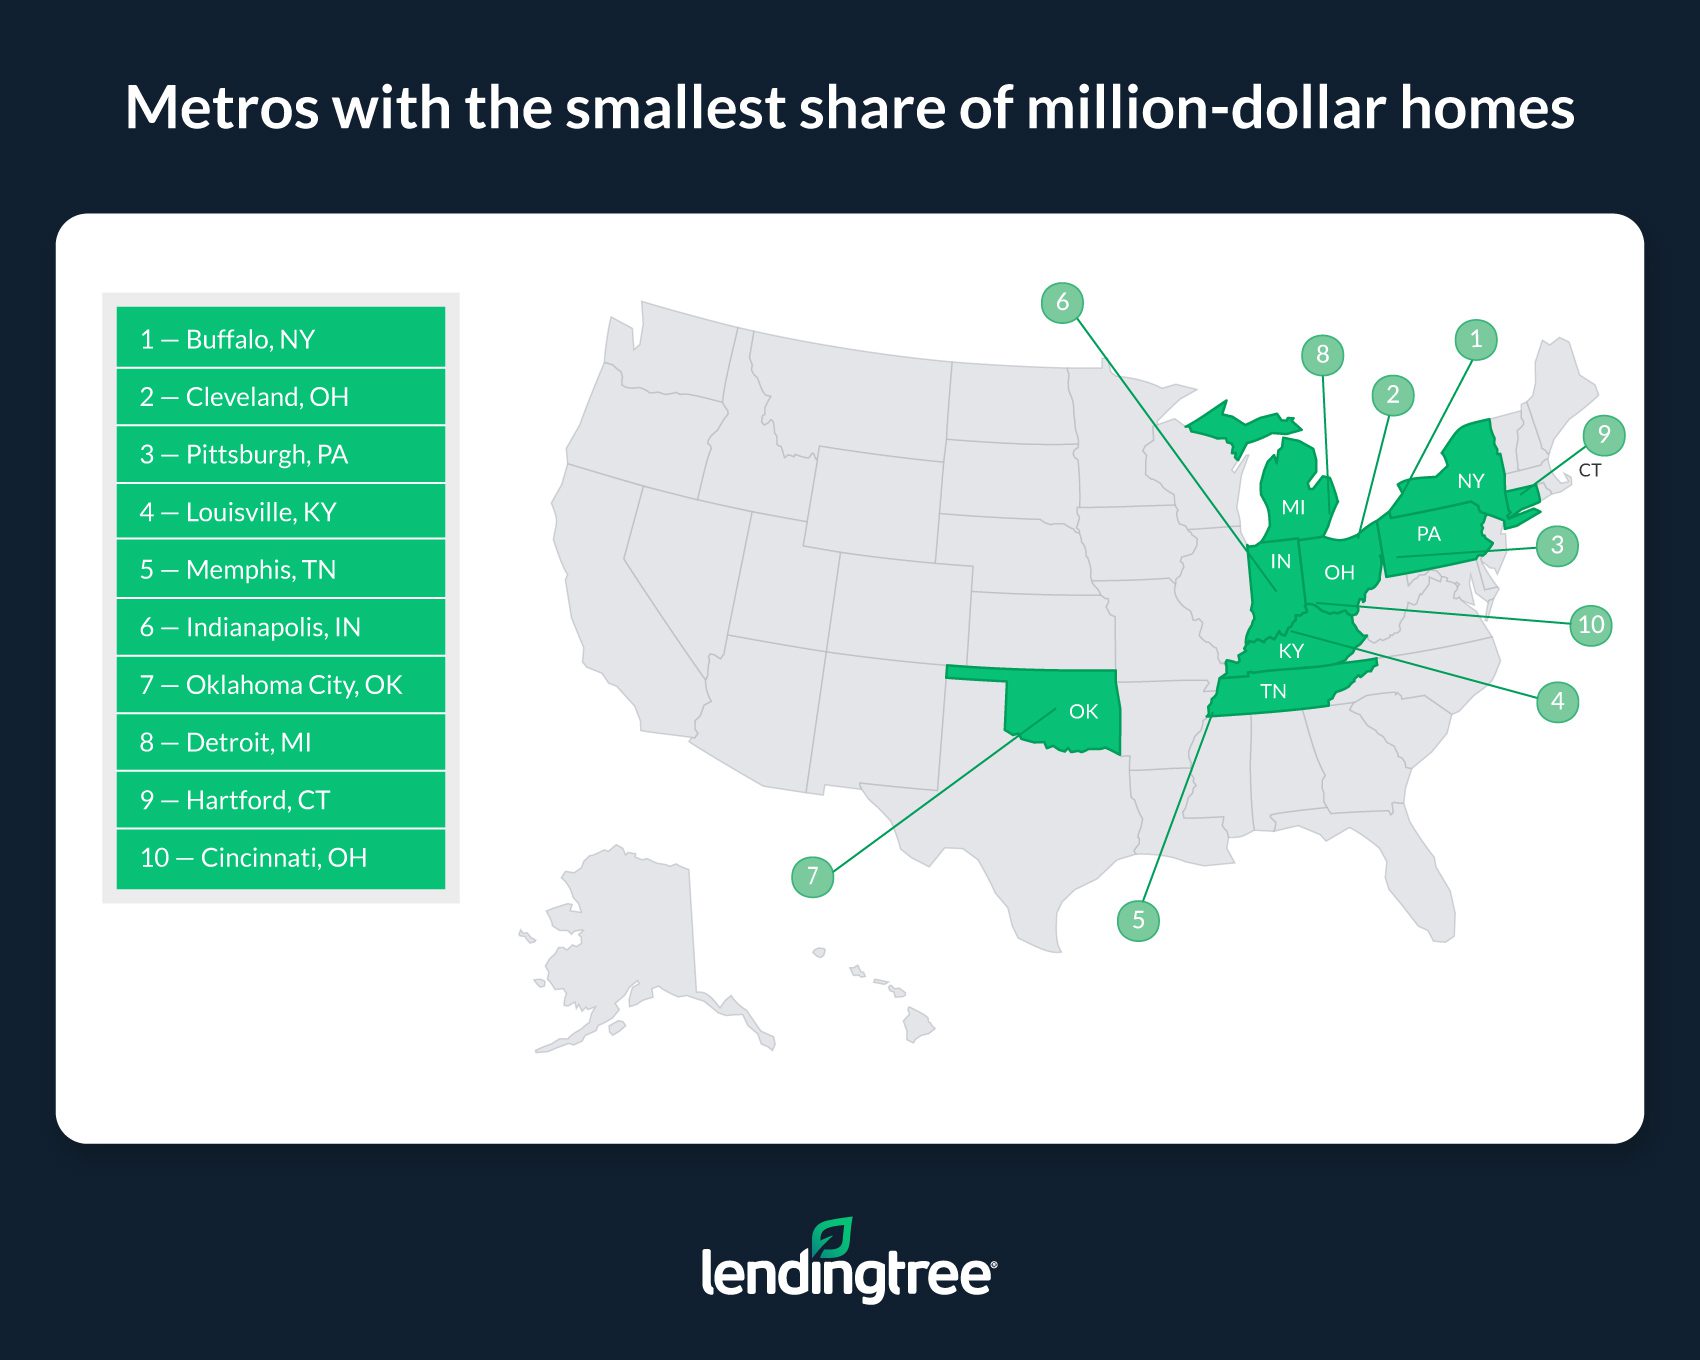
Metros with the lowest share of million-dollar homes
1. Buffalo, N.Y.
- Number of owner-occupied housing units: 341,086
- Number of owner-occupied units valued at $1 million or more: 2,545
- Percentage of owner-occupied units valued at $1 million or more: 0.75%
- Median value of owner-occupied housing units: $192,000
2. Cleveland
- Number of owner-occupied housing units: 584,025
- Number of owner-occupied units valued at $1 million or more: 4,819
- Percentage of owner-occupied units valued at $1 million or more: 0.83%
- Median value of owner-occupied housing units: $184,500
3. Pittsburgh
- Number of owner-occupied housing units: 732,879
- Number of owner-occupied units valued at $1 million or more: 6,581
- Percentage of owner-occupied units valued at $1 million or more: 0.90%
- Median value of owner-occupied housing units: $190,000
In today’s housing market, high prices are only one obstacle for buyers to overcome
Though persistently high home values have indeed priced many would-be buyers out of the market, high asking prices aren’t the only reason why buying a home can be difficult now.
On the contrary, other factors like steep mortgage rates and low housing inventory work together to make today’s housing market especially challenging to navigate.
For example, although they’ve come down from their recent peak in late 2022, 30-year fixed mortgage rates are sitting near a 20-year high. Because higher rates result in larger mortgage payments, buying a house can be far more expensive than it would’ve been this time last year or during the height of the pandemic — even in places where home prices have fallen slightly.
On top of this, a lack of homes for sale exacerbates many of today’s housing-related challenges. Low inventory pushes home prices higher and gives would-be buyers fewer options. Even for those who can afford to buy, it may remain unfeasible because they can’t find a home that’ll fit their needs.
At the end of the day, high home prices doubtlessly cause problems for many homebuyers. However, until mortgage rates decrease and housing inventory rises, buying-related challenges will likely remain prevalent in the housing market.
Tips for buying a home in a high-cost area
Just because you aren’t planning on spending $1 million or more on a home doesn’t mean you won’t find yourself in a high-cost area where you’ve got no choice but to spend extra to get a house. Here are three tips that can help buyers — including those who aren’t necessarily wealthy — make buying in an expensive area a bit less challenging.
- Look into different mortgage programs. Some kinds of mortgages, like those insured by the Federal Housing Administration (FHA), can be easier to qualify for than others. As a result, they can be good options for those who don’t have a stellar credit score or a ton of cash for a down payment. This is true even in high-cost areas, where FHA loan limits can be as high as $1,089,300.
- Boost your credit score. Though options exist for lower-credit borrowers, qualifying for a mortgage is typically easier when you have a higher credit score. In a high-cost area, good credit is often especially important, as it can help you get a lower rate on your mortgage that makes housing more affordable. As a result, you should try to boost your score before you decide to buy by paying down other debts and limiting how often you apply for new credit.
- Shop around and compare mortgage lenders before buying. The first mortgage lender you go to may not be the lender that’ll offer you the lowest possible rate on your loan. Because of this, shopping around for a lender before you buy can help you find a lower rate on your loan, lowering your monthly payment and saving you money over the lifetime of your loan.
Methodology
LendingTree ranked the nation’s 50 largest metropolitan statistical areas (MSAs) by the share of owner-occupied homes (with or without a mortgage) valued at $1 million or more.
The data comes from the U.S. Census Bureau’s 2021 American Community Survey with one-year estimates (the latest available at this study’s writing).
To determine the share of million-dollar homes in a metro, LendingTree divided the number of owner-occupied housing units priced at $1 million or more by the overall number of owner-occupied housing units in the area.