

LendingTree Study Reveals the U.S. Cities Where Homebuyers Have the Most Stretched Budgets
You’ll often hear the common rule of thumb that the price of a home shouldn’t exceed three times your annual income. This can help homebuyers avoid becoming house rich and cash poor.
However, following this rule isn’t as easy as it seems. Despite the national recession sparked by the global COVID-19 pandemic, pent-up buyer demand and a lack of affordable homes throughout much of the country has pushed home prices higher in recent months.
Although record-low mortgage rates may offset some of the price increases, many buyers will likely need to take out larger home loans. As home prices continue to rise, buyers with stagnant incomes may need to stretch their budgets to afford a mortgage.
To see where borrowers are stretching their dollars the most to buy homes, LendingTree used information from the 2019 Home Mortgage Disclosure Act’s dataset to analyze how much leverage buyers have in the nation’s 50 largest metro areas. “Leverage” refers to the ratio of how much money is borrowed compared to a person’s income. In other words, LendingTree’s study ranks the places where people are taking out the largest home loans relative to their incomes.
Key findings
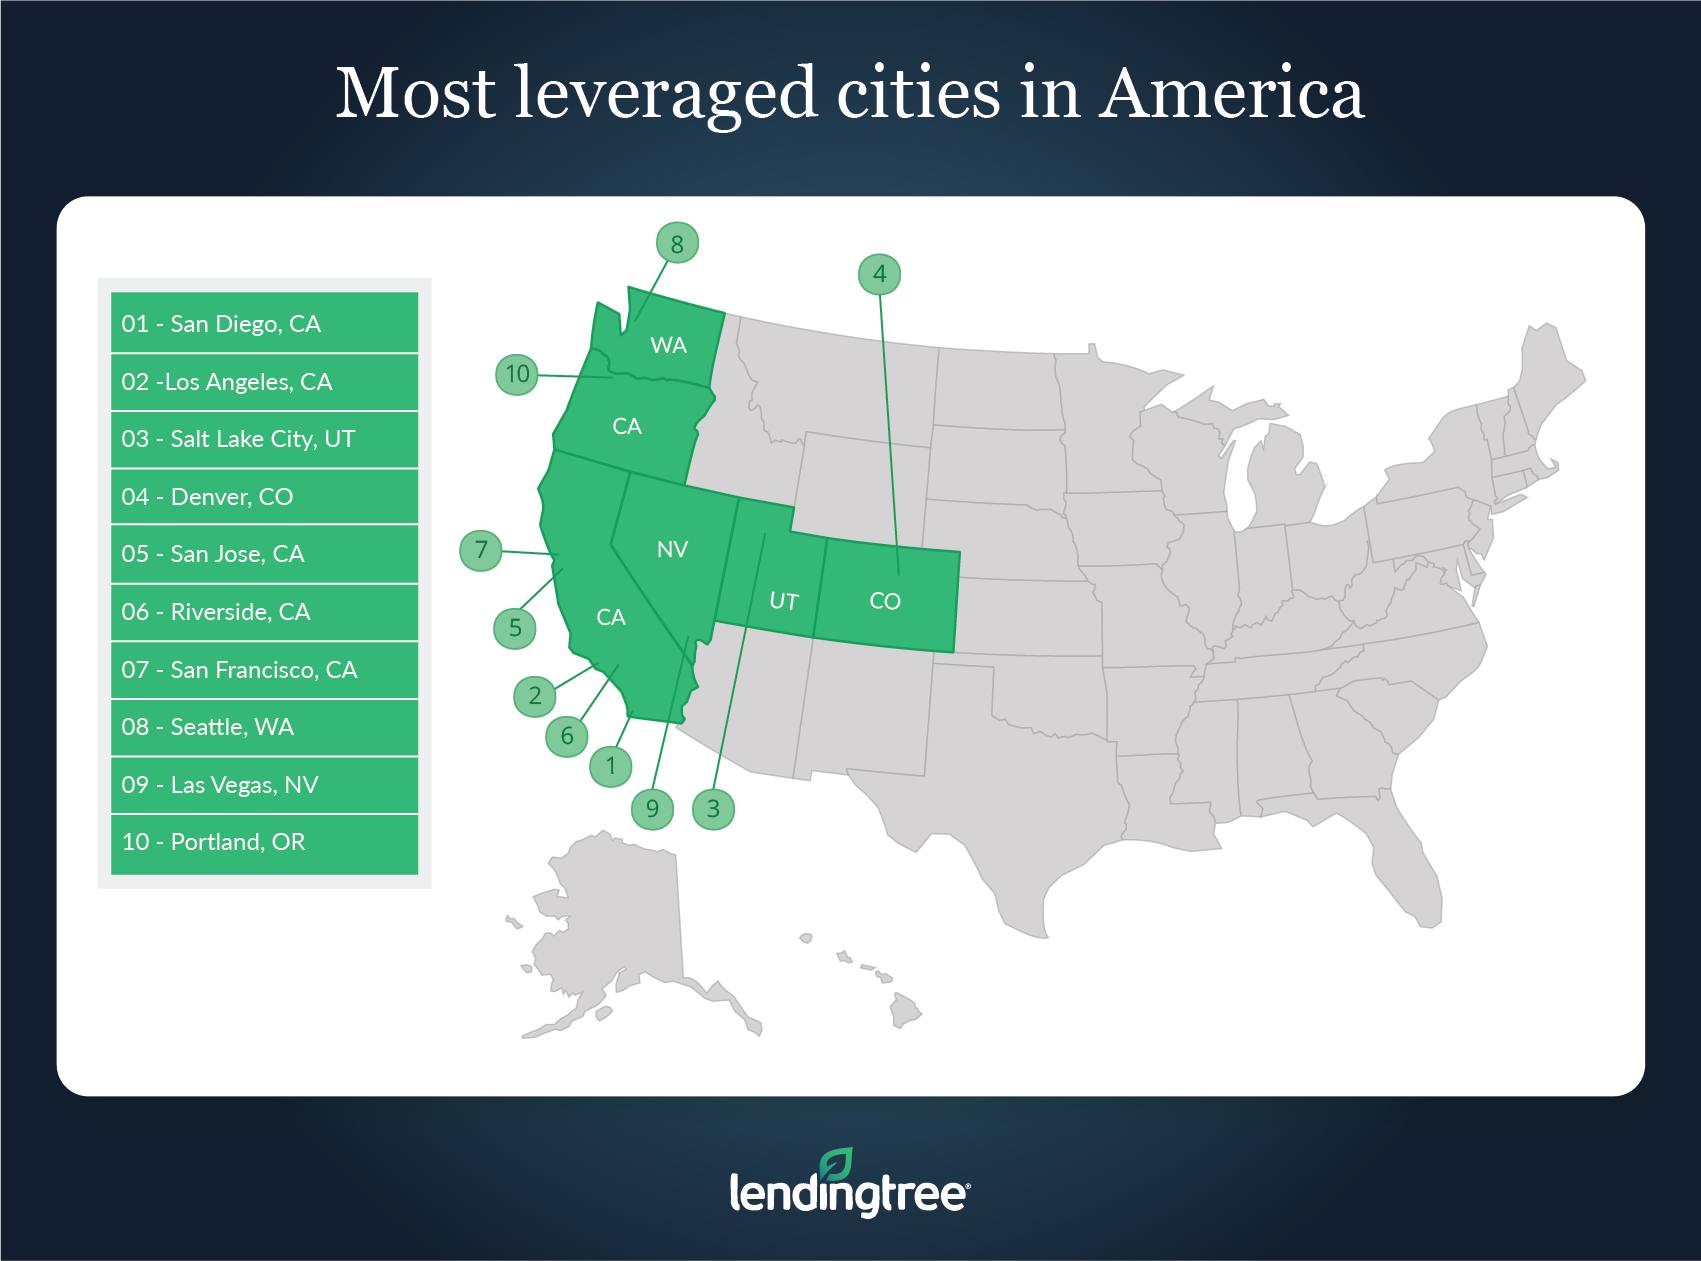
- Five of the top 10 cities where buyers are squeezed the most financially are in California. California is home to some of the most expensive real estate markets in the country, and it keeps getting pricier. As a result, some Californians, even those making six-figure salaries may need to borrow more than three times their annual income to be able to afford a home.
- San Diego and Los Angeles are the two cities where borrowers have to stretch their budgets the most. The leverage ratios in these two California cities are 3.79 and 3.66, respectively. Meanwhile, the median borrower income is $128,000 in San Diego and $138,000 in Los Angeles.
- Outside of California, Salt Lake City is the place with the highest leverage ratio. With a median income of $79,000 and a median loan amount of $285,000, the leverage ratio in Salt Lake City is 3.61. A housing shortage is one of the key reasons buyers in Utah’s capital may need to stretch their real estate budget in order to afford a home.
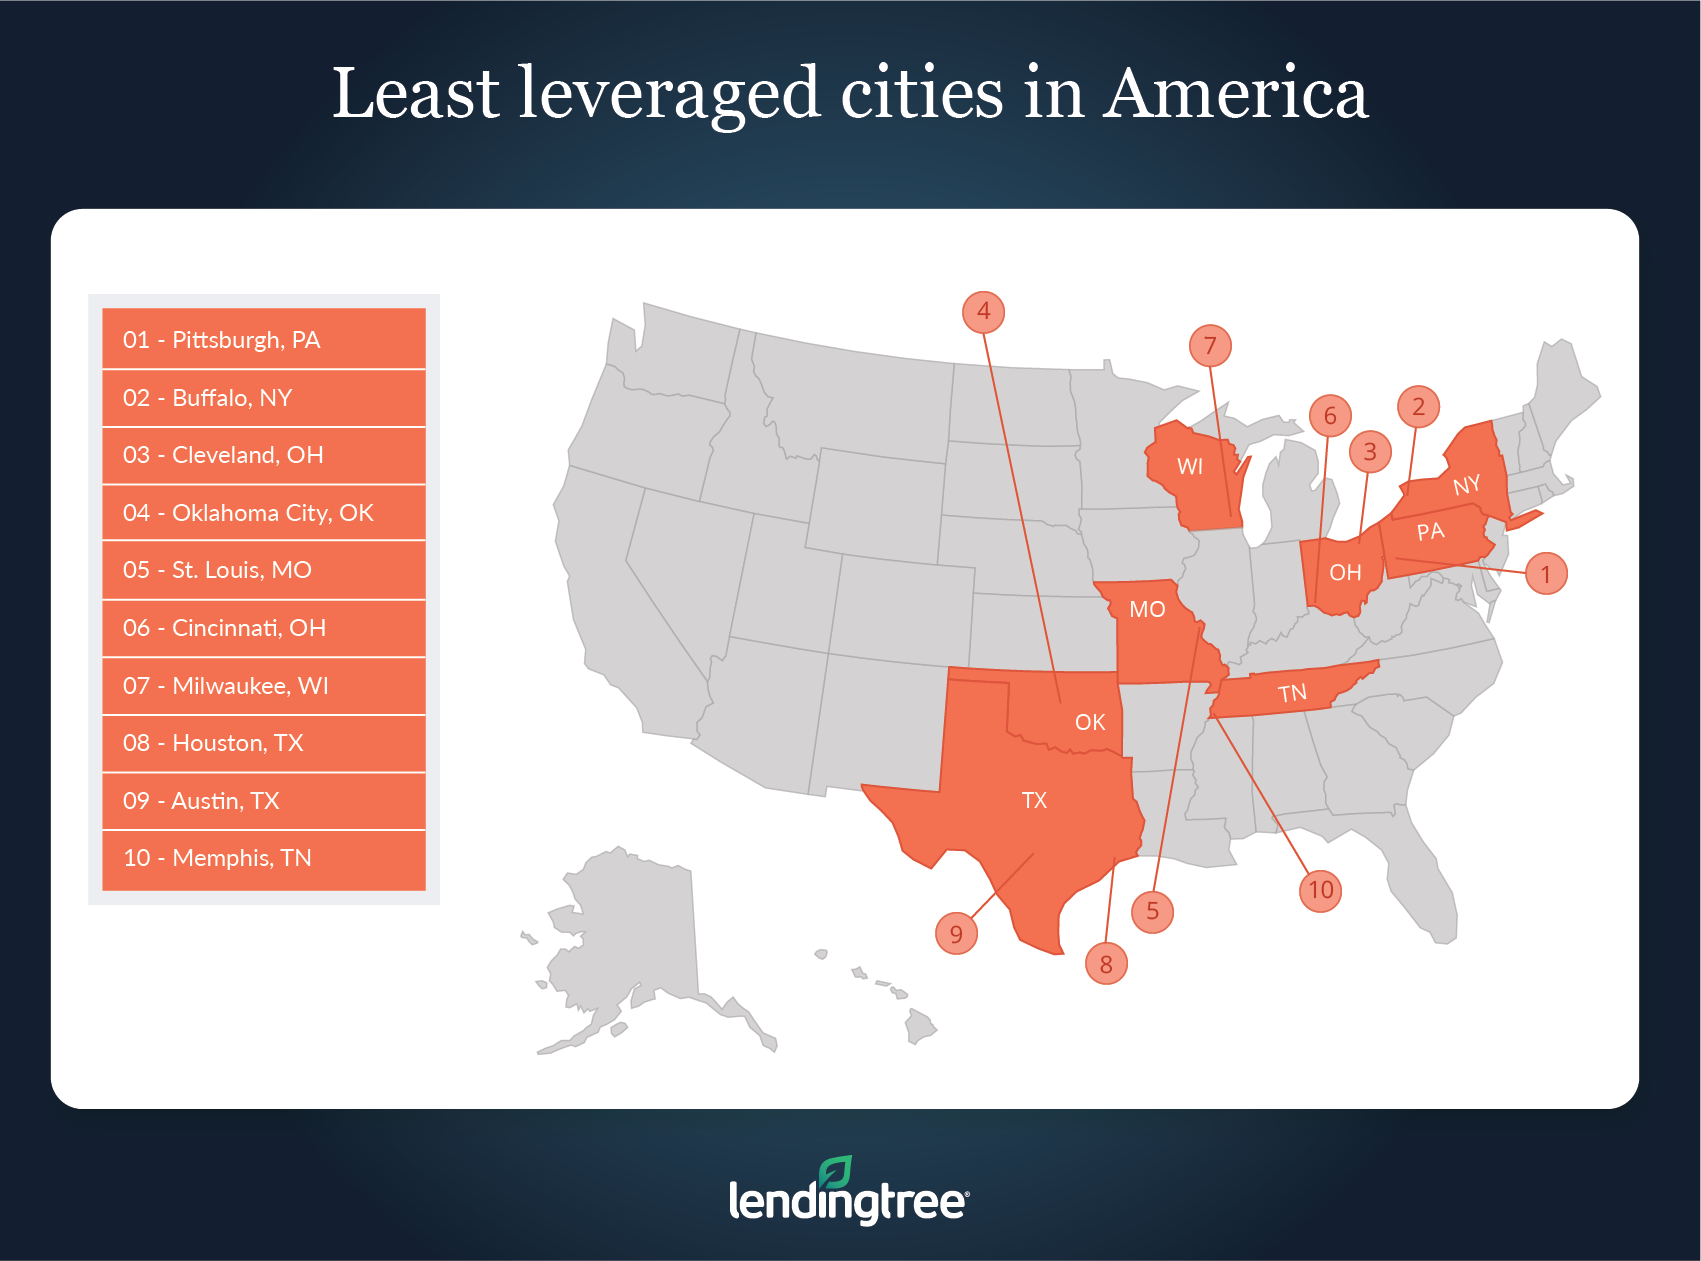
- Pittsburgh, Buffalo, N.Y. and Cleveland are the cities where buyers are taking the smallest loans relative to their incomes. An average leverage ratio of 2.11 could make these Rust Belt cities attractive to potential homebuyers.
The most leveraged cities in America
No. 1: San Diego
- Leverage ratio: 3.79
- Median mortgage amount: $485,000
- Median borrower income: $128,000
No. 2: Los Angeles
- Leverage ratio: 3.66
- Median mortgage amount: $505,000
- Median borrower income: $138,000
No. 3: Salt Lake City
- Leverage ratio: 3.61
- Median mortgage amount: $285,000
- Median borrower income: $79,000
No. 4: Denver
- Leverage ratio: 3.51
- Median mortgage amount: $355,000
- Median borrower income: $101,000
No. 5: San Jose, Calif.
- Leverage ratio: 3.45
- Median mortgage amount: $725,000
- Median borrower income: $210,000
The least leveraged cities in America
No. 1: Pittsburgh
- Leverage ratio: 2.09
- Median mortgage amount: $165,000
- Median borrower income: $79,000
No. 2: Buffalo, N.Y.
- Leverage ratio: 2.10
- Median mortgage amount: $145,000
- Median borrower income: $69,000
No. 3: Cleveland
- Leverage ratio: 2.15
- Median mortgage amount: $155,000
- Median borrower income: $72,000
No. 4: Oklahoma City
- Leverage ratio: 2.26
- Median mortgage amount: $165,000
- Median borrower income: $73,000
No. 5: Cincinnati (Tie)
- Leverage ratio: 2.33
- Median mortgage amount: $175,000
- Median borrower income: $75,000
No. 5: St. Louis (Tie)
- Leverage ratio: 2.33
- Median mortgage amount: $175,000
- Median borrower income: $75,000
Methodology
To determine the cities with the most leveraged homebuyer budgets, LendingTree looked at 2019 Home Mortgage Disclosure Act (HMDA) data for the nation’s 50 largest Core-Based Statistical Areas (CBSAs). HMDA is a federal law that requires most lenders to report their origination activity every year. From this HMDA data, which represents more than 5.3 million mortgage purchase loans, the median amount borrowed was divided by the median income for all purchases in the HMDA database for each city looked at in LendingTree’s study.
LendingTree research analyst Jacob Channel contributed to this report.