Where Home Price Inequality Is Highest
New LendingTree study ranks metros by housing value inequality.
Inequality is the defining economic debate of our times. Since 1980, the majority of income growth in the United States has accrued to the top of the income scale, a trend that accelerated following the 2007-08 financial crisis. Home values have finally recovered from the most recent housing crisis to the extent that affordability is now a concern. In many large cities, the median-priced home is now out of reach of median income households.
The GINI coefficient, a well-regarded metric, is the most commonly used measure of economic inequality. The coefficient ranges from 0 (complete equality where every value is the same) to 1 (complete inequality where one entity has 100% of the value and all others have none). Thus, a higher GINI coefficient means there is more inequality.
With that backdrop in mind, LendingTree analyzed homes in the 50 largest metro areas to determine the GINI coefficient of home values in each metro to measure home price inequality in each market.
We also show the values of the 5th and 95th percentile homes and their ratio to provide a more tangible measure of home value inequality. Our data below ranks the top 50 cities by the GINI coefficient.
Key Findings
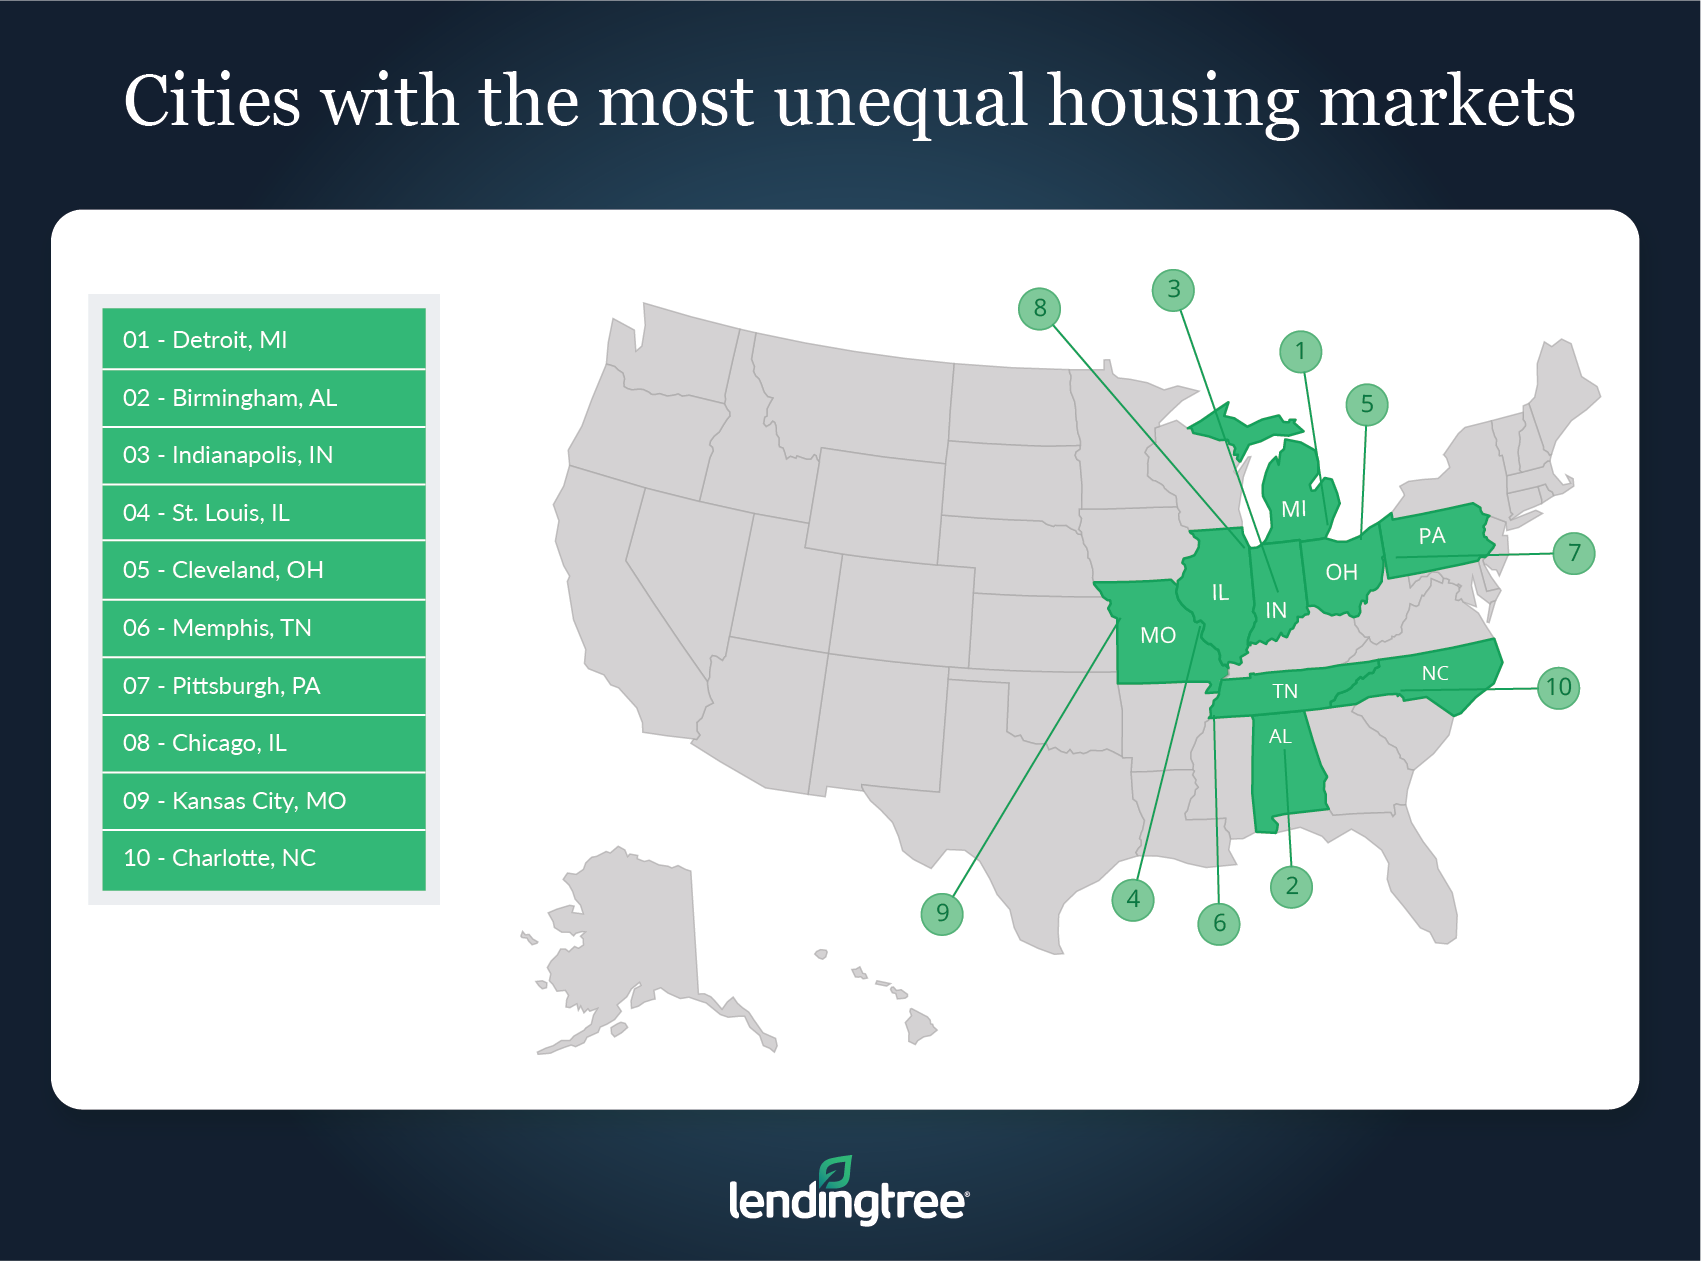
- Detroit, Birmingham, Ala. and Indianapolis have the highest home price inequality in the nation, with a level of inequality twice that of the most equal markets.
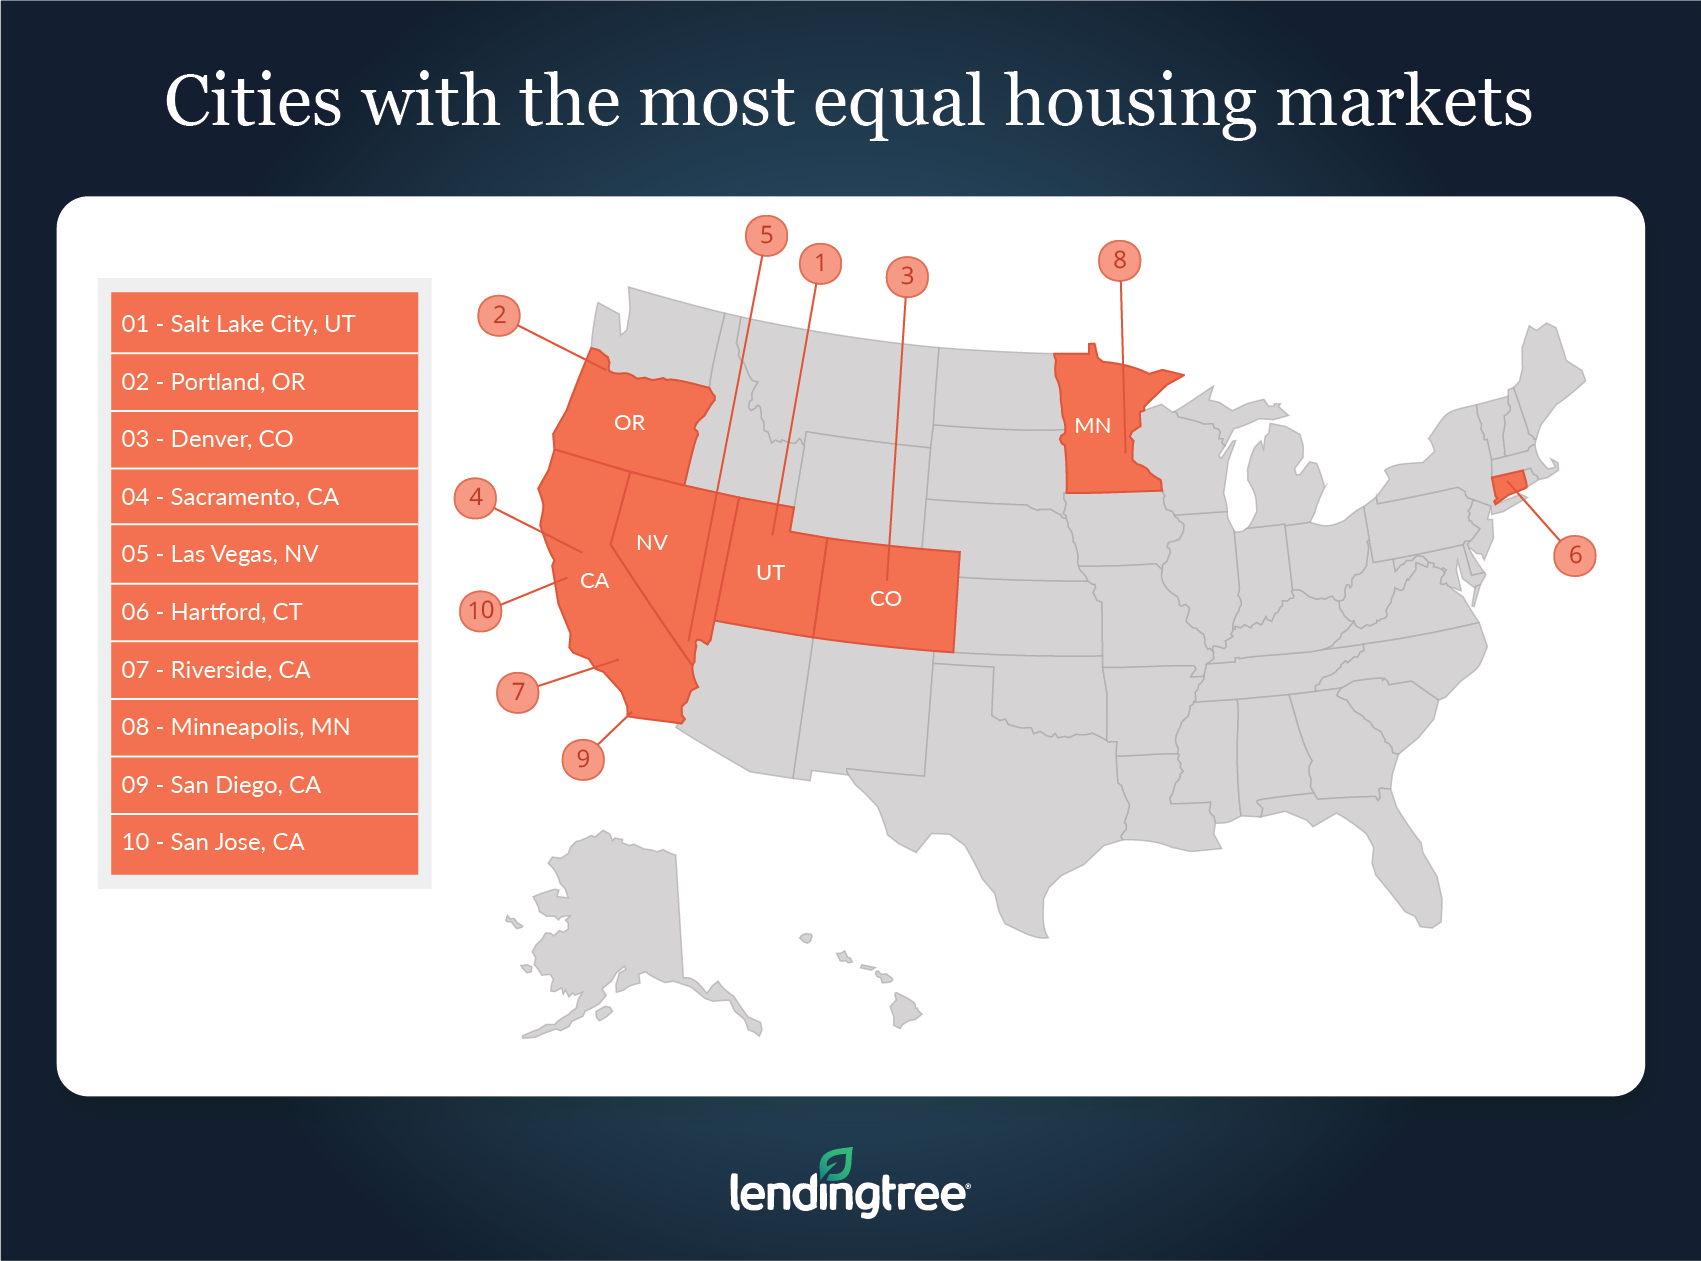
- Salt Lake City, Portland, Ore. and Denver have the least home price inequality. The 95th percentile of home values is 3x the value of the 5th percentile in these markets, compared with over 10x the value in the most unequal markets.
- High home prices don’t necessarily mean high inequality. The San Jose and San Francisco metros, with the highest values for the 95th percentile of homes ($2.7 million and $2.3 million respectively) ranked No. 41 and No. 33 out of 50 for inequality.
- The metros with the most inequality tended to have very low prices for the 5th percentile of home values. Of the 10 most unequal markets, none had a 5th percentile home value of $100,000 or more, and averaged $48,500. The most equal markets had a $242,100 average value for the 5th percentile of homes.
- The World Bank lists the income GINI for the U.S. at 0.415 in 2016. Only our top ranked city, Detroit at 0.446, was above this level. So income inequality is greater than home value inequality, a phenomenon also reflected in the fact that wealthier households don’t need to spend as high a portion of their earnings on housing.
- The Midwest dominates the most unequal while the West dominates the most equal.
- The most equal markets are less affordable for borrowers with low incomes.
The case for housing inequality
As we went through the analysis, we reached a conclusion that might be counterintuitive to conventional thought — housing value inequality might be a good thing.
Cities with more home value inequality have a wider distribution of home values, which means that families earning lower incomes may still have the opportunity to access homeownership in these cities. The concurrent presence of high value homes suggests that their economies are vibrant enough to support higher earning jobs as well. Looked at in this manner, home value inequality could be beneficial.
Cities with the most unequal housing markets
#1 Detroit
GINI Coefficient: 0.446
95th Percentile Home Price: $431,000
5th Percentile Home Price: $32,000
Multiple of 95th to 5th Percentile home price: 13.5
#2 Birmingham, Ala.
GINI Coefficient: 0.392
95th Percentile Value: $518,000
5th Percentile Value: $45,000
Multiple of 95th to 5th Percentile: 11.5
#3 Indianapolis
GINI Coefficient: 0.385
95th Percentile Value: $445,000
5th Percentile Value: $44,000
Multiple of 95th to 5th Percentile: 10.1
Cities with the most equal housing markets
#48 Denver
GINI Coefficient: 0.226
95th Percentile Value: $885,000
5th Percentile Value: $260,000
Multiple of 95th to 5th Percentile: 3.40
#49 Portland, Ore.
GINI Coefficient: 0.217
95th Percentile Value: $772,000
5th Percentile Value: $237,000
Multiple of 95th to 5th Percentile: 3.25
#50 Salt Lake City
GINI Coefficient: 0.210
95th Percentile Value: $597,000
5th Percentile Value: $191,000
Multiple of 95th to 5th Percentile: 3.10