As Bob Dylan so poetically sang, “the times they are a-changin’.”
This is particularly the case in cities across the U.S. In fact, the landscapes in some areas and states (especially the Northwest) have changed dramatically over the last five years.
Utilizing data from Zillow and AtoZDatabases, we looked at cities that have changed the most in recent years. We examined the cost of home ownership, rent values, and changes in foreclosure rates as well as increases in business storefronts and levels of diversity to see where exactly in the U.S. this shift is happening the fastest. Where and how are Americans reshaping cities? Continue reading to learn.
American Communities That Have Changed the Most
Across the U.S., cities are changing. Some areas are growing each year with tens of thousands of new residents, increasing the population by whole percentage points.
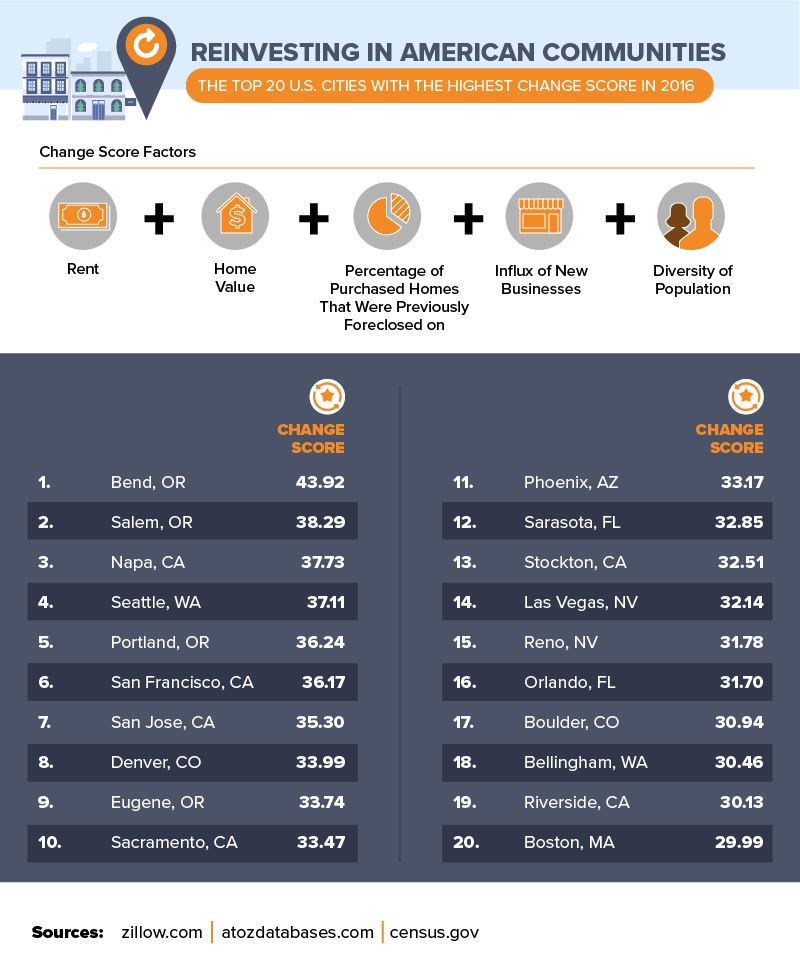
But change isn’t just about growth. When we looked at cities with the highest change score, we used data that reported on the cost of rent, changes in home value, the percentage of sold homes that were previously foreclosed on, new businesses, and the diversity of the population. The city with the highest change score in 2016 was Bend, Oregon (almost 44 points). Bend – which is 162 miles outside of Portland – has seen one of the most dramatic shifts in its quality of living. From new small businesses to transportation projects focused on walkers and bike riders, Bend has seen an increase in its amenities as well as housing market growth.
Salem, Oregon, had a change score of just over 38 points. While the metropolitan area of Portland (less than 48 miles north of Salem) grew by over 100 people a day between 2014 and 2015, that growth continues to spill over into surrounding Portland areas.
Napa, California, and Seattle, Washington, each had a change score of roughly 37 points. Both cities experienced major growth in 2016, and while the cost of living (and housing) in these areas has increased, so have working opportunities.
Other cities with high change scores include Portland, Oregon (over 36 points); San Francisco, California (36 points); and San Jose, California (more than 35 points).
The Rise of Rent
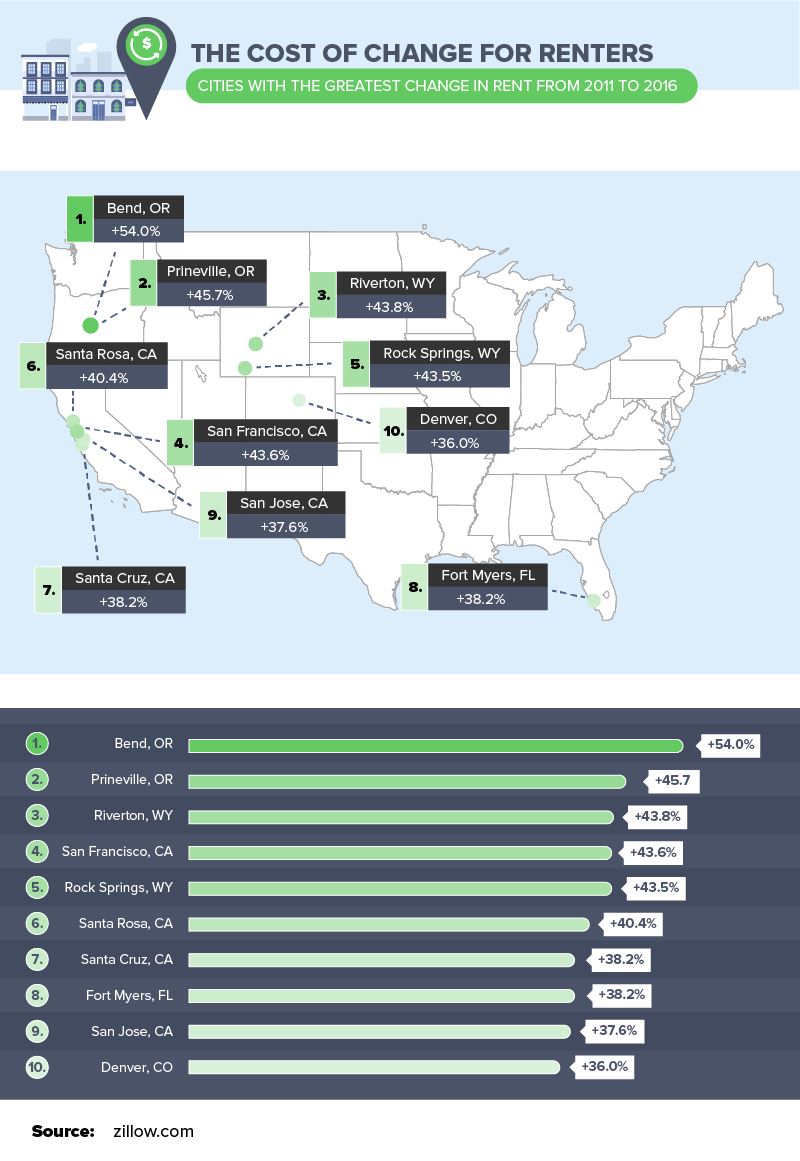
Despite the housing market growing since the economic crash in 2008, millennials aren’t buying houses as often as previous generations. In fact, the percentage of young people who currently own a home is at a 30-year low as of 2016. While these reasons can be entirely voluntary (some simply don’t want the upkeep of a house), this shift – coupled with growing change in certain areas – can cause rent to increase.
In Bend, Oregon, the cost of rent rose nearly 54 percent between 2011 and 2016. With a growing population and shifting economies, the cost of rent in many cities has increased substantially. Similarly, other Oregon cities like Prineville, as well as Riverton, Wyoming, and San Francisco, California, all saw rent rise by 43 percent or more. Given the average cost of a one-bedroom apartment in San Francisco is $3,500 a month, that’s a pretty big chunk of change.
The Rise of Home Value
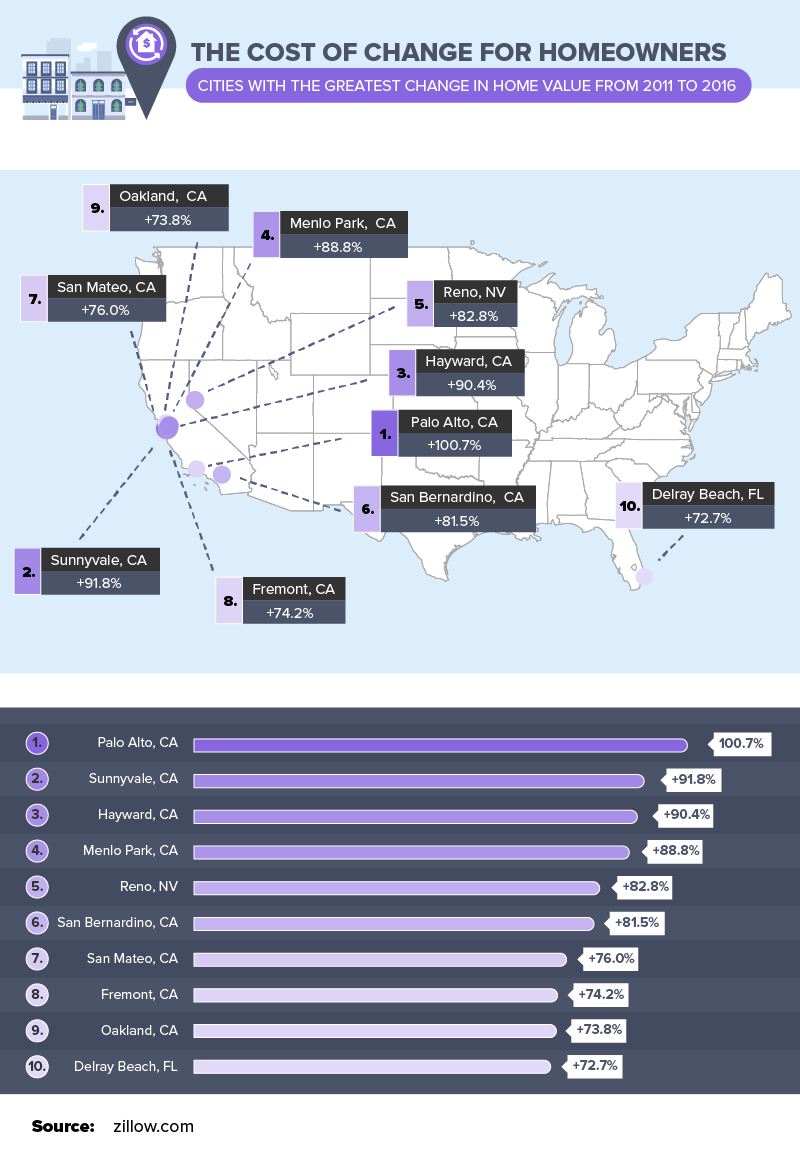
A change in the quality of living in a particular area can cost homeowners as well. As value-added benefits in a location increase – and as the population grows and available units become restricted – the cost of housing must rise to meet the demand of incoming buyers.
Just south of one of most expensive places to live in the United States, Palo Alto, California, has had the greatest increase in home value from 2011 to 2016, followed closely by Sunnyvale, California, and Hayward, California (more than 90 percent). Menlo Park, California; Reno, Nevada; and San Bernardino, California, also saw their home values increase by over 80 percent.
The Rise of the Value of a City
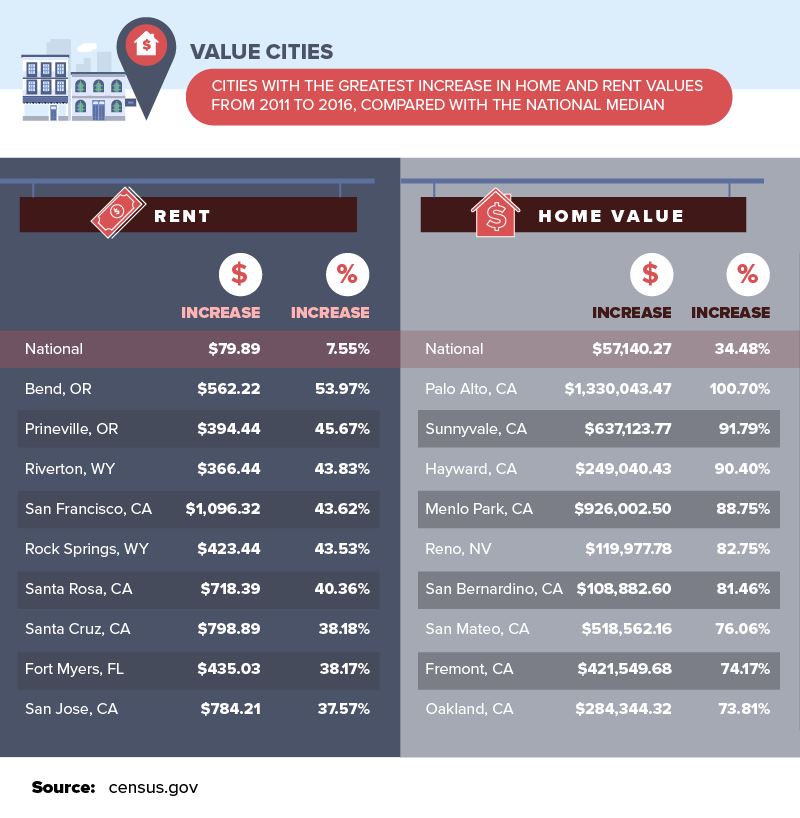
While median rent and home values have increased substantially over the national median, median home values in Palo Alto, California, have grown by well over $1,000,000. In 2011, the value of a house in Palo Alto was already over $1,000,000, while in 2016 , that value has increased to over $2,500,000. In some areas, the median value has also risen sharply, though to a lesser extent. In Sunnyvale, California, the cost of a home in 2011 was just under $700,000. In 2016 it’s over $1,300,000. The national median home value has risen over the last five years and has increased by just over $57,000, a positive adjustment of 34 percent.
Median rent value in San Francisco is the highest. While median rent was around $2,500 a month in 2011, that price has increased by over $1,000 a month in 2016. Additionally, the median rent in San Jose, California, and Santa Rosa, California, rose from around $2,000 to $2,500 and $2,900 a month. Unlike housing costs, the national median rent has stayed relatively consistent at just over $1,000 a month.
Giving Life to Foreclosed Homes
From neighbors who’ve lost their home to declining property values in surrounding areas, foreclosure is bad for business.
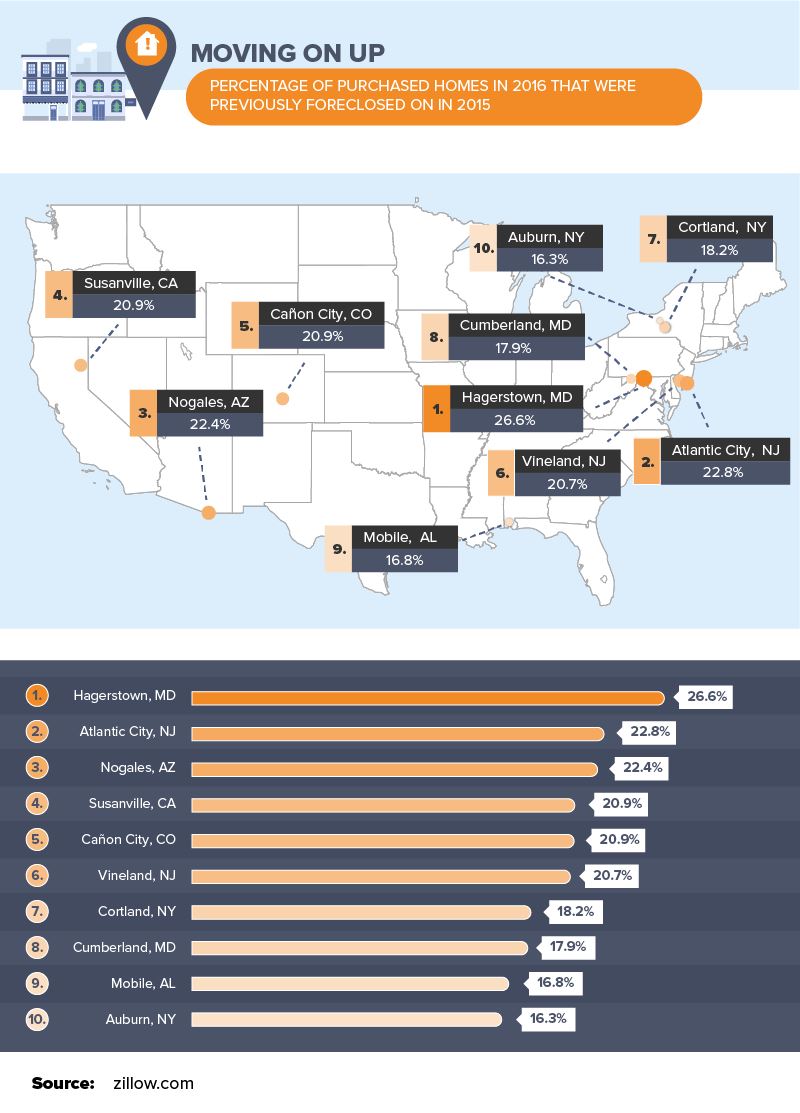
We looked at the percentage of homes sold in 2016 that were previously foreclosed on in 2015. In Hagerstown, Maryland, close to 27 percent of newly purchased homes were previously foreclosed on. In Nogales, Arizona, over 22 percent of houses coming off the market experienced foreclosures the year before; and in Atlantic City, New Jersey, it was almost 23 percent.
Susanville, California; Cañon City, Colorado; and Vineland, New Jersey, also reported high percentages of previously foreclosed on homes (almost 21 percent each).
Changes in 2016 Home Values
Across the country, home values are rising. In some cities, nearly every home is increasing in value.
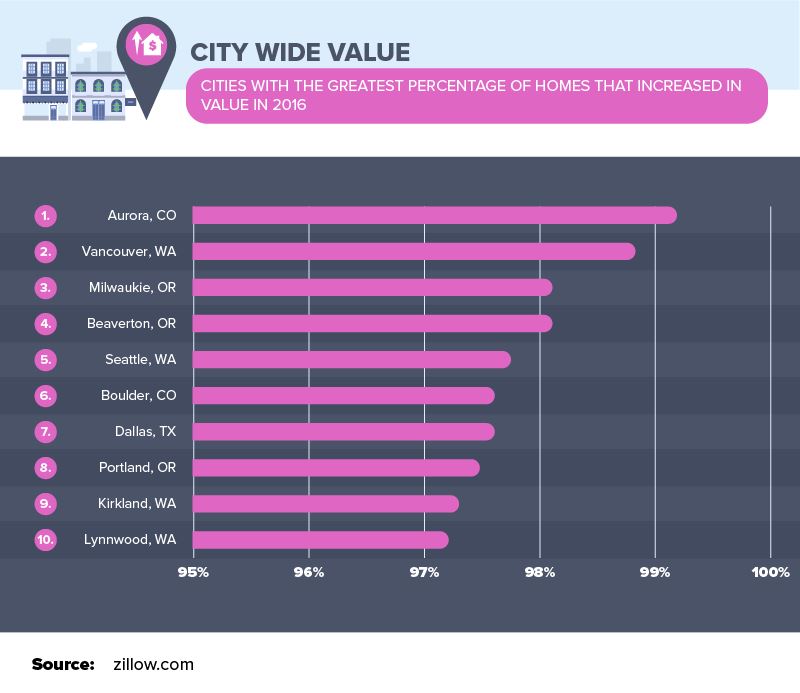
In fact, in Aurora, Colorado, over 99 percent of homes have increased in value. Just over 10 miles outside of Denver, Aurora – one of the fastest growing cities in the country – saw the largest percentage of homes increase in value anywhere in the nation.
The Northwest also saw a surge in residential values. Vancouver and Seattle in Washington, as well as Milwaukie and Beaverton in Oregon, saw nearly 98 to 99 percent of homes increase in 2016. Other areas in Colorado, including Boulder, saw a similar trend (almost 98 percent), while Dallas, Texas, one of the southernmost states to experience this increase, saw a 97 percent of homes increase in value in 2016.
Business Gains
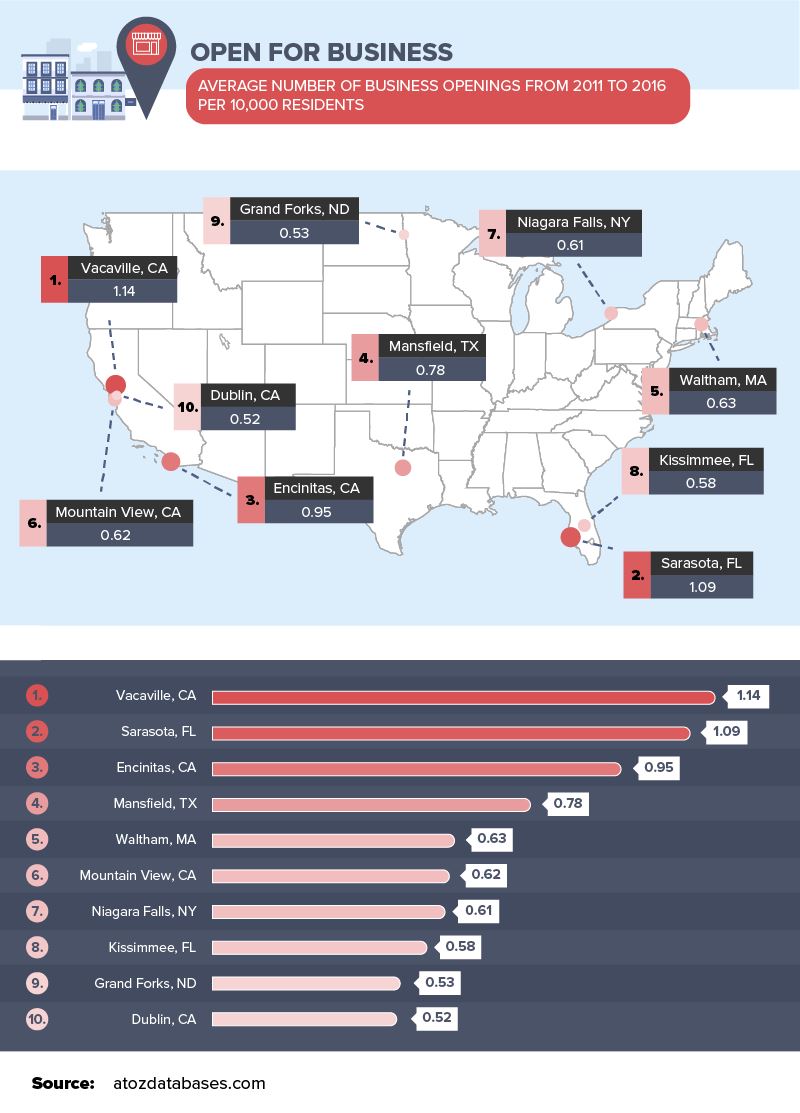
When neighborhoods and communities grow and change, businesses can grow too. In looking at new business opportunities between 2011 and 2016 by companies like Starbucks, Whole Foods Market, and The Fresh Market, we could see the average number of business openings per 10,000 residents.
The largest business growth came out of Vacaville, California. Located in the northern part of the state, Vacaville added more than one new business for every 10,000 residents in the area and had a lower percentage of unemployment than the national average. Recent and future job growth in Vacaville is also above the national average, showcasing positive changes in the area. Sarasota, Florida, (which is ranked as one of the fastest growing cities in the U.S.) saw similar business expansion, with just over one new business for every 10,000 people residing there between 2011 and 2016.
Other cities with growing business opportunities include Encinitas, California; Mansfield, Texas; and Waltham, Massachusetts, with almost one new business per every 10,000 residents each.
Local Levels of Diversity
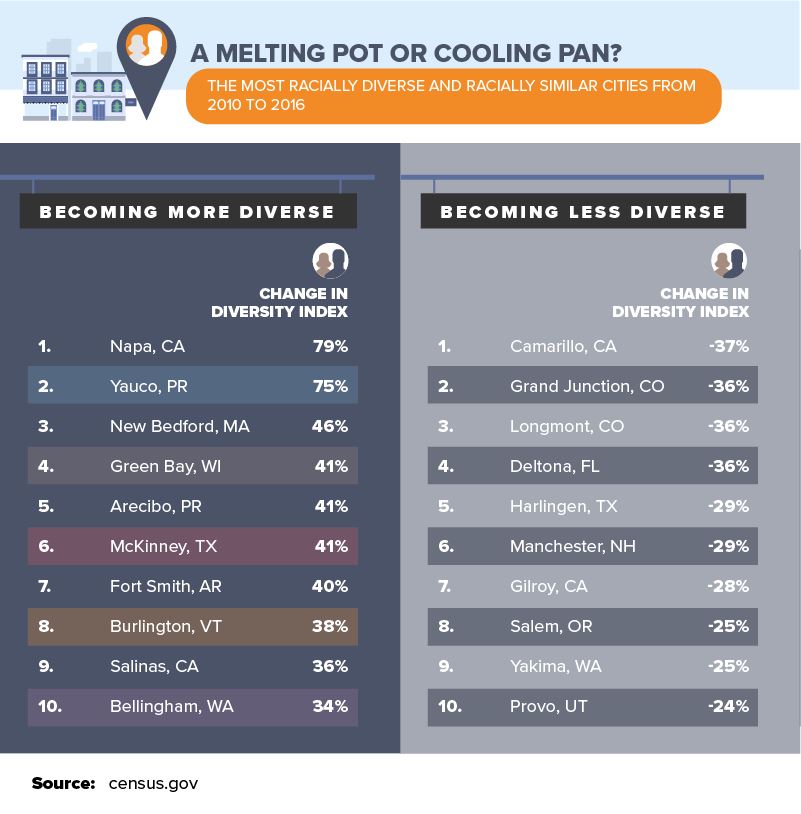
The last thing we looked at were areas that had the greatest change in diversity. Cities with a positive change represent a trend toward a more heterogeneous, or diverse, community while a negative change shows cities that are becoming less diverse. Napa, California scored the highest – with a 79 percent increase on the Simpson index.
Yauco, Puerto Rico, experienced a 75 percent increase on the diversity index since 2010. While the inland city saw a reduction in its population between 2010 and 2015; the uniqueness among residents living in this area ranks it No. 2 for diverse U.S. cities.
Other areas like New Bedford, Massachusetts (46 percent); Green Bay, Wisconsin (41 percent); and Arecibo, Puerto Rico (41 percent) have seen above-average changes as well.
The city with the largest decrease to the Simpson diversity index is Camarillo, California, with a -37 percent change. Grand Junction, Colorado; Longmont, Colorado; and Deltona, Florida, show a similar trend toward a more homogenous population.
Changing Landscapes
Change isn’t always easy and has its advantages and disadvantages. The rising price of home ownership and renter’s fees show populations in some areas are booming, but increased opportunities for business and, in some cases, diversity highlights the benefits of our evolving cities.
Whether you’re considering moving to one of these cities or setting up a new business front, LendingTree is your solution for home and business loans. We’ve delivered more than 55 million loan requests for everything from home mortgages to student loans. Access your free credit score or utilize our mortgage calculator on our website to learn everything you need to know before applying for a home loan and moving to one of these changing American cities.
Methodology
Home data were downloaded from Zillow.
We chose a sampling of businesses that were representative of a variety of stores appearing in neighborhoods with renewal projects that cause an influx of a new group of people. We wanted to get a spread of businesses that represented fast food and drink locations, upscale chain restaurants, grocery stores, and retail shopping. We analyzed the following business openings: Panera Bread, Starbucks Coffee, Jamba Juice, Buffalo Wild Wings, The Cheesecake Factory, California Pizza Kitchen, Ruth’s Chris Steak House, Bonefish Grill, Chipotle Mexican Grill, Five Guys Burgers and Fries, Nordstrom, Neiman Marcus, Bloomingdale’s, Saks Fifth Avenue, Whole Foods Market, Inc., Trader Joe’s, and The Fresh Market.
Race distribution data were pulled from the census at a city level, and the diversity index was determined using the Simpson index. The number is defined as the probability that two entities taken at random from the dataset of interest represent the same type. In this case, the data set is the racial distribution of a city.
Sources
census.gov
atozdatabases.com
zillow.com
http://www.bendbulletin.com/localstate/bend/4197727-151/shaping-bends-west-side
http://www.oregonmetro.gov/news/portland-region-nears-24-million-residents-growing-41000-last-year
http://www.theatlantic.com/business/archive/2016/08/millennials-the-mobile-and-the-stuck/497255/
http://www.sfgate.com/bayarea/article/San-Francisco-rent-cost-drop-rental-6690357.php
http://www.nber.org/digest/mar07/w12355.html
http://www.bestplaces.net/economy/city/california/vacaville
http://www.geekwire.com/2015/big-tech-companies-continue-to-set-up-shop-in-seattle-and-lease-rates-soar-as-a-result/
Lending Our Content
Do you like what you see? We encourage journalists to use any of the graphics included in the above piece for noncommercial purposes. Just make sure to give credit where it’s due by properly citing LendingTree.com in your coverage as well as providing a link back to this page.