Grocery Bills Exceed $10,000 in Some States as Organic Produce Costs 59% More
Going organic at the grocery store has always come at a cost, but that cost is significant — and growing.
Already, organic fruits and vegetables cost 59.0% more on average than their conventional counterparts. And over the course of a year, organic prices surged 10.0%, while conventional prices remained nearly unchanged.
Here’s a closer look.
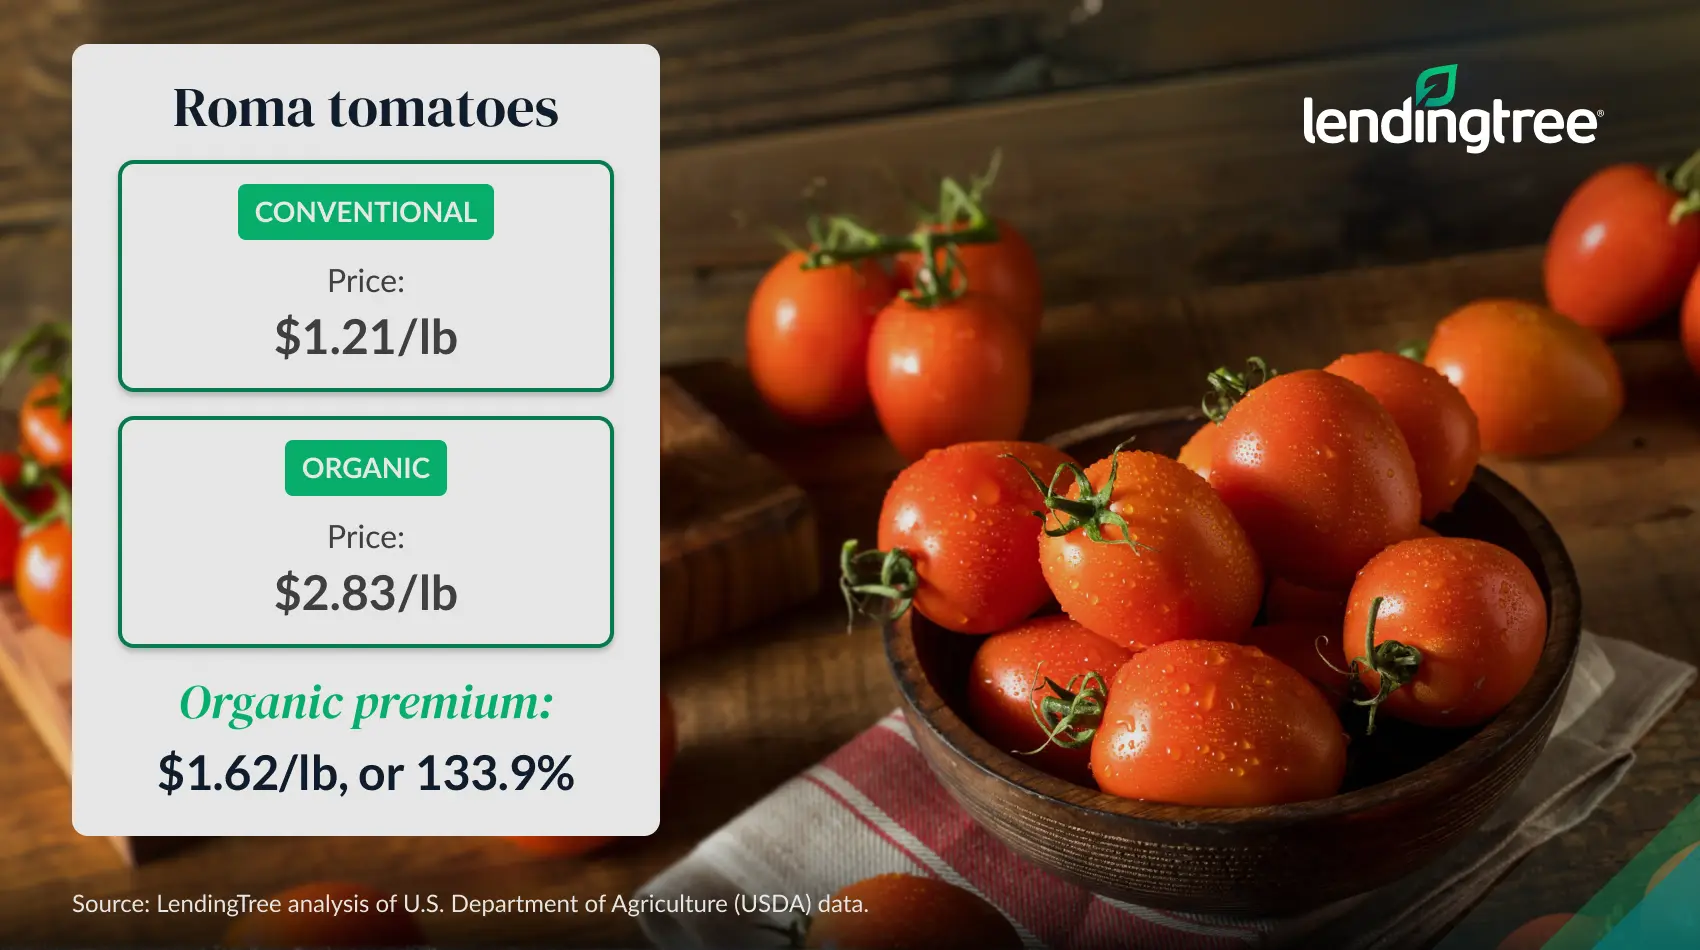
- Organic fruits and vegetables cost an average of 59.0% more than their conventional counterparts. The gap is far larger for some items: Organic Roma tomatoes cost 133.9% more, while organic orange and yellow bell peppers are both 131.5% more expensive. Overall, nearly half of the 52 items analyzed cost at least 50.0% more when purchased as organic.
- Organic produce prices rose by 10.0% between January 2025 and January 2026, while conventional prices were nearly flat at 0.3%. Some organic items more than doubled in price, including Roma tomatoes (185.9%) and green bell peppers (117.4%). In fact, nine of the 10 largest price increases across all items analyzed were for organic produce.
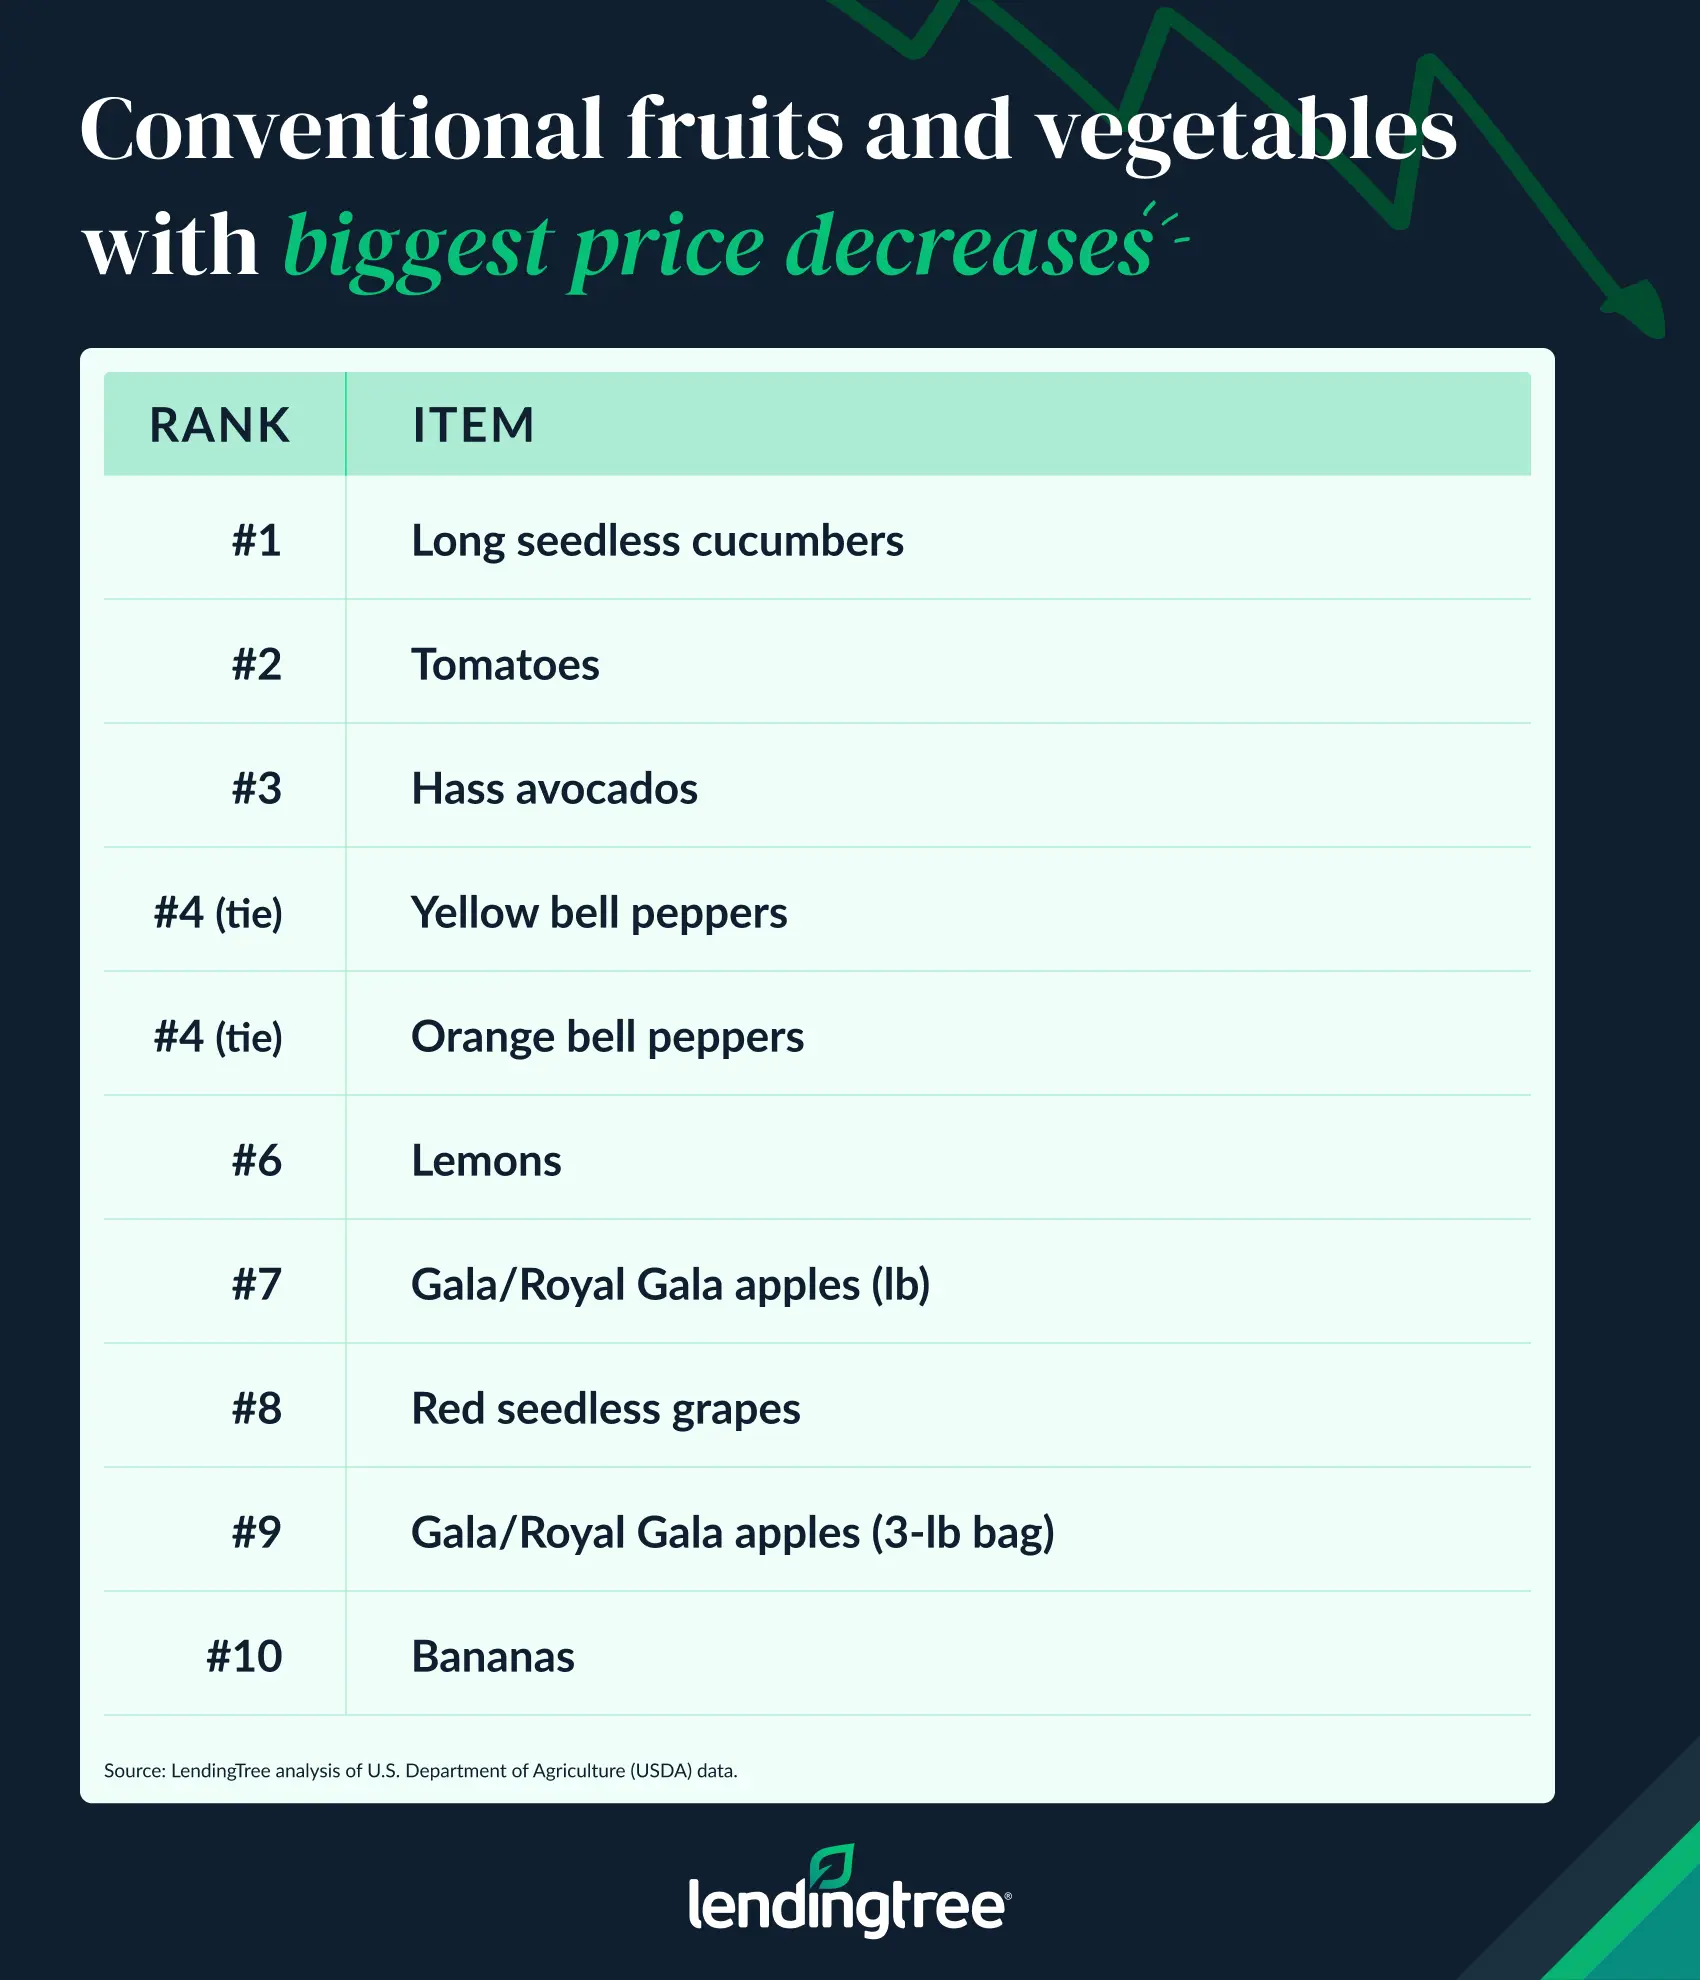
- Still, many grocery items — especially conventional ones — became cheaper between January 2025 and January 2026. Prices fell for 25 of 52 conventional items, compared with 17 organic items. The biggest conventional drops were in long seedless cucumbers (down 40.5%), tomatoes (down 28.0%) and Hass avocados (down 22.4%). On the organic side, Gala/Royal Gala apples (down 33.6%), Honeycrisp apples (down 33.2%) and raspberries (down 32.3%) saw the steepest declines.
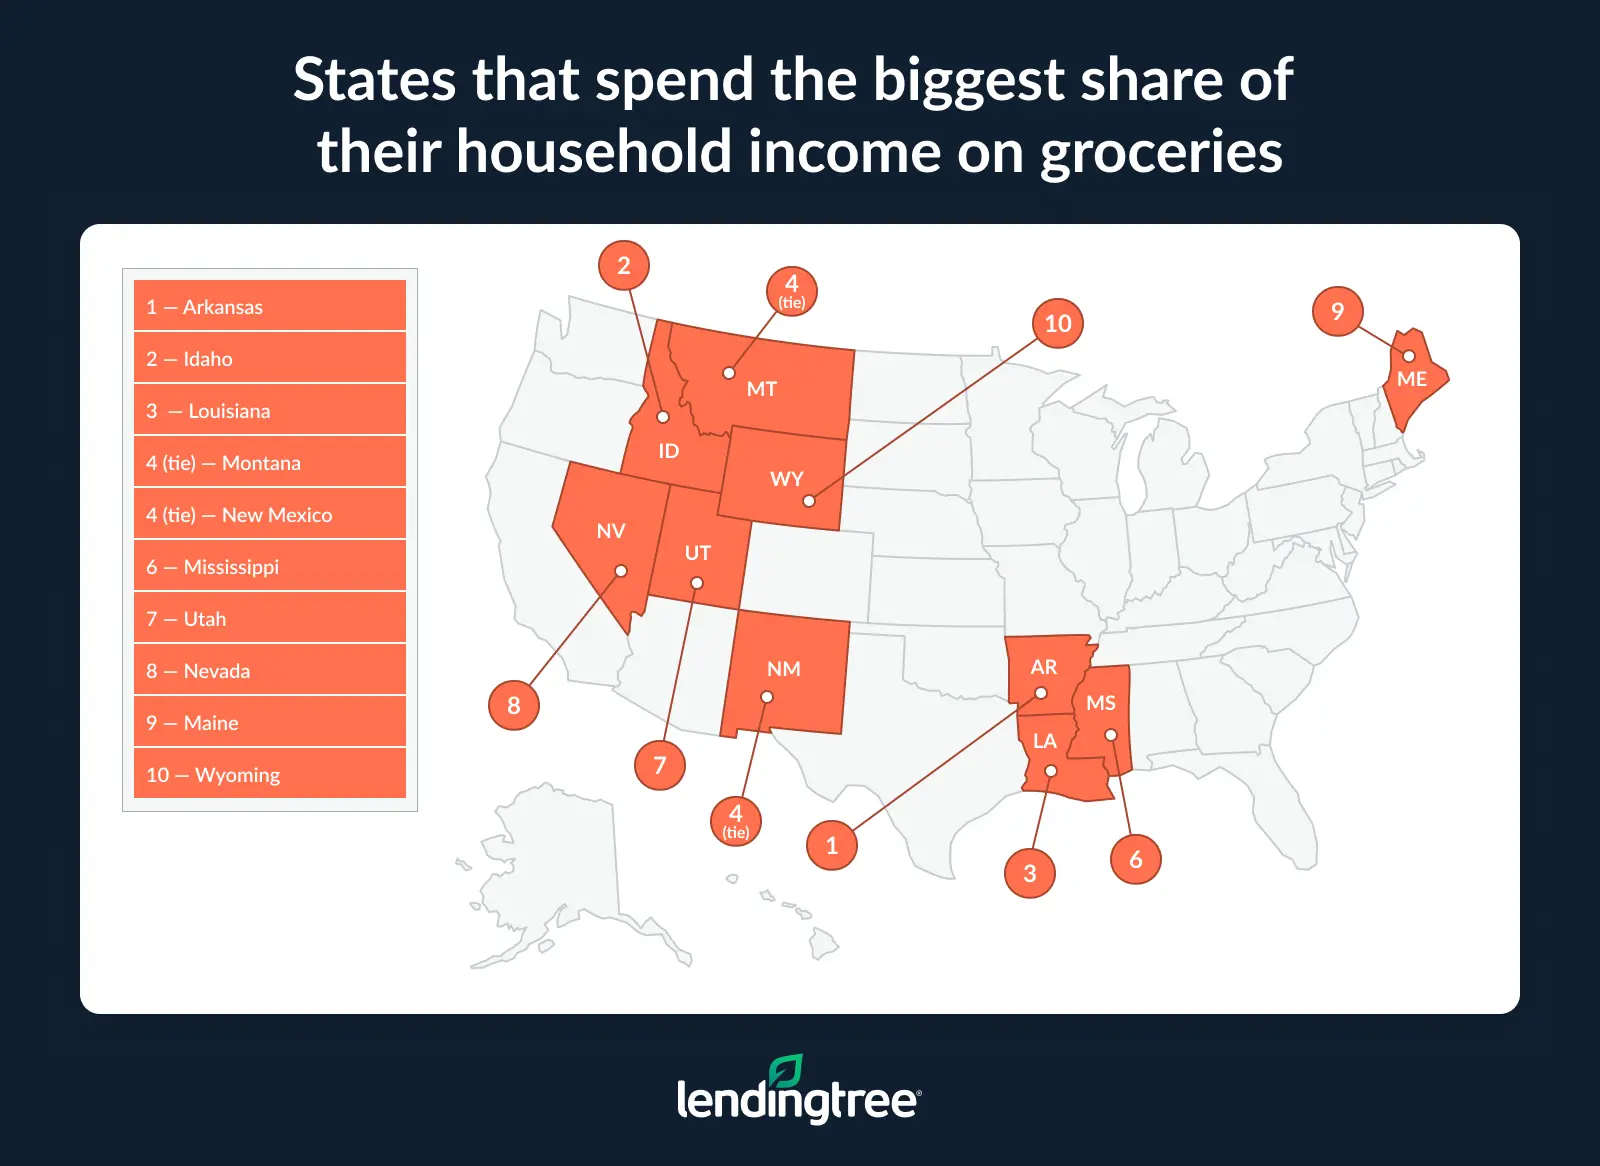
- American households spent an average of $7,995 on groceries in 2024, representing 7.0% of their household income. Arkansas households spent the highest share, at 10.0% of their income, followed by Idaho (9.9%) and Louisiana (9.6%). In contrast, District of Columbia households spent just 3.8% of their income on groceries, followed by Connecticut (4.9%) and New Jersey and Massachusetts (both 5.1%).
- Utah households had the highest grocery bills in the country in 2024, averaging $11,008 — 37.7% above the national average. Alaska — at $10,248, or 28.2% higher — and Idaho — at $10,195, or 27.5% higher — followed. Meanwhile, West Virginia households spent $5,964 (25.4% below average), the District of Columbia spent $6,208 (22.3% below) and Vermont spent $6,665 (16.6% below).
The U.S. Census Bureau American Community Survey (ACS) tracks total expenditures by category. In this study, we examined the Census Bureau’s “food at home” category, which it defines as total spending on food at grocery stores (or other food stores), as well as food prepared by consumers while traveling. It excludes purchases of nonfood items. For the purposes of this study, we referenced spending on food at home as groceries.
To track organic and conventional food costs, we compared retail prices provided by the U.S. Department of Agriculture (USDA) for the weeks ending Jan. 31, 2025, and Jan. 30, 2026, for the 52 fruit and vegetable items (including their unit sizes) that had prices available for organic and conventional versions during both weeks.
The organic price premium was calculated as the percentage difference between organic and conventional prices, relative to conventional prices.
Organic produce costs 59.0% more than conventional
Shoppers choosing organic over conventional produce are paying a steep premium — and it’s growing. Our analysis found that organic fruits and vegetables cost an average of 59.0% more than their conventional counterparts, up from a 52.6% gap when we conducted this study a year ago.
The gap between what you pay for organic versus conventional comes down to a fundamental difference in how food is grown. Most notably, organic farmers can’t rely on synthetic fertilizers, herbicides or pesticides, which means production is generally more expensive.
There’s also the cost of certification itself. Farms must operate organically for three years before achieving USDA Certified Organic status and pay ongoing annual inspection and renewal fees, according to the USDA.
The premium is especially pronounced for certain items. As of January 2026, organic Roma tomatoes cost 133.9% more than conventional, at $2.83 versus $1.21 per pound — the highest difference among the items analyzed.
Meanwhile, organic orange and yellow bell peppers each carry a 131.5% price premium. While organic orange and yellow bell peppers cost $2.50 each, conventional ones cost $1.08.
Overall, 25 of the 52 items — or nearly half — we analyzed cost at least 50.0% more when purchased organic. Meanwhile, 14 items cost at least 75% more.
Matt Schulz, LendingTree chief consumer finance analyst and author of “Ask Questions, Save Money, Make More: How to Take Control of Your Financial Life,” says those price differences are a big deal.
“They can make something that had seemed like a necessity feel more like a luxury,” he says. “When that happens, habits change. Maybe instead of buying all organic produce, someone only buys a few organic items. Perhaps organics become occasional upgrades rather than staples, or maybe they just get ignored entirely in favor of canned or frozen produce.”
Full rankings: Fruits and vegetables with biggest organic price premiums
| Rank | Name | Unit | Conventional cost | Organic cost | Premium $ | Premium % |
|---|---|---|---|---|---|---|
| 1 | Roma tomatoes | Lb | $1.21 | $2.83 | $1.62 | 133.9% |
| 2 | Orange bell peppers | Each | $1.08 | $2.50 | $1.42 | 131.5% |
| 2 | Yellow bell peppers | Each | $1.08 | $2.50 | $1.42 | 131.5% |
| 4 | Green bell peppers | Each | $0.87 | $2.00 | $1.13 | 129.9% |
| 5 | Red bell peppers | Each | $1.11 | $2.50 | $1.39 | 125.2% |
| 6 | Mixed salad | 10-12-oz package | $2.62 | $5.82 | $3.20 | 122.1% |
| 7 | Iceberg lettuce | Each | $1.60 | $3.49 | $1.89 | 118.1% |
| 8 | Long seedless cucumbers | Each | $1.16 | $2.50 | $1.34 | 115.5% |
| 9 | Sweet potatoes | Lb | $1.01 | $2.10 | $1.09 | 107.9% |
| 10 | Apple juice | 64 oz (half gallon) | $2.65 | $5.16 | $2.51 | 94.7% |
| 11 | Crown cut broccoli | Lb | $1.83 | $3.52 | $1.69 | 92.3% |
| 12 | White mushrooms | 8-oz package | $2.08 | $3.99 | $1.91 | 91.8% |
| 13 | Red seedless grapes | Lb | $2.66 | $4.99 | $2.33 | 87.6% |
| 14 | Lemons | Each | $0.54 | $0.99 | $0.45 | 83.3% |
| 15 | Round green-type beans | 12-oz bag | $2.58 | $4.41 | $1.83 | 70.9% |
| 16 | Cosmic Crisp apples | Lb | $1.75 | $2.98 | $1.23 | 70.3% |
| 17 | White seedless-type grapes | Lb | $2.97 | $4.99 | $2.02 | 68.0% |
| 18 | Gala/Royal Gala apples | Lb | $1.26 | $2.10 | $0.84 | 66.7% |
| 19 | Carrots | Lb | $0.78 | $1.29 | $0.51 | 65.4% |
| 20 | Broccoli | Bunch | $3.06 | $4.99 | $1.93 | 63.1% |
| 21 | Strawberries | 1-lb package | $3.10 | $5.00 | $1.90 | 61.3% |
| 22 | Blackberries | 5.6-6-oz package | $2.75 | $4.43 | $1.68 | 61.1% |
| 23 | Gala/Royal Gala apples | 3-lb bag | $2.51 | $3.98 | $1.47 | 58.6% |
| 24 | Tomatoes | Lb | $1.93 | $3.00 | $1.07 | 55.4% |
| 25 | Gala/Royal Gala apples | 2-lb bag | $2.69 | $4.12 | $1.43 | 53.2% |
| 26 | Blueberries | 1 pint (11-12-oz container w/ lid) | $3.76 | $5.54 | $1.78 | 47.3% |
| 27 | Spaghetti squash | Lb | $1.16 | $1.69 | $0.53 | 45.7% |
| 28 | Tangerines/mandarins | 2-lb bag | $3.78 | $5.50 | $1.72 | 45.5% |
| 29 | Hass avocados | Each | $0.90 | $1.30 | $0.40 | 44.4% |
| 30 | Baby peeled carrots | 1-lb bag | $1.39 | $1.97 | $0.58 | 41.7% |
| 31 | Fuji apples | 2-lb bag | $3.00 | $4.24 | $1.24 | 41.3% |
| 32 | Carrots | 2-lb bag | $1.90 | $2.68 | $0.78 | 41.1% |
| 33 | Bosc pears | Lb | $1.81 | $2.54 | $0.73 | 40.3% |
| 33 | Fuji apples | Lb | $1.44 | $2.02 | $0.58 | 40.3% |
| 35 | D’Anjou pears | Lb | $1.85 | $2.54 | $0.69 | 37.3% |
| 36 | Cauliflower | Each | $3.33 | $4.49 | $1.16 | 34.8% |
| 37 | Granny Smith apples | Lb | $1.56 | $2.10 | $0.54 | 34.6% |
| 38 | Bananas | Lb | $0.58 | $0.78 | $0.20 | 34.5% |
| 39 | Cucumbers | Each | $0.74 | $0.99 | $0.25 | 33.8% |
| 40 | Raspberries | 6-oz package | $3.01 | $3.99 | $0.98 | 32.6% |
| 41 | Butternut squash | Lb | $1.28 | $1.69 | $0.41 | 32.0% |
| 41 | Lemons | 2-lb bag | $3.72 | $4.91 | $1.19 | 32.0% |
| 43 | Acorn squash | Lb | $1.29 | $1.69 | $0.40 | 31.0% |
| 44 | Blueberries | 6-oz package | $3.24 | $4.12 | $0.88 | 27.2% |
| 45 | Navel oranges | 4-lb bag | $4.82 | $5.99 | $1.17 | 24.3% |
| 46 | Grape tomatoes | 1-pint package | $2.11 | $2.62 | $0.51 | 24.2% |
| 47 | Clementines | 2-lb bag | $4.29 | $4.99 | $0.70 | 16.3% |
| 48 | Mixed salad | 5-9-oz package | $3.39 | $3.77 | $0.38 | 11.2% |
| 49 | Blueberries | 18-oz package | $4.61 | $5.09 | $0.48 | 10.4% |
| 50 | Romaine hearts lettuce | 3 count | $3.57 | $3.76 | $0.19 | 5.3% |
| 51 | Honeycrisp apples | Lb | $2.07 | $2.09 | $0.02 | 1.0% |
| 52 | Navel oranges | 3-lb bag | $5.49 | $5.46 | -$0.03 | -0.5% |
Organic prices are rising; conventional prices stay nearly flat
The price gap between organic and conventional produce is already wide, and it’s getting even wider. Between January 2025 and January 2026, organic produce prices rose 10.0%, while conventional prices were virtually unchanged at just a 0.3% increase. That’s a sharp departure from a year prior, when organic and conventional prices rose at nearly the same rate — 2.4% and 2.5%, respectively.
Several factors may be at play. Production costs continue to rise, according to Organic Produce Network, with growers navigating higher labor, input and certification expenses. Farmers are also struggling with labor availability, water access and increasingly unpredictable weather.
At the same time, demand for organic has stayed strong. Total U.S. organic food sales hit $10.6 billion in 2025, according to Organic Produce Network — a roughly 5.9% increase from 2024. Meanwhile, conventional produce sales only grew 1.3% in the same period.
Looking more specifically by item type, organic Roma tomatoes saw the biggest price increase between January 2025 and January 2026. They more than doubled in price, rising by 185.9% from 99 cents per pound to $2.83.
Following that, organic green bell peppers surged 117.4%, from 92 cents each to $2.00. Organic apple juice rose 65.4%, jumping from $3.12 per half gallon to $5.16.
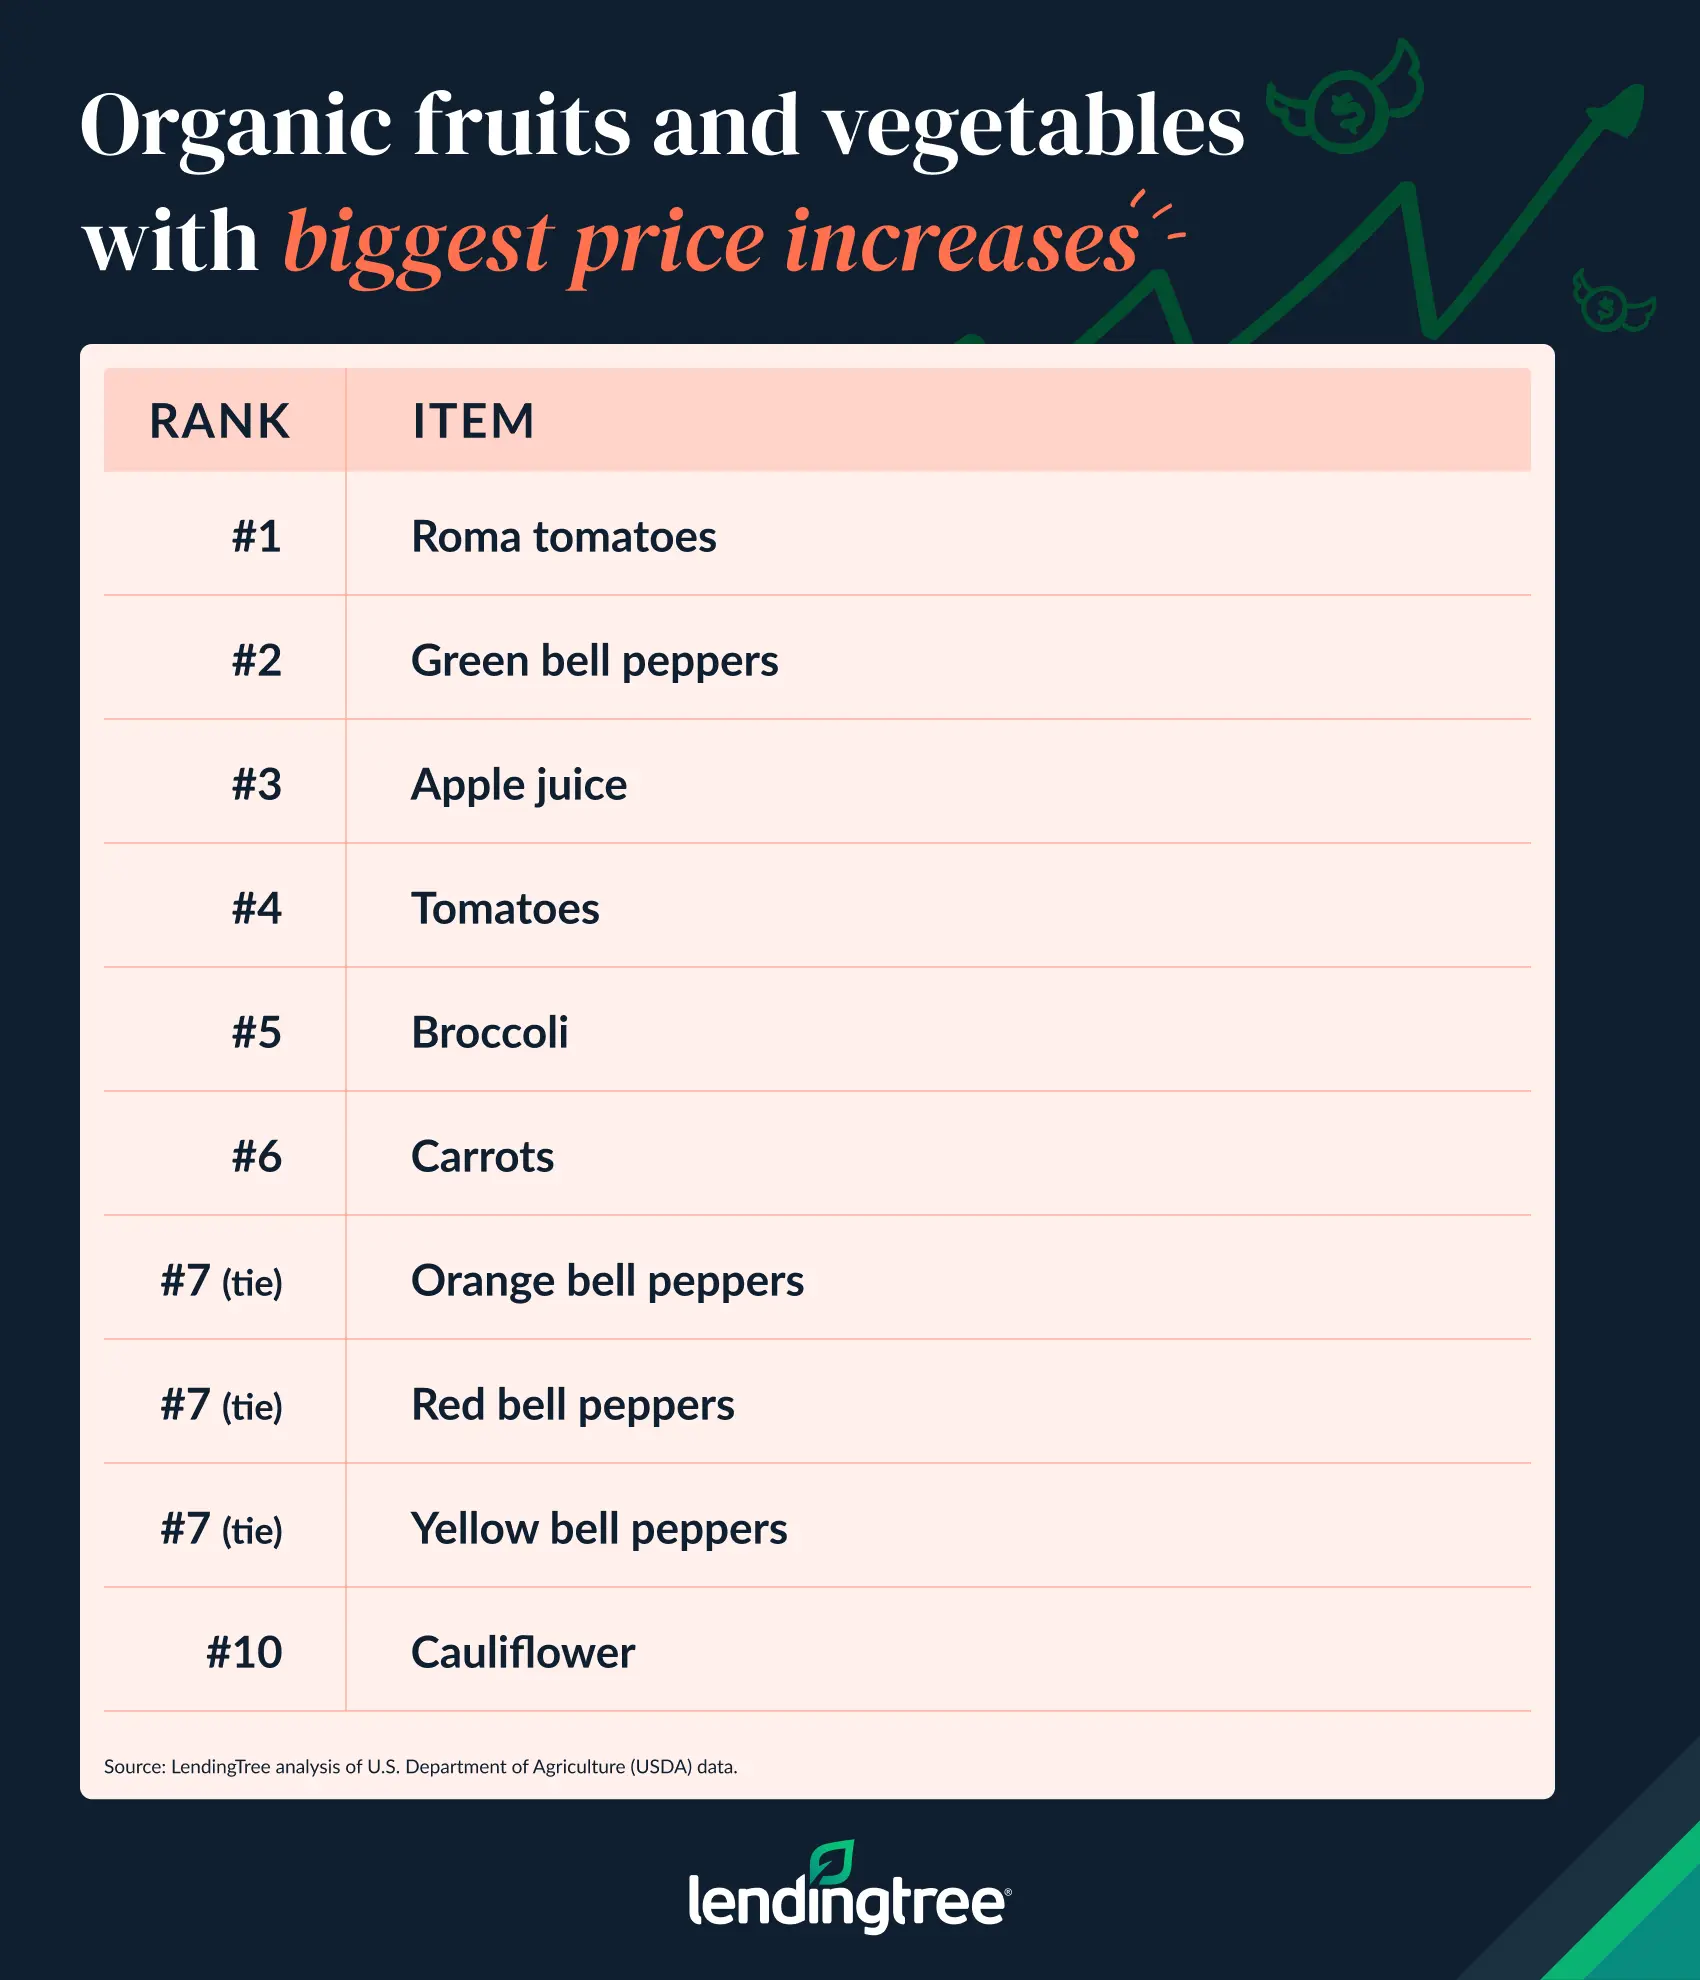
Altogether, nine of the 10 largest price increases across all items analyzed were for organic produce. By comparison, the largest conventional price increases were far more modest: Iceberg lettuce rose by 32.2% (the only conventional produce to make the combined top 10 list), butternut squash by 23.1% and acorn squash by 21.7%.
It’s not just produce costs that are going up, though — prices are rising across the board in the grocery store. According to a LendingTree study on grocery prices, it cost 5.7% more to buy a typical basket of groceries in January 2025 than it did a month earlier. Prices were also 3.3% higher than three months earlier, and 4.5% higher than a year before.
Full rankings: Largest year-over-year price increases by product and type
| Rank | Type | Product | Unit | Difference (%) |
|---|---|---|---|---|
| 1 | Organic | Roma tomatoes | Lb | 185.9% |
| 2 | Organic | Green bell peppers | Each | 117.4% |
| 3 | Organic | Apple juice | 64 oz (half gallon) | 65.4% |
| 4 | Organic | Tomatoes | Lb | 50.8% |
| 5 | Organic | Broccoli | Bunch | 50.3% |
| 6 | Organic | Carrots | 2-lb bag | 34.7% |
| 7 | Organic | Orange bell peppers | Each | 34.4% |
| 7 | Organic | Red bell peppers | Each | 34.4% |
| 7 | Organic | Yellow bell peppers | Each | 34.4% |
| 10 | Conventional | Iceberg lettuce | Each | 32.2% |
| 11 | Conventional | Butternut squash | Lb | 23.1% |
| 12 | Organic | Cauliflower | Each | 21.7% |
| 12 | Conventional | Acorn squash | Lb | 21.7% |
| 14 | Organic | Blueberries | 1 pint (11-12-oz container w/ lid) | 21.0% |
| 15 | Conventional | Fuji apples | 2-lb bag | 20.0% |
| 16 | Conventional | Blueberries | 1 pint (11-12-oz container w/ lid) | 19.7% |
| 17 | Conventional | Lemons | 2-lb bag | 19.2% |
| 18 | Organic | Blueberries | 18-oz package | 18.6% |
| 19 | Conventional | Cauliflower | Each | 17.3% |
| 20 | Conventional | Navel oranges | 3-lb bag | 17.1% |
| 21 | Conventional | Mixed salad | 5-9-oz package | 16.9% |
| 22 | Conventional | Blueberries | 6-oz package | 15.3% |
| 23 | Organic | Mixed salad | 10-12-oz package | 14.8% |
| 24 | Organic | Mixed salad | 5-9 oz package | 13.2% |
| 25 | Conventional | Fuji apples | Lb | 11.6% |
| 26 | Organic | Tangerines/Mandarins | 2-lb bag | 11.3% |
| 27 | Conventional | Blackberries | 5.6-6-oz package | 10.9% |
| 28 | Organic | Round green type beans | 12-oz bag | 10.5% |
| 29 | Conventional | D’Anjou pears | Lb | 10.1% |
| 30 | Conventional | Spaghetti squash | Lb | 9.4% |
| 31 | Conventional | Broccoli | Bunch | 8.9% |
| 32 | Organic | Gala/Royal Gala apples | Lb | 8.8% |
| 33 | Organic | Acorn squash | Lb | 8.3% |
| 33 | Organic | Butternut squash | Lb | 8.3% |
| 33 | Organic | Spaghetti squash | Lb | 8.3% |
| 36 | Conventional | Grape tomatoes | 1-pint package | 7.7% |
| 37 | Conventional | Gala/Royal Gala apples | 2-lb bag | 7.6% |
| 38 | Organic | Long seedless cucumbers | Each | 7.3% |
| 39 | Conventional | Bosc pears | Lb | 7.1% |
| 40 | Conventional | Romaine hearts lettuce | 3 count | 6.9% |
| 41 | Conventional | Cosmic Crisp apples | Lb | 6.7% |
| 42 | Conventional | Granny Smith apples | Lb | 6.1% |
| 43 | Conventional | Navel oranges | 4-lb bag | 5.9% |
| 44 | Conventional | Baby peeled carrots | 1-lb bag | 5.3% |
| 45 | Organic | Navel oranges | 3-lb bag | 4.6% |
| 46 | Organic | Baby peeled carrots | 1-lb bag | 3.7% |
| 46 | Organic | Fuji apples | 2-lb bag | 3.7% |
| 48 | Conventional | Green bell peppers | Each | 3.6% |
| 49 | Organic | Iceberg lettuce | Each | 3.3% |
| 50 | Organic | Granny Smith apples | Lb | 2.4% |
| 51 | Conventional | Apple juice | 64 oz (half gallon) | 2.3% |
| 52 | Conventional | White mushrooms | 8-oz package | 1.5% |
| 53 | Conventional | Tangerines/Mandarins | 2-lb bag | 1.3% |
| 54 | Organic | Gala/Royal Gala apples | 2-lb bag | 1.0% |
| 55 | Organic | Cosmic Crisp apples | Lb | 0.3% |
| 56 | Organic | Strawberries | 1-lb package | 0.2% |
| 57 | Organic | Red seedless grapes | Lb | 0.0% |
| 57 | Organic | White seedless type grapes | Lb | 0.0% |
| 57 | Organic | Lemons | Each | 0.0% |
| 57 | Organic | Carrots | Lb | 0.0% |
| 57 | Organic | Cucumbers | Each | 0.0% |
| 57 | Organic | White mushrooms | 8-oz package | 0.0% |
| 63 | Conventional | Round green type beans | 12-oz bag | -0.4% |
| 64 | Organic | Blueberries | 6-oz package | -0.7% |
| 65 | Organic | Grape tomatoes | 1-pint package | -0.8% |
| 65 | Organic | Lemons | 2-lb bag | -0.8% |
| 67 | Conventional | Carrots | 2-lb bag | -2.1% |
| 68 | Organic | Sweet potatoes | Lb | -2.3% |
| 69 | Conventional | Roma tomatoes | Lb | -2.4% |
| 70 | Conventional | Strawberries | 1-lb package | -3.7% |
| 71 | Conventional | Cucumbers | Each | -3.9% |
| 72 | Conventional | Raspberries | 6-oz package | -4.4% |
| 73 | Organic | Romaine hearts lettuce | 3 count | -4.6% |
| 74 | Conventional | Crown cut broccoli | Lb | -6.2% |
| 75 | Conventional | Carrots | Lb | -7.1% |
| 76 | Organic | Bosc pears | Lb | -7.6% |
| 77 | Conventional | Mixed salad | 10-12-oz package | -8.1% |
| 77 | Conventional | Clementines | 2-lb bag | -8.1% |
| 79 | Conventional | Sweet potatoes | Lb | -8.2% |
| 80 | Organic | Crown cut broccoli | Lb | -8.6% |
| 81 | Conventional | Honeycrisp apples | Lb | -9.2% |
| 82 | Conventional | Blueberries | 18-oz package | -10.0% |
| 83 | Organic | Bananas | Lb | -10.3% |
| 83 | Conventional | White seedless type grapes | Lb | -10.3% |
| 85 | Conventional | Red bell peppers | Each | -10.5% |
| 86 | Conventional | Bananas | Lb | -10.8% |
| 87 | Conventional | Gala/Royal Gala apples | 3-lb bag | -11.6% |
| 88 | Organic | D’Anjou pears | Lb | -15.1% |
| 89 | Conventional | Red seedless grapes | Lb | -16.4% |
| 90 | Conventional | Gala/Royal Gala apples | Lb | -16.6% |
| 91 | Organic | Clementines | 2-lb bag | -16.7% |
| 92 | Conventional | Lemons | Each | -16.9% |
| 93 | Organic | Blackberries | 5.6-6-oz package | -17.5% |
| 94 | Conventional | Orange bell peppers | Each | -22.3% |
| 94 | Conventional | Yellow bell peppers | Each | -22.3% |
| 96 | Conventional | Hass avocados | Each | -22.4% |
| 97 | Organic | Fuji apples | Lb | -22.9% |
| 98 | Organic | Navel oranges | 4-lb bag | -23.0% |
| 99 | Conventional | Tomatoes | Lb | -28.0% |
| 100 | Organic | Hass avocados | Each | -30.1% |
| 101 | Organic | Raspberries | 6-oz package | -32.3% |
| 102 | Organic | Honeycrisp apples | Lb | -33.2% |
| 103 | Organic | Gala/Royal Gala apples | 3-lb bag | -33.6% |
| 104 | Conventional | Long seedless cucumbers | Each | -40.5% |
Some grocery prices — especially conventional produce — are falling
Not every grocery item got more expensive over the past year. Prices fell for 25 of the 52 conventional items we analyzed — significantly more than the 17 organic items that saw decreases.
The steepest conventional decline was for long seedless cucumbers, down 40.5% from $1.95 each to $1.16. Following that, tomato prices fell 28.0% (from $2.68 per pound to $1.93), and Hass avocado prices fell 22.4% (from $1.16 each to 90 cents).
On the organic side, the steepest decline was for Gala/Royal Gala apples, down 33.6% from $5.99 per 3-pound bag to $3.98. Following that, Honeycrisp apple prices fell 33.2% (from $3.13 per pound to $2.09), and raspberry prices fell 32.3% (from $5.89 per 6-ounce package to $3.99).
Full rankings: Organic fruits and vegetables with biggest price increases/decreases
| Rank | Item | Unit | 2025 price | 2026 price | $ change | % difference |
|---|---|---|---|---|---|---|
| 1 | Roma tomatoes | Lb | $0.99 | $2.83 | $1.84 | 185.9% |
| 2 | Green bell peppers | Each | $0.92 | $2.00 | $1.08 | 117.4% |
| 3 | Apple juice | 64 oz (half gallon) | $3.12 | $5.16 | $2.04 | 65.4% |
| 4 | Tomatoes | Lb | $1.99 | $3.00 | $1.01 | 50.8% |
| 5 | Broccoli | Bunch | $3.32 | $4.99 | $1.67 | 50.3% |
| 6 | Carrots | 2-lb bag | $1.99 | $2.68 | $0.69 | 34.7% |
| 7 | Orange bell peppers | Each | $1.86 | $2.50 | $0.64 | 34.4% |
| 7 | Red bell peppers | Each | $1.86 | $2.50 | $0.64 | 34.4% |
| 7 | Yellow bell peppers | Each | $1.86 | $2.50 | $0.64 | 34.4% |
| 10 | Cauliflower | Each | $3.69 | $4.49 | $0.80 | 21.7% |
| 11 | Blueberries | 1 pint (11-12-oz container w/ lid) | $4.58 | $5.54 | $0.96 | 21.0% |
| 12 | Blueberries | 18-oz package | $4.29 | $5.09 | $0.80 | 18.6% |
| 13 | Mixed salad | 10-12-oz package | $5.07 | $5.82 | $0.75 | 14.8% |
| 14 | Mixed salad | 5-9-oz package | $3.33 | $3.77 | $0.44 | 13.2% |
| 15 | Tangerines/mandarins | 2-lb bag | $4.94 | $5.50 | $0.56 | 11.3% |
| 16 | Round green-type beans | 12-oz bag | $3.99 | $4.41 | $0.42 | 10.5% |
| 17 | Gala/Royal Gala apples | Lb | $1.93 | $2.10 | $0.17 | 8.8% |
| 18 | Acorn squash | Lb | $1.56 | $1.69 | $0.13 | 8.3% |
| 18 | Butternut squash | Lb | $1.56 | $1.69 | $0.13 | 8.3% |
| 18 | Spaghetti squash | Lb | $1.56 | $1.69 | $0.13 | 8.3% |
| 21 | Long seedless cucumbers | Each | $2.33 | $2.50 | $0.17 | 7.3% |
| 22 | Navel oranges | 3-lb bag | $5.22 | $5.46 | $0.24 | 4.6% |
| 23 | Baby peeled carrots | 1-lb bag | $1.90 | $1.97 | $0.07 | 3.7% |
| 23 | Fuji apples | 2-lb bag | $4.09 | $4.24 | $0.15 | 3.7% |
| 25 | Iceberg lettuce | Each | $3.38 | $3.49 | $0.11 | 3.3% |
| 26 | Granny Smith apples | Lb | $2.05 | $2.10 | $0.05 | 2.4% |
| 27 | Gala/Royal Gala apples | 2-lb bag | $4.08 | $4.12 | $0.04 | 1.0% |
| 28 | Cosmic Crisp apples | Lb | $2.97 | $2.98 | $0.01 | 0.3% |
| 29 | Strawberries | 1-lb package | $4.99 | $5.00 | $0.01 | 0.2% |
| 30 | Red seedless grapes | Lb | $4.99 | $4.99 | $0.00 | 0.0% |
| 30 | White seedless-type grapes | Lb | $4.99 | $4.99 | $0.00 | 0.0% |
| 30 | Lemons | Each | $0.99 | $0.99 | $0.00 | 0.0% |
| 30 | Carrots | Lb | $1.29 | $1.29 | $0.00 | 0.0% |
| 30 | Cucumbers | Each | $0.99 | $0.99 | $0.00 | 0.0% |
| 30 | White mushrooms | 8-oz package | $3.99 | $3.99 | $0.00 | 0.0% |
| 36 | Blueberries | 6-oz package | $4.15 | $4.12 | -$0.03 | -0.7% |
| 37 | Grape tomatoes | 1-pint package | $2.64 | $2.62 | -$0.02 | -0.8% |
| 37 | Lemons | 2-lb bag | $4.95 | $4.91 | -$0.04 | -0.8% |
| 39 | Sweet potatoes | Lb | $2.15 | $2.10 | -$0.05 | -2.3% |
| 40 | Romaine hearts lettuce | 3 count | $3.94 | $3.76 | -$0.18 | -4.6% |
| 41 | Bosc pears | Lb | $2.75 | $2.54 | -$0.21 | -7.6% |
| 42 | Crown cut broccoli | Lb | $3.85 | $3.52 | -$0.33 | -8.6% |
| 43 | Bananas | Lb | $0.87 | $0.78 | -$0.09 | -10.3% |
| 44 | D’Anjou pears | Lb | $2.99 | $2.54 | -$0.45 | -15.1% |
| 45 | Clementines | 2-lb bag | $5.99 | $4.99 | -$1.00 | -16.7% |
| 46 | Blackberries | 5.6-6-oz package | $5.37 | $4.43 | -$0.94 | -17.5% |
| 47 | Fuji apples | Lb | $2.62 | $2.02 | -$0.60 | -22.9% |
| 48 | Navel oranges | 4-lb bag | $7.78 | $5.99 | -$1.79 | -23.0% |
| 49 | Hass avocados | Each | $1.86 | $1.30 | -$0.56 | -30.1% |
| 50 | Raspberries | 6-oz package | $5.89 | $3.99 | -$1.90 | -32.3% |
| 51 | Honeycrisp apples | Lb | $3.13 | $2.09 | -$1.04 | -33.2% |
| 52 | Gala/Royal Gala apples | 3-lb bag | $5.99 | $3.98 | -$2.01 | -33.6% |
Full rankings: Conventional fruits and vegetables with biggest price increases/decreases
| Rank | Item | Unit | 2025 price | 2026 price | $ change | % difference |
|---|---|---|---|---|---|---|
| 1 | Iceberg lettuce | Each | $1.21 | $1.60 | $0.39 | 32.2% |
| 2 | Butternut squash | Lb | $1.04 | $1.28 | $0.24 | 23.1% |
| 3 | Acorn squash | Lb | $1.06 | $1.29 | $0.23 | 21.7% |
| 4 | Fuji apples | 2-lb bag | $2.50 | $3.00 | $0.50 | 20.0% |
| 5 | Blueberries | 1 pint (11-12-oz container w/ lid) | $3.14 | $3.76 | $0.62 | 19.7% |
| 6 | Lemons | 2-lb bag | $3.12 | $3.72 | $0.60 | 19.2% |
| 7 | Cauliflower | Each | $2.84 | $3.33 | $0.49 | 17.3% |
| 8 | Navel oranges | 3-lb bag | $4.69 | $5.49 | $0.80 | 17.1% |
| 9 | Mixed salad | 5-9-oz package | $2.90 | $3.39 | $0.49 | 16.9% |
| 10 | Blueberries | 6-oz package | $2.81 | $3.24 | $0.43 | 15.3% |
| 11 | Fuji apples | Lb | $1.29 | $1.44 | $0.15 | 11.6% |
| 12 | Blackberries | 5.6-6-oz package | $2.48 | $2.75 | $0.27 | 10.9% |
| 13 | D’Anjou pears | Lb | $1.68 | $1.85 | $0.17 | 10.1% |
| 14 | Spaghetti squash | Lb | $1.06 | $1.16 | $0.10 | 9.4% |
| 15 | Broccoli | Bunch | $2.81 | $3.06 | $0.25 | 8.9% |
| 16 | Grape tomatoes | 1-pint package | $1.96 | $2.11 | $0.15 | 7.7% |
| 17 | Gala/Royal Gala apples | 2-lb bag | $2.50 | $2.69 | $0.19 | 7.6% |
| 18 | Bosc pears | Lb | $1.69 | $1.81 | $0.12 | 7.1% |
| 19 | Romaine hearts lettuce | 3 count | $3.34 | $3.57 | $0.23 | 6.9% |
| 20 | Cosmic Crisp apples | Lb | $1.64 | $1.75 | $0.11 | 6.7% |
| 21 | Granny Smith apples | Lb | $1.47 | $1.56 | $0.09 | 6.1% |
| 22 | Navel oranges | 4-lb bag | $4.55 | $4.82 | $0.27 | 5.9% |
| 23 | Baby peeled carrots | 1-lb bag | $1.32 | $1.39 | $0.07 | 5.3% |
| 24 | Green bell peppers | Each | $0.84 | $0.87 | $0.03 | 3.6% |
| 25 | Apple juice | 64 oz (half gallon) | $2.59 | $2.65 | $0.06 | 2.3% |
| 26 | White mushrooms | 8-oz package | $2.05 | $2.08 | $0.03 | 1.5% |
| 27 | Tangerines/mandarins | 2-lb bag | $3.73 | $3.78 | $0.05 | 1.3% |
| 28 | Round green-type beans | 12-oz bag | $2.59 | $2.58 | -$0.01 | -0.4% |
| 29 | Carrots | 2-lb bag | $1.94 | $1.90 | -$0.04 | -2.1% |
| 30 | Roma tomatoes | Lb | $1.24 | $1.21 | -$0.03 | -2.4% |
| 31 | Strawberries | 1-lb package | $3.22 | $3.10 | -$0.12 | -3.7% |
| 32 | Cucumbers | Each | $0.77 | $0.74 | -$0.03 | -3.9% |
| 33 | Raspberries | 6-oz package | $3.15 | $3.01 | -$0.14 | -4.4% |
| 34 | Crown cut broccoli | Lb | $1.95 | $1.83 | -$0.12 | -6.2% |
| 35 | Carrots | Lb | $0.84 | $0.78 | -$0.06 | -7.1% |
| 36 | Mixed salad | 10-12-oz package | $2.85 | $2.62 | -$0.23 | -8.1% |
| 36 | Clementines | 2-lb bag | $4.67 | $4.29 | -$0.38 | -8.1% |
| 38 | Sweet potatoes | Lb | $1.10 | $1.01 | -$0.09 | -8.2% |
| 39 | Honeycrisp apples | Lb | $2.28 | $2.07 | -$0.21 | -9.2% |
| 40 | Blueberries | 18-oz package | $5.12 | $4.61 | -$0.51 | -10.0% |
| 41 | White seedless-type grapes | Lb | $3.31 | $2.97 | -$0.34 | -10.3% |
| 42 | Red bell peppers | Each | $1.24 | $1.11 | -$0.13 | -10.5% |
| 43 | Bananas | Lb | $0.65 | $0.58 | -$0.07 | -10.8% |
| 44 | Gala/Royal Gala apples | 3-lb bag | $2.84 | $2.51 | -$0.33 | -11.6% |
| 45 | Red seedless grapes | Lb | $3.18 | $2.66 | -$0.52 | -16.4% |
| 46 | Gala/Royal Gala apples | Lb | $1.51 | $1.26 | -$0.25 | -16.6% |
| 47 | Lemons | Each | $0.65 | $0.54 | -$0.11 | -16.9% |
| 48 | Orange bell peppers | Each | $1.39 | $1.08 | -$0.31 | -22.3% |
| 48 | Yellow bell peppers | Each | $1.39 | $1.08 | -$0.31 | -22.3% |
| 50 | Hass avocados | Each | $1.16 | $0.90 | -$0.26 | -22.4% |
| 51 | Tomatoes | Lb | $2.68 | $1.93 | -$0.75 | -28.0% |
| 52 | Long seedless cucumbers | Each | $1.95 | $1.16 | -$0.79 | -40.5% |
Grocery bills take a bigger bite out of income in some states
American households spent an average of $7,995 on groceries in 2024. That’s equivalent to 7.0% of the average household income of $113,530.
The states where grocery spending consumes the largest share of income are Arkansas (10.0%), Idaho (9.9%) and Louisiana (9.6%). Income plays a role here: Arkansas and Louisiana both have lower average household incomes, at $84,759 and $87,038, respectively.
Unlike the other most cost-burdened states, Idaho’s average household income is significantly higher at $102,747, but its annual grocery spending is the third-highest by state at $10,195. Worth noting, Idaho is also one of just 11 states that levy a sales tax on groceries. The sales tax rate here is 6.0%, which is higher than that of most states with a sales tax on groceries.
Schulz says that disproportionate grocery spending can come at a huge disadvantage for households in these states.
“It’s a big deal because that money that’s being spent on groceries is money that can’t be put toward short-term financial goals, such as emergency funds and paying down high-interest debt,” he says. “It certainly can’t go toward longer-term goals, such as investing for retirement or saving for mortgage down payments or college. It means that your financial margin for error is really tiny, and that’s a scary place to be.”
At the other end of the spectrum, District of Columbia households spent just 3.8% of their income on groceries, followed by Connecticut (4.9%) and New Jersey and Massachusetts (both 5.1%).
The common thread here is earning power. The District of Columbia ($162,297), Massachusetts ($144,950) and New Jersey ($143,363) are the three states with the highest average household incomes, while Connecticut ($138,744) ranks fifth.
Full rankings: States that spend the biggest share of their household income on groceries
| Rank | State | Avg. household grocery spending | Avg. household income | % of income spent |
|---|---|---|---|---|
| 1 | Arkansas | $8,477 | $84,759 | 10.0% |
| 2 | Idaho | $10,195 | $102,747 | 9.9% |
| 3 | Louisiana | $8,315 | $87,038 | 9.6% |
| 4 | Montana | $9,300 | $98,908 | 9.4% |
| 4 | New Mexico | $8,317 | $88,155 | 9.4% |
| 6 | Mississippi | $7,373 | $78,922 | 9.3% |
| 7 | Utah | $11,008 | $121,376 | 9.1% |
| 8 | Nevada | $9,560 | $106,475 | 9.0% |
| 9 | Maine | $8,814 | $100,102 | 8.8% |
| 10 | Wyoming | $8,800 | $100,641 | 8.7% |
| 11 | Alaska | $10,248 | $118,985 | 8.6% |
| 12 | Oklahoma | $7,560 | $88,936 | 8.5% |
| 13 | Georgia | $8,960 | $106,944 | 8.4% |
| 13 | Kentucky | $7,391 | $87,807 | 8.4% |
| 15 | Arizona | $8,986 | $108,273 | 8.3% |
| 16 | Alabama | $7,333 | $88,898 | 8.2% |
| 16 | Florida | $8,710 | $105,967 | 8.2% |
| 16 | Tennessee | $7,965 | $96,820 | 8.2% |
| 16 | Texas | $9,028 | $109,933 | 8.2% |
| 20 | Oregon | $9,089 | $111,542 | 8.1% |
| 20 | South Carolina | $7,707 | $95,567 | 8.1% |
| 22 | South Dakota | $7,736 | $98,527 | 7.9% |
| 23 | Nebraska | $8,002 | $102,399 | 7.8% |
| 24 | Indiana | $7,357 | $95,247 | 7.7% |
| 24 | Iowa | $7,549 | $98,187 | 7.7% |
| 26 | Michigan | $7,305 | $98,700 | 7.4% |
| 26 | Missouri | $7,113 | $96,247 | 7.4% |
| 26 | Ohio | $7,132 | $96,990 | 7.4% |
| 29 | West Virginia | $5,964 | $81,190 | 7.3% |
| 30 | Wisconsin | $7,262 | $101,466 | 7.2% |
| 31 | Hawaii | $9,335 | $131,053 | 7.1% |
| 32 | Kansas | $6,935 | $100,417 | 6.9% |
| 32 | North Carolina | $7,030 | $101,208 | 6.9% |
| 34 | Delaware | $7,638 | $112,616 | 6.8% |
| 34 | New Hampshire | $8,754 | $128,322 | 6.8% |
| 34 | North Dakota | $6,933 | $101,793 | 6.8% |
| 34 | Pennsylvania | $7,329 | $107,538 | 6.8% |
| 38 | Washington | $8,855 | $134,588 | 6.6% |
| 39 | California | $9,141 | $140,436 | 6.5% |
| 40 | Colorado | $8,239 | $128,255 | 6.4% |
| 41 | Vermont | $6,665 | $107,852 | 6.2% |
| 42 | Virginia | $7,827 | $128,260 | 6.1% |
| 43 | Illinois | $6,768 | $115,638 | 5.9% |
| 43 | Rhode Island | $6,842 | $115,075 | 5.9% |
| 45 | Minnesota | $6,851 | $118,304 | 5.8% |
| 46 | Maryland | $7,453 | $136,642 | 5.5% |
| 47 | New York | $6,716 | $128,247 | 5.2% |
| 48 | Massachusetts | $7,456 | $144,950 | 5.1% |
| 48 | New Jersey | $7,343 | $143,363 | 5.1% |
| 50 | Connecticut | $6,827 | $138,744 | 4.9% |
| 51 | District of Columbia | $6,208 | $162,297 | 3.8% |
Utah and Alaska households have the highest grocery bills
Utah households spent an average of $11,008 on groceries in 2024 — 37.7% above the national average of $7,995. Alaska ($10,248, or 28.2% above average) and Idaho ($10,195, or 27.5% above average) round out the top three for the highest grocery bills nationwide.
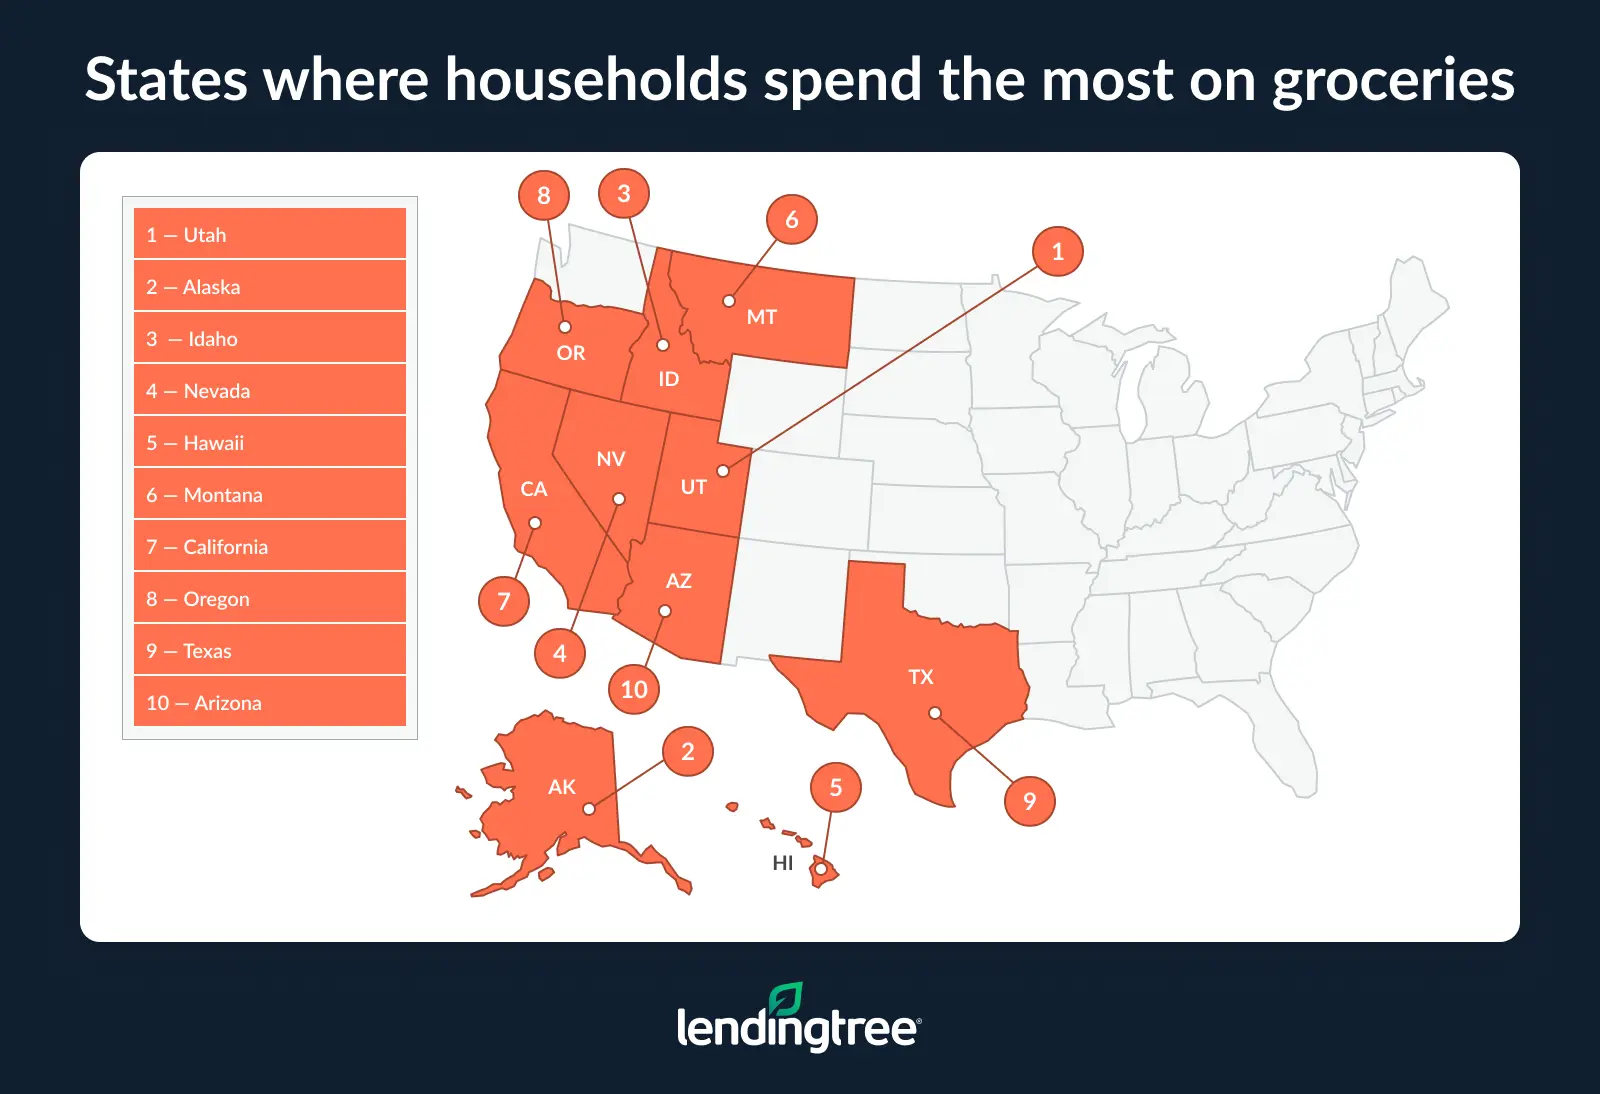
In Utah, household size is likely a factor. Utah has the largest average household sizes in the country. Meanwhile, the vast majority of Alaska’s food supply has to be imported from the contiguous U.S., contributing to higher prices statewide.
At the other end of the spectrum, West Virginia households spent just $5,964 (25.4% below the national average). That’s followed by the District of Columbia at $6,208 (22.3% below), and Vermont at $6,665 (16.6% below).
Full rankings: States where households spend the most/least on groceries
| Rank | State | Avg. household grocery spending | % difference from national avg. |
|---|---|---|---|
| 1 | Utah | $11,008 | 37.7% |
| 2 | Alaska | $10,248 | 28.2% |
| 3 | Idaho | $10,195 | 27.5% |
| 4 | Nevada | $9,560 | 19.6% |
| 5 | Hawaii | $9,335 | 16.8% |
| 6 | Montana | $9,300 | 16.3% |
| 7 | California | $9,141 | 14.3% |
| 8 | Oregon | $9,089 | 13.7% |
| 9 | Texas | $9,028 | 12.9% |
| 10 | Arizona | $8,986 | 12.4% |
| 11 | Georgia | $8,960 | 12.1% |
| 12 | Washington | $8,855 | 10.8% |
| 13 | Maine | $8,814 | 10.2% |
| 14 | Wyoming | $8,800 | 10.1% |
| 15 | New Hampshire | $8,754 | 9.5% |
| 16 | Florida | $8,710 | 8.9% |
| 17 | Arkansas | $8,477 | 6.0% |
| 18 | Louisiana | $8,315 | 4.0% |
| 18 | New Mexico | $8,317 | 4.0% |
| 20 | Colorado | $8,239 | 3.1% |
| 21 | Nebraska | $8,002 | 0.1% |
| 22 | Tennessee | $7,965 | -0.4% |
| 23 | Virginia | $7,827 | -2.1% |
| 24 | South Dakota | $7,736 | -3.2% |
| 25 | South Carolina | $7,707 | -3.6% |
| 26 | Delaware | $7,638 | -4.5% |
| 27 | Oklahoma | $7,560 | -5.4% |
| 28 | Iowa | $7,549 | -5.6% |
| 29 | Massachusetts | $7,456 | -6.7% |
| 30 | Maryland | $7,453 | -6.8% |
| 31 | Kentucky | $7,391 | -7.5% |
| 32 | Mississippi | $7,373 | -7.8% |
| 33 | Indiana | $7,357 | -8.0% |
| 34 | New Jersey | $7,343 | -8.1% |
| 35 | Alabama | $7,333 | -8.3% |
| 35 | Pennsylvania | $7,329 | -8.3% |
| 37 | Michigan | $7,305 | -8.6% |
| 38 | Wisconsin | $7,262 | -9.2% |
| 39 | Ohio | $7,132 | -10.8% |
| 40 | Missouri | $7,113 | -11.0% |
| 41 | North Carolina | $7,030 | -12.1% |
| 42 | Kansas | $6,935 | -13.3% |
| 42 | North Dakota | $6,933 | -13.3% |
| 44 | Minnesota | $6,851 | -14.3% |
| 45 | Rhode Island | $6,842 | -14.4% |
| 46 | Connecticut | $6,827 | -14.6% |
| 47 | Illinois | $6,768 | -15.3% |
| 48 | New York | $6,716 | -16.0% |
| 49 | Vermont | $6,665 | -16.6% |
| 50 | District of Columbia | $6,208 | -22.3% |
| 51 | West Virginia | $5,964 | -25.4% |
Getting the most bang for your buck at the grocery store: 5 expert tips
With grocery prices still straining household budgets, shoppers are getting more strategic about how — and what — they buy. According to a LendingTree survey on grocery habits, nearly 9 in 10 Americans have changed their grocery habits to save money. The good news: Small tweaks can add up to meaningful savings. Here’s what we recommend:
- Buy in bulk — strategically. Purchasing larger quantities can cut costs by 27% on average, according to a LendingTree study on bulk buying, especially for staples like paper goods and pantry items. Just be mindful of shelf life, as bulk savings disappear if items go to waste.
- Stick to store brands. Generic and store-brand products often offer similar quality to name brands at a lower price. Swapping even a handful of items can lead to noticeable savings over time.
- Plan ahead and stick to a list. Mapping out meals before you shop (and committing to a list) helps curb impulse buys and ensures you’re only purchasing what you’ll use.
- Compare prices as you go. Paying attention to unit prices, trying different stores and shopping sales cycles can help you find the best value without sacrificing quality.
- Reduce food waste. Make a habit of using what you already have before buying more. Storing food properly, freezing extras and planning leftovers can stretch your grocery dollars further.
Methodology
LendingTree researchers compared retail prices provided by the U.S. Department of Agriculture (USDA) for the weeks ending Jan. 31, 2025, and Jan. 30, 2026, for the 52 fruit and vegetable items (including their unit sizes) that had prices available for organic and conventional versions during both weeks.
The organic price premium was calculated as the percentage difference between organic and conventional prices, relative to conventional prices.
Household spending was derived by dividing average household spending on food at home by the total number of households from the U.S. Census Bureau 2024 American Community Survey (ACS) with five-year estimates. This result was then divided by the average household income in each state, also from the U.S. Census Bureau 2024 ACS with five-year estimates.
For the purposes of this study, we referenced spending on food at home as groceries.
Get debt consolidation loan offers from up to 5 lenders in minutes