Tornado- and Hail-Involved Damage Highest in Spring Months
April showers bring May flowers, but not everyone is so lucky with spring storms.
The latest LendingTree study shows that estimated damage for tornado- and hail-involved billion-dollar disasters between 2014 and 2023 was highest in the spring, reaching $79.4 billion in April.
We’ll highlight our findings and offer tips on utilizing home insurance to prepare for potential spring storms.
Key findings
- From 2010-12 to 2020-22, the number of tornadoes decreased by 10.4% nationally. 32 states experienced at least 10 tornadoes in both three-year periods. Of these states, 12 saw an increase in the number of tornadoes, with Georgia (115.7%), South Carolina (109.4%) and Iowa (89.1%) having the biggest spikes. The remaining states saw a decrease, with North Dakota (58.9%), Indiana (57.1%) and Kansas (56.7%) experiencing the biggest drops.
- Tornado-involved billion-dollar disasters caused an estimated $43.6 billion in damage in the U.S. in 2023 — the highest in the decade analyzed. Damage from these billion-dollar disasters was also significant in 2020 ($41.9 billion) and 2021 ($19.1 billion).
- From 2010-12 to 2020-22, the number of hail events decreased by 49.4% nationally. Of the 46 states with at least 10 hail events in both three-year periods, only three experienced an increase: California (31.9%), Arizona (26.7%) and Utah (13.2%). On the other hand, Vermont (92.7%) saw the biggest decrease in the number of hail events, followed by Connecticut (80.5%) and Ohio and Indiana (both at 76.0%).
- Over the decade analyzed, hail-involved billion-dollar disasters also caused the highest amount of estimated damage in 2023. Hail-involved billion-dollar disasters caused an estimated $39.4 billion in damage in 2023 — more than double the $19.6 billion in damage in 2020 (the second-highest). Notably, 16 hail-related billion-dollar events occurred in 2023, the only year in the double digits.
- Estimated damage for tornado- and hail-involved billion-dollar disasters was highest in the spring. Between 2014 and 2023, damage from billion-dollar disasters involving tornadoes or hail reached an estimated $79.4 billion in April — the highest of any month. Fellow spring months May ($67.6 billion), June ($63.3 billion) and March ($51.9 billion) followed.
Tornadoes have decreased 10.4% nationally
Nationally, the number of tornadoes decreased by 10.4% between 2010-12 (4,059) and 2020-22 (3,635), according to a LendingTree analysis of National Oceanic and Atmospheric Administration (NOAA) Storm Prediction Center data.
While that may feel counterintuitive amid climate change discussions, that decline is largely due to climate change itself. According to NOAA, the intensity of the strongest storms is expected to increase due to climate change. However, substantially fewer hurricanes and tropical storms — which can produce tornadoes — are expected in the future.
Our analysis shows 32 states experienced at least 10 tornadoes in both three-year periods analyzed. Of these states, 12 saw an increase in the number of tornadoes between the periods. Georgia saw the biggest spike (115.7%), from 70 tornadoes in 2010-12 to 151 in 2020-22. That’s followed by South Carolina (109.4%) and Iowa (89.1%).
States with the biggest % increase in tornadoes, 2010-12 to 2020-22
| Rank | State | Tornadoes, 2010-12 | Tornadoes, 2020-22 | % change |
|---|---|---|---|---|
| 1 | Georgia | 70 | 151 | 115.7% |
| 2 | South Carolina | 53 | 111 | 109.4% |
| 3 | Iowa | 101 | 191 | 89.1% |
One potential reason for these increases? While Iowa is considered part of Tornado Alley (an area known for its tornado activity), the lesser-known Dixie Alley includes parts of Georgia and South Carolina. Tornado activity has shifted toward the Southeast over the years, according to a 2018 study published in the journal npj Climate and Atmospheric Science.
Meanwhile, the remaining 20 states with at least 10 tornadoes in both periods saw decreased activity. Of these, North Dakota saw the biggest decline, with the number of tornadoes falling 58.9% from 129 in 2010-12 to 53 in 2020-22. Indiana (57.1%) and Kansas (56.7%) followed.
According to preliminary data, there were 1,423 tornadoes in 2023. Illinois (136), Alabama (101) and Texas and Colorado (both 89) experienced the most tornadoes, while West Virginia was the only state that didn’t experience any tornadoes. (Data from Alaska, the District of Columbia and Hawaii wasn’t available.)
Full rankings: % change in tornadoes by state, 2010-12 to 2020-22
| Rank | State | Tornadoes, 2010-12 | Tornadoes, 2020-22 | % change |
|---|---|---|---|---|
| 1 | Georgia | 70 | 151 | 115.7% |
| 2 | South Carolina | 53 | 111 | 109.4% |
| 3 | Iowa | 101 | 191 | 89.1% |
| 4 | Mississippi | 190 | 286 | 50.5% |
| 5 | Florida | 111 | 160 | 44.1% |
| 6 | South Dakota | 68 | 82 | 20.6% |
| 7 | New Mexico | 20 | 24 | 20.0% |
| 8 | Illinois | 151 | 175 | 15.9% |
| 9 | Minnesota | 182 | 196 | 7.7% |
| 10 | Louisiana | 136 | 145 | 6.6% |
| 11 | Arizona | 16 | 17 | 6.3% |
| 12 | Pennsylvania | 59 | 60 | 1.7% |
| 13 | Wisconsin | 94 | 90 | -4.3% |
| 14 | Alabama | 253 | 240 | -5.1% |
| 15 | Colorado | 125 | 114 | -8.8% |
| 16 | Arkansas | 135 | 123 | -8.9% |
| 17 | Texas | 339 | 301 | -11.2% |
| 18 | Ohio | 93 | 79 | -15.1% |
| 19 | New York | 42 | 31 | -26.2% |
| 20 | North Carolina | 115 | 84 | -27.0% |
| 21 | Maryland | 47 | 34 | -27.7% |
| 22 | Kentucky | 127 | 91 | -28.3% |
| 23 | Nebraska | 135 | 93 | -31.1% |
| 24 | Tennessee | 166 | 111 | -33.1% |
| 25 | Virginia | 68 | 43 | -36.8% |
| 26 | Oklahoma | 289 | 163 | -43.6% |
| 27 | Michigan | 48 | 25 | -47.9% |
| 28 | Missouri | 170 | 83 | -51.2% |
| 29 | California | 35 | 16 | -54.3% |
| 30 | Kansas | 254 | 110 | -56.7% |
| 31 | Indiana | 119 | 51 | -57.1% |
| 32 | North Dakota | 129 | 53 | -58.9% |
Damage from tornado-involved billion-dollar disasters spiked in 2023
While the number of tornadoes has fallen, tornado-involved billion-dollar disasters haven’t over the past decade — and they’re certainly costly. According to an analysis of NOAA National Centers for Environmental Information (NCEI) data, these disasters caused an estimated $43.6 billion in damage nationally in 2023 — the highest in the decade analyzed.
2023 also had the most tornado-involved billion-dollar disasters in the past decade, with 13 recorded — one of just two years in which the number of billion-dollar disasters reached double digits.
Specifically, a tornado outbreak that started on March 31, 2023, produced over 145 tornadoes across many southern and central states, causing $5.7 billion in estimated damage alone.
Total estimated damage from billion-dollar disasters involving tornadoes, 2014 to 2023
| Year | Billion-dollar disasters involving tornadoes | Total estimated damage |
|---|---|---|
| 2014 | 2 | $3.4 billion |
| 2015 | 3 | $5.4 billion |
| 2016 | 5 | $9.4 billion |
| 2017 | 9 | $17.0 billion |
| 2018 | 6 | $9.7 billion |
| 2019 | 6 | $14.2 billion |
| 2020 | 11 | $41.9 billion |
| 2021 | 9 | $19.1 billion |
| 2022 | 6 | $11.9 billion |
| 2023 | 13 | $43.6 billion |
Notably, damage first spiked in 2020, at an estimated $41.9 billion across 11 tornado-involved billion-dollar disasters. Meanwhile, 2021 saw $19.1 billion in damage across nine disasters.
A low number of disasters doesn’t necessarily mean less damage, though. For example, both 2018 and 2019 had six tornado-involved billion-dollar disasters. While the disasters caused an estimated $9.7 billion in damage in 2018, that figure rose to $14.2 billion in 2019.
Across the years analyzed, the most deaths from tornado-involved billion-dollar disasters occurred in 2021 (120). A December 2021 outbreak across southern and central states — with a peak tornado track of nearly 166 miles — was responsible for 93 deaths alone. 2020 followed, with 103 deaths.
Hail events have fallen by nearly 50%
Nationally, the number of hail events decreased by 49.4% from 2010-12 (41,660) to 2020-22 (21,098), according to our NOAA Storm Prediction Center analysis. There were 46 states with at least 10 hail events in both three-year periods. Of these, only three experienced an increase in hail events: California (31.9%), Arizona (26.7%) and Utah (13.2%).
Why did these three states experience an increase? Hail formation is partially influenced by strong updrafts in thunderstorms (warm, rising air) and plentiful atmospheric moisture. So while climate change reduces hail severity by causing fewer storms or melting hailstones in some regions, it can cause an increase in updrafts in others — resulting in higher hail severity.
States with the biggest % increase in hail events, 2010-12 to 2020-22
| Rank | State | Hail events, 2010-12 | Hail events, 2020-22 | % change |
|---|---|---|---|---|
| 1 | California | 47 | 62 | 31.9% |
| 2 | Arizona | 86 | 109 | 26.7% |
| 3 | Utah | 38 | 43 | 13.2% |
On the other hand, Vermont saw the biggest decrease in the number of hail events, at 92.7%. That’s followed by Connecticut (80.5%) and Ohio and Indiana (both at 76.0%).
According to preliminary data, there were 6,962 hail reports in 2023. Texas (1,123) experienced the most hail events by a wide margin, while Rhode Island (one) experienced the fewest.
Full rankings: % change in hail events by state, 2010-12 to 2020-22
| Rank | State | Hail events, 2010-12 | Hail events, 2020-22 | % change |
|---|---|---|---|---|
| 1 | California | 47 | 62 | 31.9% |
| 2 | Arizona | 86 | 109 | 26.7% |
| 3 | Utah | 38 | 43 | 13.2% |
| 4 | Minnesota | 1,432 | 1,337 | -6.6% |
| 5 | Wyoming | 398 | 364 | -8.5% |
| 6 | New Hampshire | 129 | 117 | -9.3% |
| 7 | New Jersey | 175 | 152 | -13.1% |
| 8 | Wisconsin | 844 | 730 | -13.5% |
| 9 | South Dakota | 1,575 | 1,347 | -14.5% |
| 10 | Texas | 3,640 | 2,983 | -18.0% |
| 11 | Idaho | 69 | 54 | -21.7% |
| 12 | North Dakota | 909 | 681 | -25.1% |
| 13 | Montana | 772 | 543 | -29.7% |
| 14 | Oklahoma | 1,812 | 1,215 | -32.9% |
| 15 | Colorado | 1,221 | 784 | -35.8% |
| 16 | Florida | 465 | 286 | -38.5% |
| 17 | New Mexico | 391 | 228 | -41.7% |
| 18 | Louisiana | 474 | 267 | -43.7% |
| 19 | Nebraska | 2,428 | 1,312 | -46.0% |
| 20 | Arkansas | 1,132 | 588 | -48.1% |
| 21 | Iowa | 1,524 | 732 | -52.0% |
| 22 | Kansas | 3,617 | 1,597 | -55.8% |
| 23 | Oregon | 118 | 50 | -57.6% |
| 24 | Delaware | 26 | 11 | -57.7% |
| 25 | Washington | 62 | 26 | -58.1% |
| 26 | Maryland | 210 | 83 | -60.5% |
| 27 | Maine | 173 | 68 | -60.7% |
| 28 | Michigan | 618 | 234 | -62.1% |
| 29 | Mississippi | 859 | 322 | -62.5% |
| 30 | Tennessee | 1,029 | 364 | -64.6% |
| 31 | Pennsylvania | 893 | 314 | -64.8% |
| 32 | Massachusetts | 215 | 75 | -65.1% |
| 33 | West Virginia | 484 | 164 | -66.1% |
| 34 | South Carolina | 1,040 | 350 | -66.3% |
| 35 | Illinois | 1,514 | 489 | -67.7% |
| 36 | Alabama | 925 | 293 | -68.3% |
| 37 | Missouri | 2,252 | 678 | -69.9% |
| 38 | North Carolina | 1,259 | 372 | -70.5% |
| 39 | Georgia | 1,002 | 286 | -71.5% |
| 40 | Virginia | 929 | 264 | -71.6% |
| 41 | New York | 886 | 214 | -75.8% |
| 42 | Kentucky | 952 | 229 | -75.9% |
| 43 | Indiana | 1,036 | 249 | -76.0% |
| 43 | Ohio | 1,578 | 378 | -76.0% |
| 45 | Connecticut | 123 | 24 | -80.5% |
| 46 | Vermont | 261 | 19 | -92.7% |
Hail-involved billion-dollar disasters also spiked in 2023
Like tornado-involved disasters, hail-involved billion-dollar disasters caused the highest amount of damage in 2023, according to our analysis of NOAA NCEI data from the past decade. During the year, 16 hail-involved billion-dollar disasters caused an estimated $39.4 billion in damage.
That’s more than double the $19.6 billion in damage in 2020, the year with the second-highest amount of damage. 2020 was also the year with the second-highest number of hail-involved billion-dollar disasters, at nine.
Total estimated damage from billion-dollar disasters involving hail, 2014 to 2023
| Year | Billion-dollar disasters involving hail | Total estimated damage |
|---|---|---|
| 2014 | 5 | $8.5 billion |
| 2015 | 4 | $6.4 billion |
| 2016 | 6 | $15.3 billion |
| 2017 | 7 | $17.6 billion |
| 2018 | 8 | $12.9 billion |
| 2019 | 6 | $13.9 billion |
| 2020 | 9 | $19.6 billion |
| 2021 | 7 | $12.9 billion |
| 2022 | 8 | $18.2 billion |
| 2023 | 16 | $39.4 billion |
Some of the most notable hail-involved disasters in 2023 included a severe storm across the southern U.S. in June, which caused $4.1 billion in damage. Additionally, in May, scattered tornadoes and hailstorms across the eastern and central U.S. caused $3.5 billion in damage.
It’s not just your home at risk during hail: Your car can sustain serious damage during a hailstorm, sometimes even totaling your vehicle. Rest assured, though: With comprehensive auto coverage, you’re insured against ice and hail damage.
The most deaths from hail-involved billion-dollar disasters occurred in 2020, at 33. That’s followed by 2023, with 31 deaths.
Damage from tornado- and hail-involved billion-dollar disasters most common in spring
By month, the cost of damage from billion-dollar disasters involving tornadoes or hail is highest across spring. More specifically, damage reached an estimated $79.4 billion in April between 2014 and 2023 — the highest of any month.
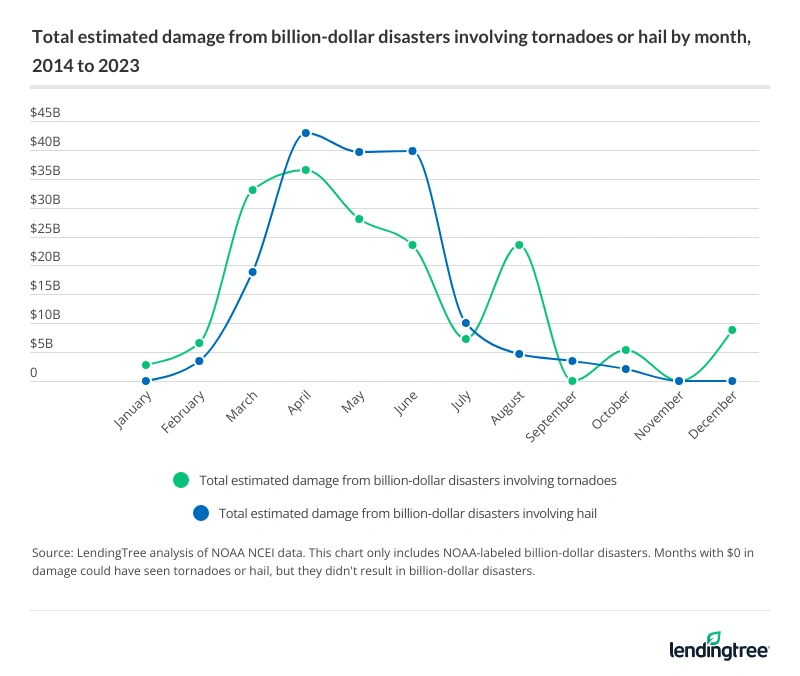
May followed, with damage reaching $67.6 billion in the period analyzed. That’s followed by June ($63.3 billion) and March ($51.9 billion).
That may be unsurprising considering these storms are most common in spring, but why are they more common this time of year? First, hailstorms are most common in spring because this is when cold air from the north often clashes with humid air from the Gulf of Mexico — a recipe for intense thunderstorms, particularly across the central and southern U.S. Similarly, tornadoes most commonly form in these severe thunderstorms.
It’s also worth noting that El Niño — a natural climate cycle that carries warm air over the Pacific Ocean — can increase the likelihood of tornadoes and hailstorms in some regions. With El Niño a particularly likely influence this spring, LendingTree home insurance expert and licensed insurance agent Rob Bhatt says it’s important to prepare your home accordingly.
“In several states, insurance companies offer discounts to customers who retrofit their homes to make them more wind resistant,” he says. “This includes securing your foundation and installing wind- and hail-resistant windows and roofs. Even if you can’t get an insurance discount for these types of improvements in your area, they’re worth considering. An investment to strengthen your home now may spare you from costlier repairs down the line.”
Protecting your home from disaster damage this spring: Top expert tips
For those who live in areas with a high tornado or hail risk, home insurance may be particularly expensive. According to Bhatt, risk plays a large role in setting rates.
“When an insurance company sets its home insurance rates, they have to show that the amount they collect in premiums is going to cover the amounts they have to pay out to repair and rebuild homes while still allowing them to make a reasonable profit,” he says. “The rate increases we have seen have been fueled largely by insurance companies resetting their rates to reflect higher building costs.”
Beyond seeking insurance discounts, how else should homeowners (particularly those in high-risk areas) prepare for tornadoes or hail this spring? Bhatt offers the following advice:
- Raising your deductible is an easy way to save a little on homeowners insurance. “Since your deductible is the amount that comes out of your pocket for repairing your home or replacing your belongings, you don’t want it to be too high,” he says. “But if you have a few thousand stashed away in a rainy-day fund somewhere, increasing your deductible to $2,000 may provide you with a noticeable reduction in your insurance bill.”
- Be proactive about maintaining your home. “You don’t have to replace your roof and windows at the first sign of wear, but don’t wait to replace them until they spring leaks or fall apart,” he says. “Additionally, several companies offer discounts for updating your plumbing and electrical systems or replacing an older HVAC with a newer model. These won’t necessarily protect you from wind and hail damage, but they can make your home a little more safe — and less expensive to insure.”
- Shop around. Homeowners insurance quotes are free, and you may discover that a different company can offer you a better rate than the one you’re paying now.
Methodology
LendingTree researchers analyzed National Oceanic and Atmospheric Administration (NOAA) Storm Prediction Center data to calculate the overall change in tornadoes and hail between 2010-12 and 2020-22 in each state that experienced at least 10 tornado or hail events. We also analyzed preliminary 2023 data. Alaska, the District of Columbia and Hawaii weren’t included in this data.
We also analyzed NOAA National Centers for Environmental Information (NCEI) data to calculate the amount of property damage caused by tornado- and hail-involved billion-dollar weather events, as well as the change in tornado and hail events (regardless of damage amounts). We analyzed the 50 states and the District of Columbia between 2014 and 2023. To calculate the amount of damage and fatalities, events that included “tornado” or “hail” in their summary were evaluated.
Total deaths include both those directly and indirectly caused by tornadoes and hail.