Florida Has Highest Identity Theft Rate, With Cape Coral Seeing Biggest Spike by Metro


From online data leaks to phishing and social media scams, personal information is extremely vulnerable in today’s digital world.
Residents in some states are more affected by identity theft than others. In fact, according to the latest LendingTree study, Florida had the highest identity theft rate as of the second quarter of 2024. And Miami had a significantly higher rate than any of the 100 largest metros, while Cape Coral saw the biggest increase.
After discussing our findings, we’ll show how insurance is connected to ID theft and how to protect yourself against it.
Key findings
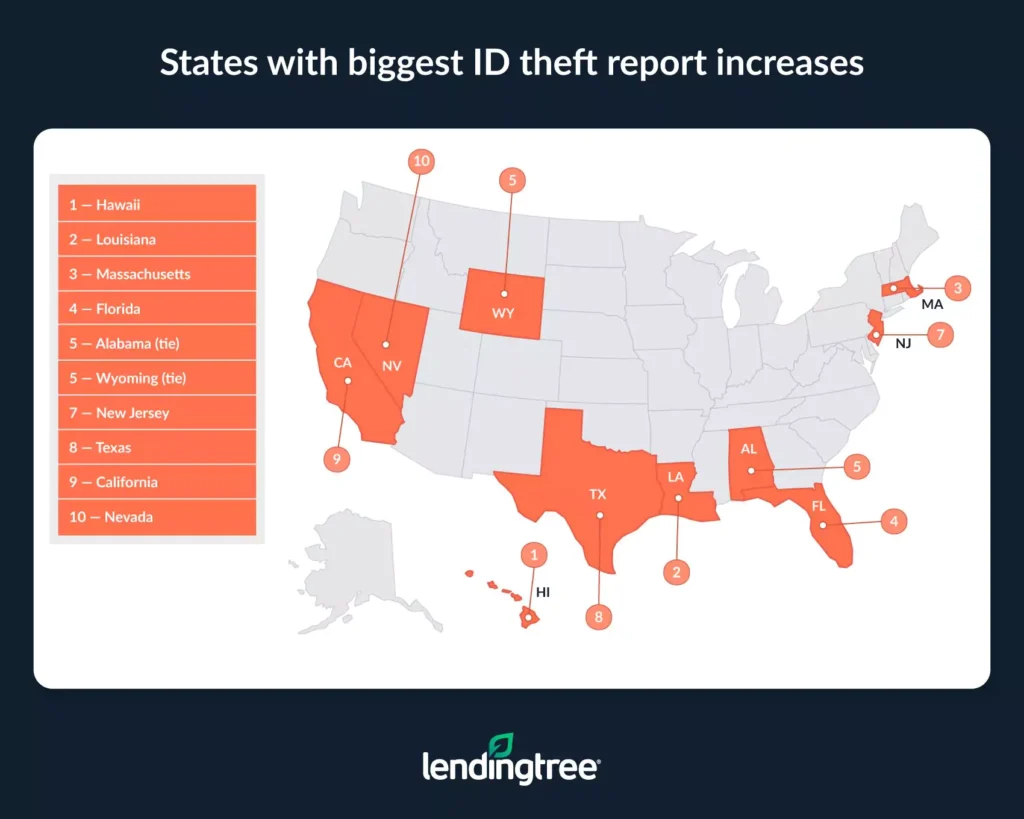
- Hawaii, Louisiana, Massachusetts and Florida saw the most significant increases in ID theft reports in the early stages of 2024. Only these four states experienced increases of greater than 20.0% in ID theft reports per 100,000 residents between the first and second quarters of 2024. Hawaii led at 32.3%, followed by Louisiana (26.5%), Massachusetts (25.9%) and Florida (23.2%).
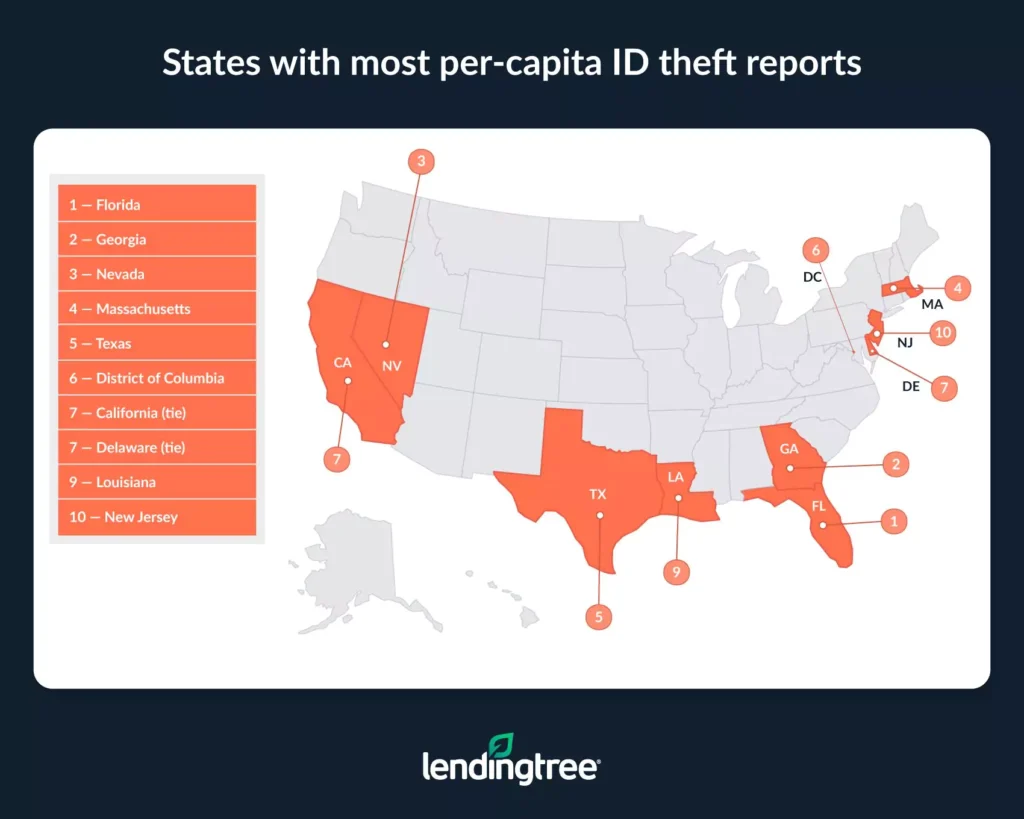
- Most recently, Florida had the highest identity theft rate. The Sunshine State had an ID theft report rate of 138 per 100,000 residents in Q2 2024. The only other states with a rate of 100 or more were Georgia (127), Nevada (122), Massachusetts (102) and Texas (100).
- By metro, two-thirds (67) of the 100 most populous saw an increase in ID theft reports early in 2024. The biggest increase between Q1 and Q2 2024 was 39.7% in Cape Coral, Fla. Honolulu (38.7%) and New Orleans (38.4%) followed.
- Miami had the highest ID theft rate — significantly higher than any other analyzed metro. Here, there were 235 ID theft reports per 100,000 residents in Q2 2024, far above Atlanta (170) and Houston (151).
- By type, other identity theft, loan or lease fraud and credit card fraud saw increases early in 2024. Reports of other identity theft (which includes online shopping or payment account fraud, email or social media theft and more) increased by 19.2% from Q1 to Q2 2024 — ahead of loan or lease fraud (8.9%) and credit card fraud (7.0%).
- Between 2020 and 2024, ID theft was highest in Q1 2021. ID theft reports reached a high of 553,882 that quarter. In the time frame analyzed, theft reports typically were higher in Q1 and Q2, with 2020 being an exception.
ID theft jumps most in Hawaii
By state, Hawaii saw the biggest jump in ID theft reports at the beginning of the year. ID theft reports increased 32.3% from 31 per 100,000 residents to 41.
That’s followed by Louisiana, which saw theft report rates jump 26.5% from 68 per 100,000 to 86, and Massachusetts, which saw ID theft report rates increase 25.9% from 81 to 102. Following, Florida (23.2%) was the only other state with an increase above 20.0%.
States with the biggest increases in ID theft reports per 100,000 residents between Q1 2024 and Q2 2024
| Rank | State | ID theft reports, Q1 2024 | ID theft reports, Q2 2024 | % change |
|---|---|---|---|---|
| 1 | Hawaii | 31 | 41 | 32.3% |
| 2 | Louisiana | 68 | 86 | 26.5% |
| 3 | Massachusetts | 81 | 102 | 25.9% |
| 4 | Florida | 112 | 138 | 23.2% |
Conversely, ID theft reports decreased the most in Montana, falling 27.9% from 43 per 100,000 to 31. That’s followed by Rhode Island, which saw report rates decrease 22.9% from 83 to 64, and North Dakota, where report rates fell 20.6% from 34 to 27. These were the only states where report rates fell by more than 20.0%.
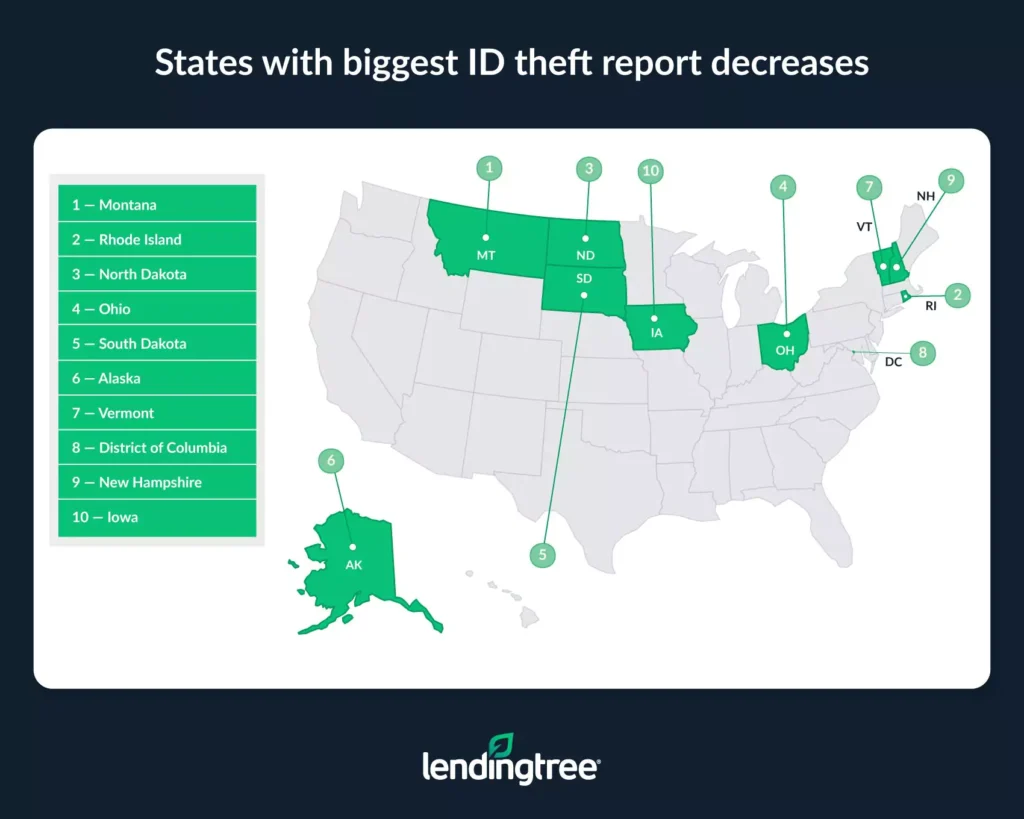
Overall, ID theft report rates increased in 29 states, decreased in 20 and were unchanged in two (Kentucky and New York).
Full rankings: States with the biggest increases/decreases in ID theft reports per 100,000 residents between Q1 2024 and Q2 2024
| Rank | State | ID theft reports, Q1 2024 | ID theft reports, Q2 2024 | % change |
|---|---|---|---|---|
| 1 | Hawaii | 31 | 41 | 32.3% |
| 2 | Louisiana | 68 | 86 | 26.5% |
| 3 | Massachusetts | 81 | 102 | 25.9% |
| 4 | Florida | 112 | 138 | 23.2% |
| 5 | Alabama | 58 | 66 | 13.8% |
| 5 | Wyoming | 29 | 33 | 13.8% |
| 7 | New Jersey | 71 | 80 | 12.7% |
| 8 | Texas | 89 | 100 | 12.4% |
| 9 | California | 82 | 92 | 12.2% |
| 10 | Nevada | 110 | 122 | 10.9% |
| 11 | Mississippi | 57 | 63 | 10.5% |
| 12 | Kansas | 39 | 43 | 10.3% |
| 13 | Tennessee | 50 | 55 | 10.0% |
| 14 | Oklahoma | 41 | 45 | 9.8% |
| 15 | Wisconsin | 36 | 39 | 8.3% |
| 16 | Georgia | 118 | 127 | 7.6% |
| 17 | West Virginia | 27 | 29 | 7.4% |
| 18 | Missouri | 41 | 44 | 7.3% |
| 19 | Connecticut | 56 | 60 | 7.1% |
| 19 | Michigan | 56 | 60 | 7.1% |
| 21 | South Carolina | 68 | 72 | 5.9% |
| 22 | Arizona | 70 | 74 | 5.7% |
| 23 | New Mexico | 36 | 38 | 5.6% |
| 24 | Washington | 42 | 44 | 4.8% |
| 25 | North Carolina | 60 | 62 | 3.3% |
| 26 | Maine | 34 | 35 | 2.9% |
| 27 | Maryland | 75 | 77 | 2.7% |
| 28 | Oregon | 41 | 42 | 2.4% |
| 29 | Virginia | 52 | 53 | 1.9% |
| 30 | Kentucky | 33 | 33 | 0.0% |
| 30 | New York | 71 | 71 | 0.0% |
| 32 | Illinois | 78 | 77 | -1.3% |
| 33 | Arkansas | 50 | 49 | -2.0% |
| 33 | Indiana | 50 | 49 | -2.0% |
| 35 | Utah | 41 | 40 | -2.4% |
| 36 | Idaho | 33 | 32 | -3.0% |
| 37 | Minnesota | 31 | 30 | -3.2% |
| 38 | Pennsylvania | 73 | 68 | -6.8% |
| 39 | Colorado | 58 | 54 | -6.9% |
| 40 | Delaware | 100 | 92 | -8.0% |
| 41 | Nebraska | 35 | 32 | -8.6% |
| 42 | Iowa | 33 | 30 | -9.1% |
| 43 | New Hampshire | 41 | 36 | -12.2% |
| 44 | District of Columbia | 112 | 98 | -12.5% |
| 45 | Vermont | 29 | 25 | -13.8% |
| 46 | Alaska | 28 | 24 | -14.3% |
| 47 | South Dakota | 27 | 23 | -14.8% |
| 48 | Ohio | 67 | 56 | -16.4% |
| 49 | North Dakota | 34 | 27 | -20.6% |
| 50 | Rhode Island | 83 | 64 | -22.9% |
| 51 | Montana | 43 | 31 | -27.9% |
Florida has highest ID theft rate
As of Q2 2024, Florida had the highest ID theft report rate, at 138 per 100,000 residents.
That’s largely because Florida has a high percentage of adults 65 and older, and they’re among the most vulnerable to identity theft due to their high savings, better credit scores and generally trusting nature.
States with the highest rate of ID theft reports per 100,000 residents in Q2 2024
| Rank | State | ID theft reports |
|---|---|---|
| 1 | Florida | 138 |
| 2 | Georgia | 127 |
| 3 | Nevada | 122 |
| 4 | Massachusetts | 102 |
| 5 | Texas | 100 |
Beyond the Sunshine State, Georgia (127), Nevada (122), Massachusetts (102) and Texas (100) were the only states with identity theft report rates of 100 or higher.
According to LendingTree insurance expert and licensed insurance agent Rob Bhatt, consumers in these states can face significant challenges after having their identity stolen.
“If an identity theft incident harms your credit score, it can have a big impact on your ability to get home insurance and auto insurance coverage,” he says. “In most states, insurance companies can factor your credit history into your rate. If an identity theft incident leaves large debts or missed payments on your credit history, you may get high insurance rates — or your application rejected. This is one reason why removing fraudulent activities from your credit report as soon as possible after an identity theft incident is important. This can be a difficult process, but it needs prompt attention.”
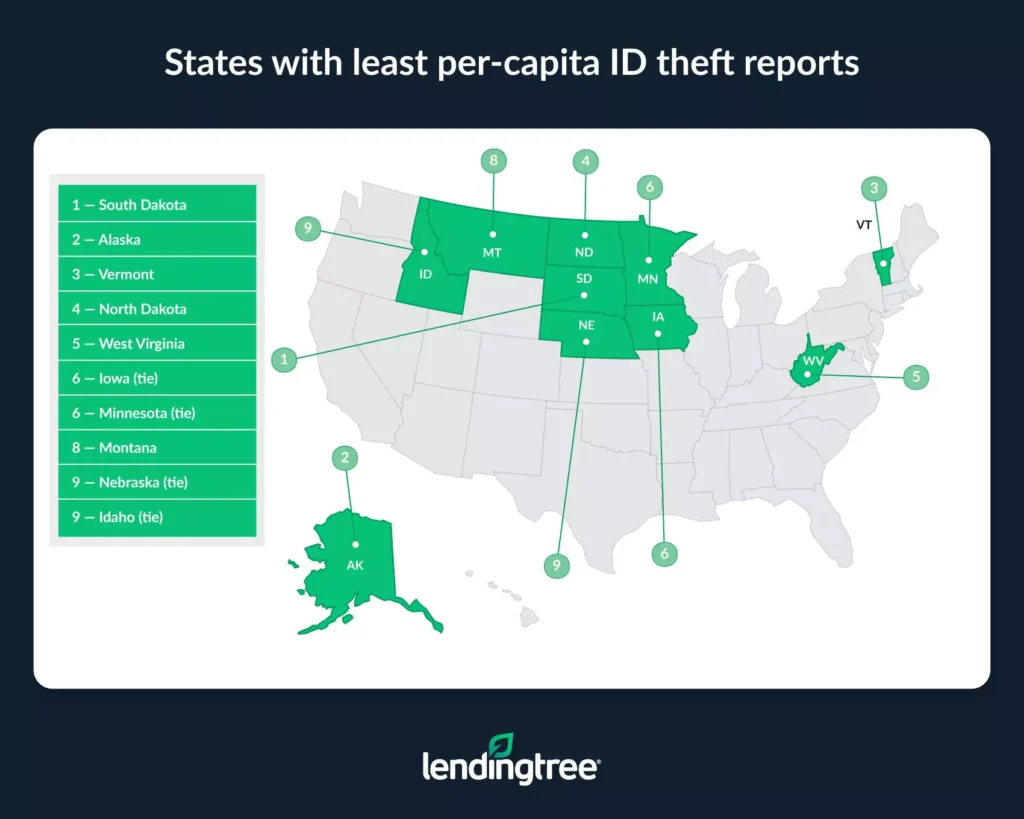
Conversely, South Dakota (23) had the lowest rate, followed by Alaska (24) and Vermont (25).
Full rankings: States with the highest/lowest rate of ID theft reports per 100,000 residents in Q2 2024
| Rank | State | ID theft reports |
|---|---|---|
| 1 | Florida | 138 |
| 2 | Georgia | 127 |
| 3 | Nevada | 122 |
| 4 | Massachusetts | 102 |
| 5 | Texas | 100 |
| 6 | District of Columbia | 98 |
| 7 | California | 92 |
| 7 | Delaware | 92 |
| 9 | Louisiana | 86 |
| 10 | New Jersey | 80 |
| 11 | Maryland | 77 |
| 11 | Illinois | 77 |
| 13 | Arizona | 74 |
| 14 | South Carolina | 72 |
| 15 | New York | 71 |
| 16 | Pennsylvania | 68 |
| 17 | Alabama | 66 |
| 18 | Rhode Island | 64 |
| 19 | Mississippi | 63 |
| 20 | North Carolina | 62 |
| 21 | Connecticut | 60 |
| 21 | Michigan | 60 |
| 23 | Ohio | 56 |
| 24 | Tennessee | 55 |
| 25 | Colorado | 54 |
| 26 | Virginia | 53 |
| 27 | Arkansas | 49 |
| 27 | Indiana | 49 |
| 29 | Oklahoma | 45 |
| 30 | Missouri | 44 |
| 30 | Washington | 44 |
| 32 | Kansas | 43 |
| 33 | Oregon | 42 |
| 34 | Hawaii | 41 |
| 35 | Utah | 40 |
| 36 | Wisconsin | 39 |
| 37 | New Mexico | 38 |
| 38 | New Hampshire | 36 |
| 39 | Maine | 35 |
| 40 | Wyoming | 33 |
| 40 | Kentucky | 33 |
| 42 | Idaho | 32 |
| 42 | Nebraska | 32 |
| 44 | Montana | 31 |
| 45 | Minnesota | 30 |
| 45 | Iowa | 30 |
| 47 | West Virginia | 29 |
| 48 | North Dakota | 27 |
| 49 | Vermont | 25 |
| 50 | Alaska | 24 |
| 51 | South Dakota | 23 |
Florida metros see highest ID theft rate increases
Turning to metros, 67 of the 100 most populous saw an increase in ID theft reports early in 2024, while 29 saw a decrease and four (Minneapolis, Salt Lake City, Albuquerque, N.M., and Harrisburg, Pa.) saw no change.
The biggest increase between Q1 and Q2 2024 was in Cape Coral, Fla., where rates jumped 39.7% from 68 per 100,000 to 95. Honolulu, where rates jumped 38.7% from 31 to 43, and New Orleans, where rates jumped 38.4% from 73 to 101, followed.
Metros with the biggest increases in ID theft reports per 100,000 residents between Q1 2024 and Q2 2024
| Rank | Metro | ID theft reports, Q1 2024 | ID theft reports, Q2 2024 | % change |
|---|---|---|---|---|
| 1 | Cape Coral, FL | 68 | 95 | 39.7% |
| 2 | Honolulu, HI | 31 | 43 | 38.7% |
| 3 | New Orleans, LA | 73 | 101 | 38.4% |
On the other hand, Ohio dominated the list of metros where rates fell the most, leading with Toledo (22.0%), Akron (19.7%), Columbus (19.4%) and Cleveland (19.1%).
Meanwhile, Miami had the highest ID theft rate by metro. At 235 ID theft reports per 100,000 residents in Q2 2024, that makes it the only metro above 200. In a distant second, Atlanta had a rate of 170 ID theft reports, followed by Houston at 151.
Metros with the highest rate of ID theft reports per 100,000 residents in Q2 2024
| Rank | Metro | ID theft reports |
|---|---|---|
| 1 | Miami, FL | 235 |
| 2 | Atlanta, GA | 170 |
| 3 | Houston, TX | 151 |
As for the metros with the lowest ID theft report rates, Ogden, Utah, ranked first at 34 per 100,000. It’s followed by Fayetteville, Ark. (35), and Boise, Idaho, and Minneapolis, tying at 36.
Full rankings: Metros with the biggest increases/decreases in ID theft reports per 100,000 residents between Q1 2024 and Q2 2024
| Rank | Metro | ID theft reports, Q1 2024 | ID theft reports, Q2 2024 | % change |
|---|---|---|---|---|
| 1 | Cape Coral, FL | 68 | 95 | 39.7% |
| 2 | Honolulu, HI | 31 | 43 | 38.7% |
| 3 | New Orleans, LA | 73 | 101 | 38.4% |
| 4 | North Port, FL | 76 | 104 | 36.8% |
| 5 | Fresno, CA | 53 | 69 | 30.2% |
| 6 | Baton Rouge, LA | 99 | 128 | 29.3% |
| 7 | Miami, FL | 182 | 235 | 29.1% |
| 8 | Lakeland, FL | 98 | 126 | 28.6% |
| 8 | Palm Bay, FL | 63 | 81 | 28.6% |
| 10 | Tulsa, OK | 42 | 53 | 26.2% |
| 11 | Worcester, MA | 57 | 71 | 24.6% |
| 12 | Boston, MA | 87 | 108 | 24.1% |
| 13 | Orlando, FL | 116 | 143 | 23.3% |
| 14 | Houston, TX | 125 | 151 | 20.8% |
| 15 | Charleston, SC | 74 | 89 | 20.3% |
| 16 | Memphis, TN | 84 | 101 | 20.2% |
| 17 | Milwaukee, WI | 54 | 64 | 18.5% |
| 18 | Kansas City, MO | 44 | 52 | 18.2% |
| 19 | Birmingham, AL | 70 | 82 | 17.1% |
| 20 | Jacksonville, FL | 77 | 90 | 16.9% |
| 21 | Hartford, CT | 53 | 61 | 15.1% |
| 22 | San Diego, CA | 74 | 85 | 14.9% |
| 23 | San Antonio, TX | 70 | 80 | 14.3% |
| 24 | Riverside, CA | 80 | 91 | 13.8% |
| 25 | Austin, TX | 73 | 83 | 13.7% |
| 26 | Augusta, SC | 83 | 94 | 13.3% |
| 27 | Greenville, SC | 61 | 69 | 13.1% |
| 28 | Tucson, AZ | 51 | 57 | 11.8% |
| 29 | San Francisco, CA | 60 | 67 | 11.7% |
| 29 | Stockton, CA | 60 | 67 | 11.7% |
| 31 | Louisville, KY | 43 | 48 | 11.6% |
| 32 | Los Angeles, CA | 124 | 138 | 11.3% |
| 33 | St. Louis, MO, | 55 | 61 | 10.9% |
| 34 | El Paso, TX | 47 | 52 | 10.6% |
| 35 | San Jose, CA | 57 | 63 | 10.5% |
| 36 | Tampa, FL | 96 | 106 | 10.4% |
| 36 | Las Vegas, NV | 135 | 149 | 10.4% |
| 38 | Detroit, MI | 83 | 91 | 9.6% |
| 39 | Nashville, TN | 53 | 58 | 9.4% |
| 40 | Sacramento, CA | 65 | 71 | 9.2% |
| 41 | Deltona, FL | 67 | 73 | 9.0% |
| 42 | Poughkeepsie, NY | 68 | 74 | 8.8% |
| 43 | Atlanta, GA | 157 | 170 | 8.3% |
| 44 | Indianapolis, IN | 76 | 82 | 7.9% |
| 45 | Oklahoma City, OK | 52 | 56 | 7.7% |
| 45 | Des Moines, IA | 39 | 42 | 7.7% |
| 47 | Dallas, TX | 111 | 119 | 7.2% |
| 48 | New York, NY | 79 | 84 | 6.3% |
| 48 | Bakersfield, CA | 64 | 68 | 6.3% |
| 50 | Phoenix, AZ | 81 | 86 | 6.2% |
| 51 | Seattle, WA | 49 | 52 | 6.1% |
| 51 | Chattanooga, TN | 49 | 52 | 6.1% |
| 51 | Fayetteville, AR | 33 | 35 | 6.1% |
| 54 | Rochester, NY | 61 | 64 | 4.9% |
| 55 | Winston-Salem, NC | 42 | 44 | 4.8% |
| 55 | Madison, WI | 42 | 44 | 4.8% |
| 55 | Wichita, KS | 42 | 44 | 4.8% |
| 58 | Raleigh, NC | 65 | 68 | 4.6% |
| 59 | Washington, DC | 73 | 76 | 4.1% |
| 60 | Oxnard, CA | 53 | 55 | 3.8% |
| 61 | Scranton, PA | 66 | 68 | 3.0% |
| 62 | Baltimore, MD | 73 | 75 | 2.7% |
| 63 | Grand Rapids, MI | 38 | 39 | 2.6% |
| 64 | Charlotte, SC | 88 | 90 | 2.3% |
| 65 | Portland, OR | 46 | 47 | 2.2% |
| 66 | Virginia Beach, NC | 59 | 60 | 1.7% |
| 67 | Jackson, MS | 69 | 70 | 1.4% |
| 68 | Minneapolis, WI | 36 | 36 | 0.0% |
| 68 | Salt Lake City, UT | 44 | 44 | 0.0% |
| 68 | Albuquerque, NM | 42 | 42 | 0.0% |
| 68 | Harrisburg, PA | 52 | 52 | 0.0% |
| 72 | Philadelphia, PA | 111 | 110 | -0.9% |
| 73 | Greensboro, NC | 58 | 57 | -1.7% |
| 74 | Durham, NC | 52 | 51 | -1.9% |
| 75 | Chicago, IL | 92 | 90 | -2.2% |
| 76 | Knoxville, TN | 42 | 41 | -2.4% |
| 77 | Colorado Springs, CO | 60 | 58 | -3.3% |
| 78 | Cincinnati, OH | 50 | 48 | -4.0% |
| 79 | Richmond, VA | 69 | 66 | -4.3% |
| 80 | Bridgeport, CT | 68 | 65 | -4.4% |
| 81 | Allentown, PA | 67 | 64 | -4.5% |
| 82 | Omaha, IA | 42 | 40 | -4.8% |
| 82 | Syracuse, NY | 42 | 40 | -4.8% |
| 82 | Little Rock, AR | 83 | 79 | -4.8% |
| 85 | Ogden, UT | 36 | 34 | -5.6% |
| 86 | Providence, MA | 88 | 83 | -5.7% |
| 87 | Buffalo, NY | 50 | 47 | -6.0% |
| 88 | Columbia, SC | 81 | 76 | -6.2% |
| 89 | Spokane, WA | 44 | 41 | -6.8% |
| 90 | Denver, CO | 66 | 61 | -7.6% |
| 91 | Boise, ID | 39 | 36 | -7.7% |
| 92 | Provo, UT | 42 | 38 | -9.5% |
| 93 | McAllen, TX | 53 | 47 | -11.3% |
| 94 | Pittsburgh, PA | 52 | 45 | -13.5% |
| 95 | Dayton, OH | 72 | 61 | -15.3% |
| 96 | Albany, NY | 54 | 44 | -18.5% |
| 97 | Cleveland, OH | 94 | 76 | -19.1% |
| 98 | Columbus, OH | 93 | 75 | -19.4% |
| 99 | Akron, OH | 71 | 57 | -19.7% |
| 100 | Toledo, OH | 59 | 46 | -22.0% |
Full rankings: Metros with the highest/lowest rate of ID theft reports per 100,000 residents in Q2 2024
| Rank | Metro | ID theft reports |
|---|---|---|
| 1 | Miami, FL | 235 |
| 2 | Atlanta, GA | 170 |
| 3 | Houston, TX | 151 |
| 4 | Las Vegas, NV | 149 |
| 5 | Orlando, FL | 143 |
| 6 | Los Angeles, CA | 138 |
| 7 | Baton Rouge, LA | 128 |
| 8 | Lakeland, FL | 126 |
| 9 | Dallas, TX | 119 |
| 10 | Philadelphia, PA | 110 |
| 11 | Boston, MA | 108 |
| 12 | Tampa, FL | 106 |
| 13 | North Port, FL | 104 |
| 14 | New Orleans, LA | 101 |
| 14 | Memphis, TN | 101 |
| 16 | Cape Coral, FL | 95 |
| 17 | Augusta, SC | 94 |
| 18 | Riverside, CA | 91 |
| 18 | Detroit, MI | 91 |
| 20 | Jacksonville, FL | 90 |
| 20 | Charlotte, SC | 90 |
| 20 | Chicago, IL | 90 |
| 23 | Charleston, SC | 89 |
| 24 | Phoenix, AZ | 86 |
| 25 | San Diego, CA | 85 |
| 26 | New York, NY | 84 |
| 27 | Austin, TX | 83 |
| 27 | Providence, MA | 83 |
| 29 | Birmingham, AL | 82 |
| 29 | Indianapolis, IN | 82 |
| 31 | Palm Bay, FL | 81 |
| 32 | San Antonio, TX | 80 |
| 33 | Little Rock, AR | 79 |
| 34 | Washington, DC | 76 |
| 34 | Columbia, SC | 76 |
| 34 | Cleveland, OH | 76 |
| 37 | Baltimore, MD | 75 |
| 37 | Columbus, OH | 75 |
| 39 | Poughkeepsie, NY | 74 |
| 40 | Deltona, FL | 73 |
| 41 | Worcester, MA | 71 |
| 41 | Sacramento, CA | 71 |
| 43 | Jackson, MS | 70 |
| 44 | Fresno, CA | 69 |
| 44 | Greenville, SC | 69 |
| 46 | Bakersfield, CA | 68 |
| 46 | Raleigh, NC | 68 |
| 46 | Scranton, PA | 68 |
| 49 | San Francisco, CA | 67 |
| 49 | Stockton, CA | 67 |
| 51 | Richmond, VA | 66 |
| 52 | Bridgeport, CT | 65 |
| 53 | Milwaukee, WI | 64 |
| 53 | Rochester, NY | 64 |
| 53 | Allentown, PA | 64 |
| 56 | San Jose, CA | 63 |
| 57 | Hartford, CT | 61 |
| 57 | St. Louis, MO | 61 |
| 57 | Denver, CO | 61 |
| 57 | Dayton, OH | 61 |
| 61 | Virginia Beach, NC | 60 |
| 62 | Nashville, TN | 58 |
| 62 | Colorado Springs, CO | 58 |
| 64 | Tucson, AZ | 57 |
| 64 | Greensboro, NC | 57 |
| 64 | Akron, OH | 57 |
| 67 | Oklahoma City, OK | 56 |
| 68 | Oxnard, CA | 55 |
| 69 | Tulsa, OK | 53 |
| 70 | Kansas City, MO | 52 |
| 70 | El Paso, TX | 52 |
| 70 | Seattle, WA | 52 |
| 70 | Chattanooga, TN | 52 |
| 70 | Harrisburg, PA | 52 |
| 75 | Durham, NC | 51 |
| 76 | Louisville, KY | 48 |
| 76 | Cincinnati, OH | 48 |
| 78 | Portland, OR | 47 |
| 78 | Buffalo, NY | 47 |
| 78 | McAllen, TX | 47 |
| 81 | Toledo, OH | 46 |
| 82 | Pittsburgh, PA | 45 |
| 83 | Winston-Salem, NC | 44 |
| 83 | Madison, WI | 44 |
| 83 | Wichita, KS | 44 |
| 83 | Salt Lake City, UT | 44 |
| 83 | Albany, NY | 44 |
| 88 | Honolulu, HI | 43 |
| 89 | Des Moines, IA | 42 |
| 89 | Albuquerque, NM | 42 |
| 91 | Knoxville, TN | 41 |
| 91 | Spokane, WA | 41 |
| 93 | Omaha, IA | 40 |
| 93 | Syracuse, NY | 40 |
| 95 | Grand Rapids, MI | 39 |
| 96 | Provo, UT | 38 |
| 97 | Minneapolis, WI | 36 |
| 97 | Boise, ID | 36 |
| 99 | Fayetteville, AR | 35 |
| 100 | Ogden, UT | 34 |
Online identity theft sees biggest increase
By type, other identity theft saw the biggest increase early in 2024, jumping 19.2% from Q1 2024 to Q2 2024.
Other identity theft includes online shopping or payment account fraud, email or social media theft, insurance theft, medical services theft and evading the law.
ID theft reports by type
| Theft report type | ID theft reports, Q1 2024 | ID theft reports, Q2 2024 | % change |
|---|---|---|---|
| Other identity theft | 73,343 | 87,417 | 19.2% |
| Loan or lease fraud | 40,651 | 44,252 | 8.9% |
| Credit card fraud | 101,518 | 108,594 | 7.0% |
| Bank account fraud | 30,383 | 28,948 | -4.7% |
| Employment or tax-related fraud | 29,006 | 27,342 | -5.7% |
| Government documents or benefits fraud | 22,072 | 20,649 | -6.4% |
| Phone or utilities fraud | 21,579 | 15,839 | -26.6% |
Loan or lease fraud (8.9%) and credit card fraud (7.0%) followed.
On the other hand, phone or utilities fraud decreased the most, falling 26.6%. That’s followed by government documents or benefits fraud (6.4%) and employment or tax-related fraud (5.7%).
ID theft rates typically highest in Q1, Q2
Between 2020 and 2024, ID theft was highest in Q1 2021. During this time, ID theft reports reached 553,882.
Between Q4 2020 and Q1 2021, data breaches jumped 12%, according to the Identity Theft Resource Center. Those affected by these breaches were more likely to have sensitive information stolen.
ID theft reports by quarter, Q1 2020 through Q2 2024
| Quarter | ID theft reports |
|---|---|
| Q1 2020 | 221,530 |
| Q2 2020 | 349,745 |
| Q3 2020 | 345,191 |
| Q4 2020 | 472,067 |
| Q1 2021 | 553,882 |
| Q2 2021 | 335,281 |
| Q3 2021 | 291,492 |
| Q4 2021 | 253,822 |
| Q1 2022 | 313,984 |
| Q2 2022 | 289,551 |
| Q3 2022 | 260,597 |
| Q4 2022 | 242,873 |
| Q1 2023 | 280,777 |
| Q2 2023 | 278,426 |
| Q3 2023 | 245,908 |
| Q4 2023 | 231,744 |
| Q1 2024 | 268,626 |
| Q2 2024 | 283,574 |
Generally, theft reports were higher in Q1 and Q2, with 2020 being an exception (which can largely be attributed to the COVID-19 pandemic).
Bhatt believes this may coincide with tax return fraud, an identity theft scam that tends to occur during tax filing season (from late January to mid-April).
There are two main types of tax refund fraud: Fraudulent filing, when perpetrators use your Social Security number to file a tax return and receive your refund check, and work fraud, when a perpetrator gives their employer your Social Security number. This causes the perpetrator’s income to be added to your earnings records with the IRS. At the end of the year, you’re taxed at a higher rate, based on this extra income that doesn’t belong to you.
“The process for getting your records in order with the IRS after either type of scam can be challenging,” Bhatt says. “You can protect yourself from these types of scams by creating an online account with the IRS. The system allows you to set up alerts if someone tries to change your address or file your return.”
Avoiding ID theft: Top expert tips
When it comes to avoiding identity theft, basic internet safety is key.
“Identity thieves often get the information they need to conduct their scams directly from their victims through bogus email, texts or internet links,” Bhatt says. “It’s generally best to avoid providing your Social Security number, account passwords or any other personal information to anyone who asks for it in an unsolicited email, text or phone call.”
Additionally, Bhatt recommends:
- Open an online account with your utility providers and the IRS. “If someone contacts you about a problem with your account, you can go directly to your account page to see if there’s a legitimate concern or if someone is trying to trick you into giving up your personal information,” Bhatt says.
- Make sure to set up two-step authentication with your financial institutions and utility and health care providers. “With two-step authentication, the company or organization sends you a text or email whenever anyone tries to log on with your credentials,” he says. “This allows them to confirm whether it’s you or an imposter.”
- Utilize credit monitoring services. “The best plans include three-bureau credit monitoring, fraud alerts and address change alerts,” Bhatt says. “These let you know if someone is trying to use your identity to get a loan or credit card, or if someone is trying to divert your mail to a different address. These types of alerts can help you detect potential identity theft in its early stages. This, in turn, allows you to freeze your accounts and alert authorities before a perpetrator does more significant harm.”
Methodology
LendingTree researchers analyzed Federal Trade Commission (FTC) Consumer Sentinel Network ID theft report data. We focused on the first and second quarters of 2024 — the latest available at the time of our research — though we utilize available data dating to Q1 2020.
We calculated the states and metros with the biggest changes in ID theft reports per 100,000 residents between Q1 2024 and Q2 2024. We ranked the states and metros from the highest percentage increases to the lowest.
Analysts calculated changes for the 100 most populous U.S. metros using the U.S. Census Bureau 2023 American Community Survey with one-year estimates.
We also ranked the states and metros from the highest to lowest ID theft rates, regardless of change.