America’s Biggest Boomtowns: 8 of 10 Fastest-Growing Metros in South, Including 5 in Florida


Looking for a boomtown? Look down south, where eight of the 10 fastest-growing U.S. metros are. And look even more closely at Florida — five of them are in the Sunshine State alone.
We ranked and scored the 100 largest metros across eight unique metrics grouped into three categories: people and housing, work and earnings, and business and economy.
Read on to learn which metros came out on top and which came out on the bottom. We also delve into how small business owners can grow their businesses, no matter where they are.
Key findings
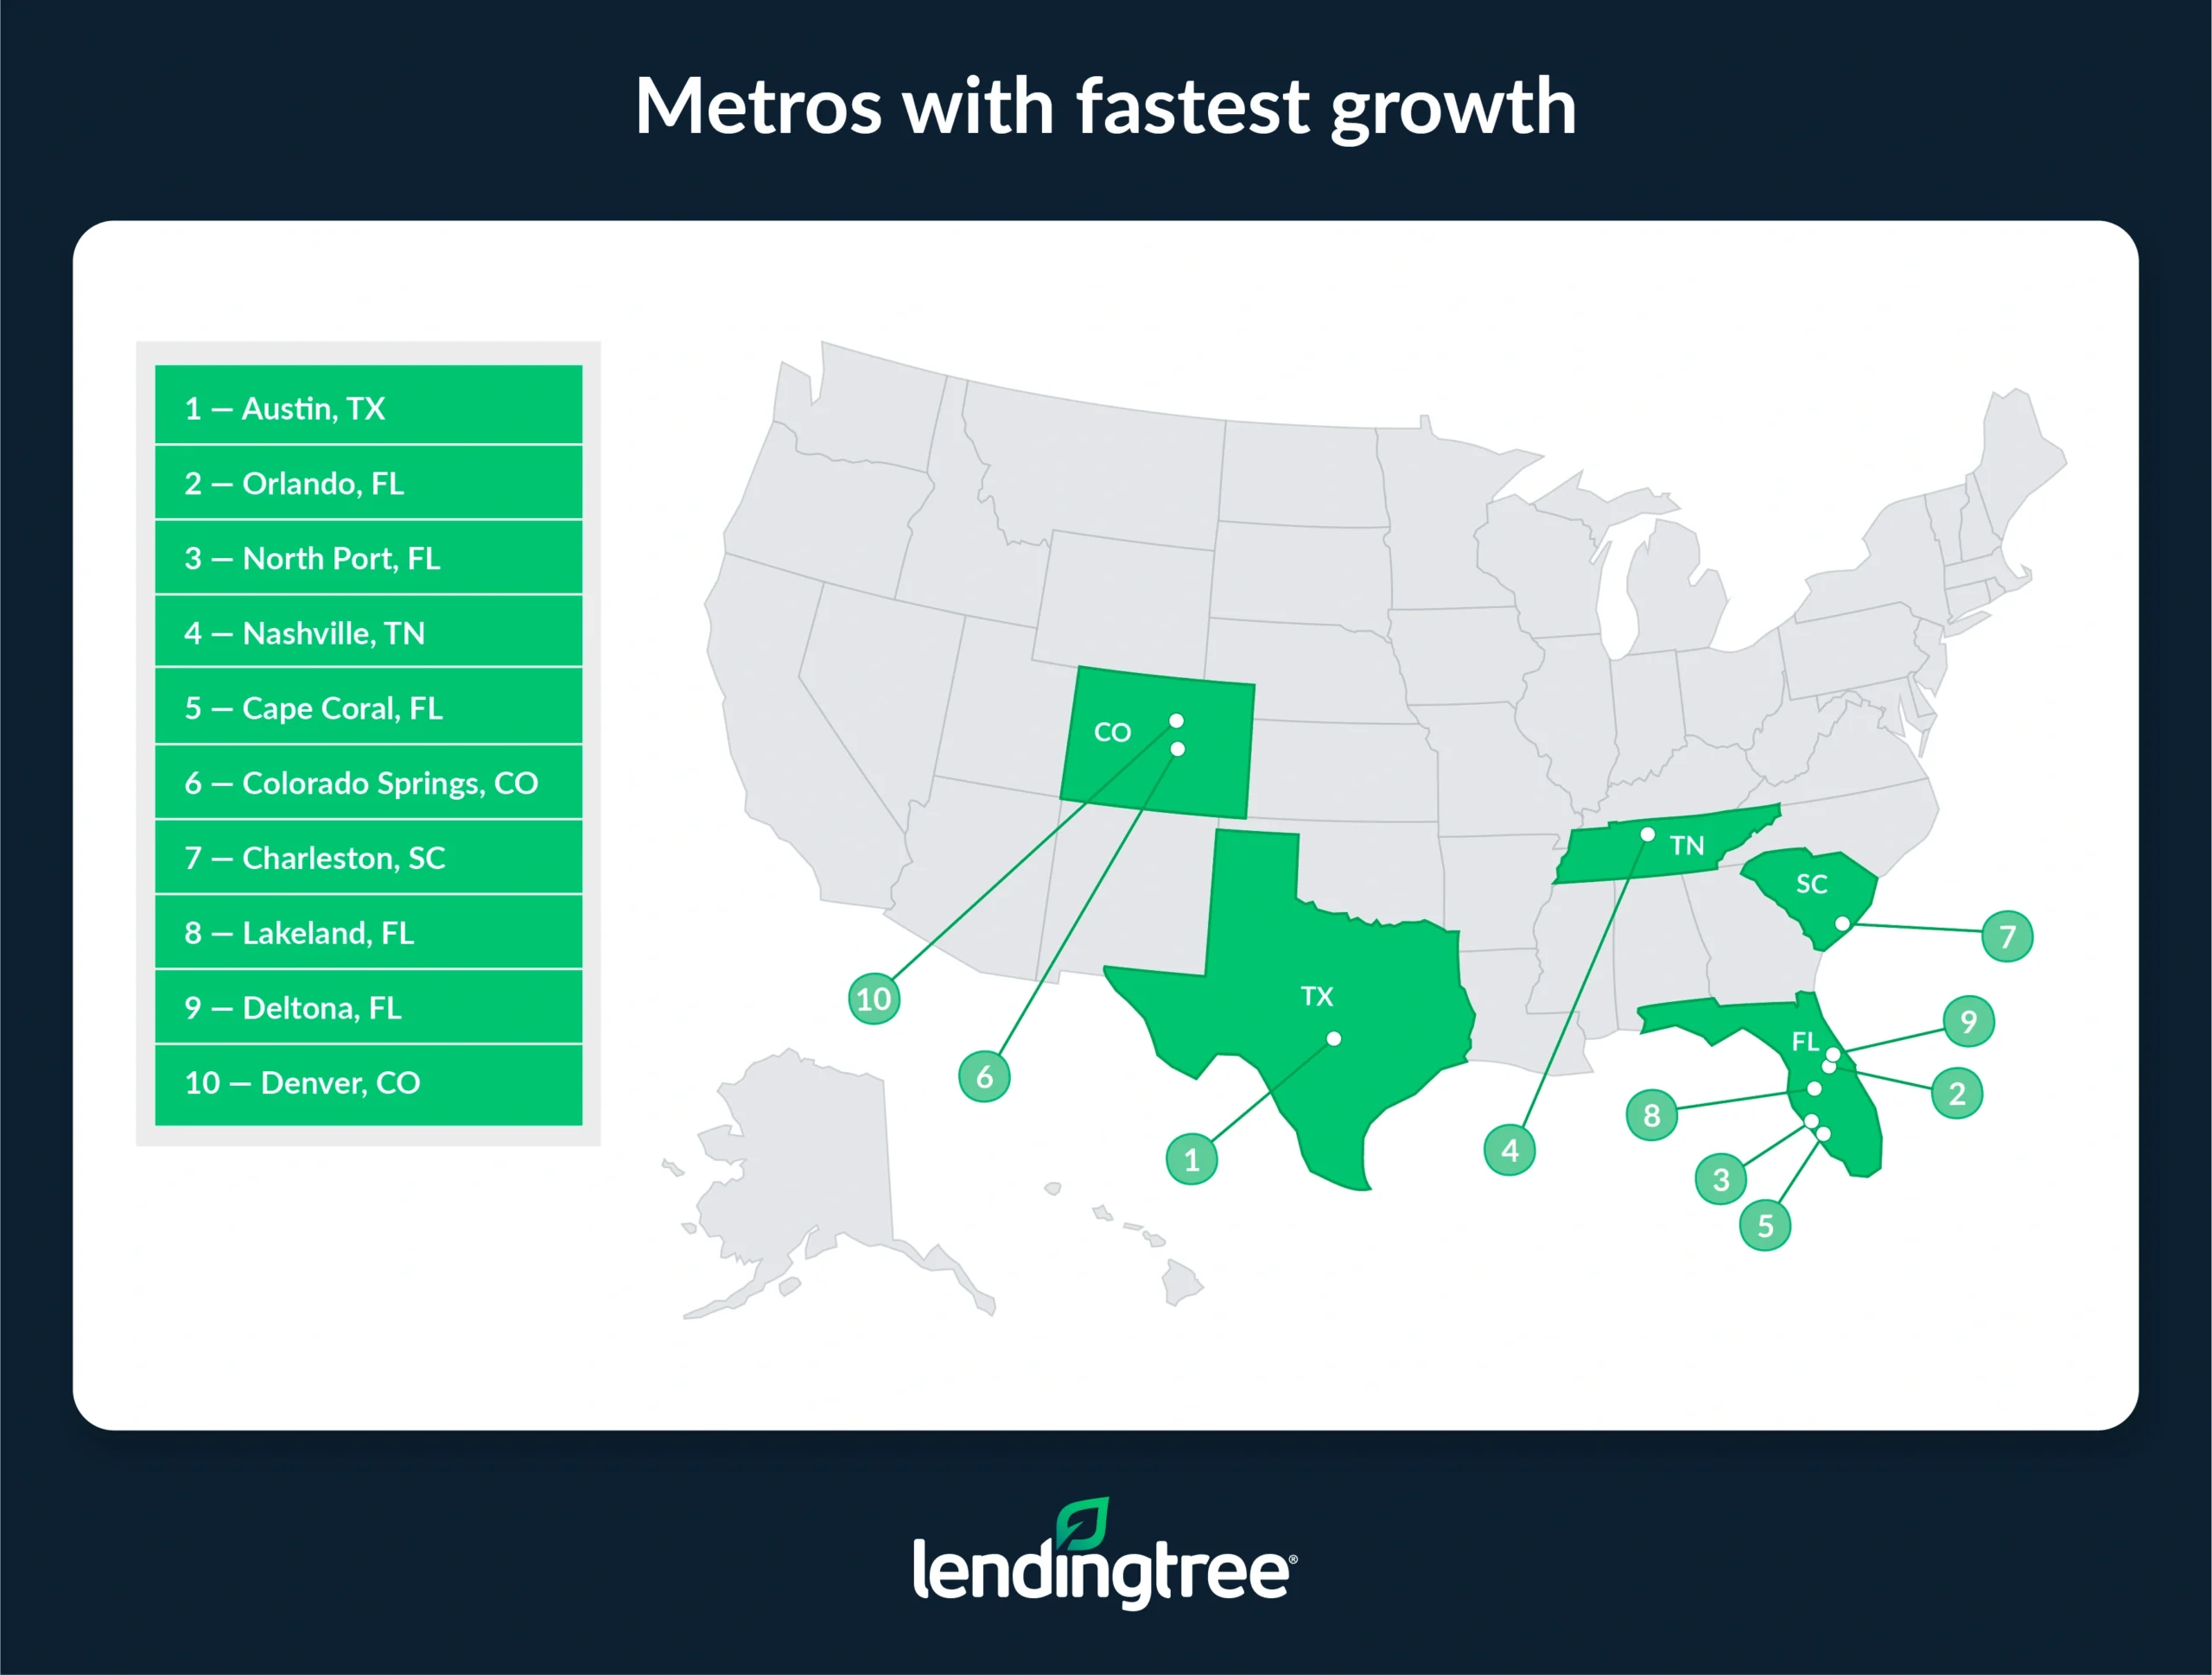
- Eight of the 10 fastest-growing U.S. metros are in the South, including five in Florida. The only metros outside the South to make the top 10 are in Colorado.
- Austin, Texas, leads the list of boomtowns. Austin — still in the top spot since the last time we performed this analysis — recorded the highest gross domestic product (GDP) growth (14.6%) and one of the highest increases in housing units (9.4%). Its population grew by 5.1%, with nearly 1 in 5 residents (18.6%) relocating from another county, state or country.
- Orlando and North Port, Fla., round out the top three. Orlando saw standout growth in our work and earnings category, with median earnings up 18.1% (fifth-highest) and an 8.0% (ninth-highest) increase in the workforce. The metro also saw an 11.7% (sixth-highest) rise in GDP. North Port was bolstered by strong GDP growth (11.8%) and a high rate of new residents from outside the area (18.9%) — both fifth overall.
- New Orleans ranks last overall, finishing at the bottom in our three primary categories. The metro experienced steep declines in population (23.7%), housing units (19.0%), workforce (23.0%) and new business formation (22.3%). Cleveland and Worcester, Mass., join the bottom three.
Southern metros (particularly in Florida) are biggest boomtowns
The South is doing quite well when it comes to growth in three key areas: people and housing, work and earnings, and business and economy. When we compared data across eight key metrics in these categories — mainly from between 2021 and 2023 — we found eight of the 10 fastest-growing metros are in the South.
Five of the booming-est metros are located in Florida alone:
- Orlando (2nd)
- North Port (3rd)
- Cape Coral (5th)
- Lakeland (8th)
- Deltona (9th)
Why the surge of success in the Sunshine State? The year-round warm weather, of course, comes to mind, but it’s also a hot spot due to lower taxes (no state-level personal income tax) and more relaxed regulations. Florida is home to many well-respected colleges and universities that provide a pipeline for talent to businesses in the state, and the state actively invests in incentives to attract lucrative industries such as e-commerce, aerospace and biotechnology.
In general, people seem to be charmed by metros in Southern states. Austin, Texas (first), Nashville, Tenn. (fourth), and Charleston, S.C. (seventh), also represent the South in the top 10.
More affordable housing, a lower cost of living and more job opportunities top the list. Also, the more people move to these states, the more their friends and family members who want to be near them follow them — so there may also be a chain reaction of sorts at play.
Only two of the fastest-growing metros are outside the South. Both are out West in Colorado: Colorado Springs, which ranks sixth, and Denver, which ranks 10th.
Unemployment falls in 99 of 100 major U.S. metros
There’s good news on the job front nearly across the board. In every metro we analyzed — except one — the unemployment rate fell between 2021 and 2023. The one exception: Provo, Utah.
Provo was the only metro among the 100 largest to experience an increase in unemployment — seeing a rise of 12.5% during that time. The annual average unemployment rate in Provo increased from 2.4% in 2021 — the lowest rate among all 100 largest metros that year — to 2.7% in 2023.
Those with the biggest decreases in unemployment included Baltimore (-56.0%), Honolulu (-52.7%), Miami (-51.0%) and Hartford, Conn. (-50.8%) — all of which saw a drop in unemployment of more than 50.0%.
Austin, Texas, is biggest boomtown again
It’s Austin that takes the biggest boomtown title — once again. Texas’ capital city also ranked as the biggest boomtown in our last study, which mainly compared data in the same categories between 2019 to 2021.
What kept Austin the reigning boomtown?
In our most recent study, Austin had:
- The highest gross domestic product (GDP) growth (14.6%)
- One of the highest increases in housing units (9.4%, third-highest)
- Population growth of 5.1% (12th-highest), with nearly 1 in 5 residents (18.6%) relocating from another county, state or country
Following Austin at the top of the list of biggest boomtowns are Orlando and North Port, Fla., which rank as the second- and third-biggest boomtowns, respectively, in our latest study. In our previous study, North Port came in sixth, while Orlando came in 20th.
Some factors that pushed them even higher in this latest study:
- North Port saw an 11.8% increase in GDP (fifth-highest), while Orlando saw an increase of 11.7% (sixth-highest).
- North Port saw a 6.5% increase in housing units (11th-highest), while Orlando saw a 5.1% increase (18th-highest).
- North Port saw an even bigger increase in its population than Austin between 2021 and 2023 — 5.9% (seventh-highest) — while Orlando saw a 4.7% increase (13th-highest). Both North Port (18.9%) and Orlando (17.0%) saw a high rate of new residents from outside the area — fifth-highest and 10th-highest overall.
- Orlando saw a surge in our work and earnings category, with median earnings up 18.1% (fifth-highest) and a workforce increase of 8.0% (ninth-highest). North Port saw median earnings rise 15.3% (17th-highest) and a 5.4% (28th-highest) increase in workforce.
So if you’re a business owner in one of these boomtowns, how do you make the most of the momentum?
Matt Schulz, LendingTree chief consumer finance analyst and author of “Ask Questions, Save Money, Make More: How to Take Control of Your Financial Life,” offers a few ideas to capitalize on in a thriving metro.
“A booming population may mean a better talent pool to pick from for employees,” Schulz says. “An influx of business growth may mean greater competition, which could help lower some of the costs of running your business. It could also mean greater opportunity to partner with other companies when it comes to marketing, training or other aspects of business. It could mean more networking opportunities. The list goes on and on.”
New Orleans has smallest boomtown growth
Things are more of a blip than a boom in New Orleans, which ranks last in our boomtown rankings. In our previous study tracking growth in the biggest 100 metros, New Orleans came in a bit higher at 92nd.
Factors that pushed New Orleans to the bottom in this latest study include a 23.7% decrease in population and a 19.0% decrease in housing units — the biggest declines of any metro in both categories. NOLA also saw the biggest decrease in new business formation (-22.3%).
For all its rich culture and tourist attractions, New Orleans still seems to be suffering in the wake of Hurricane Katrina. Even though the storm hit nearly two decades ago, the city and its residents have struggled to rebuild their lives. The city’s government is also charged with making poor financial decisions that have left New Orleans in debt.
On a more positive note: New Orleans’ GDP saw a 3.6% increase — ranking 70th out of the 100 metros for it.
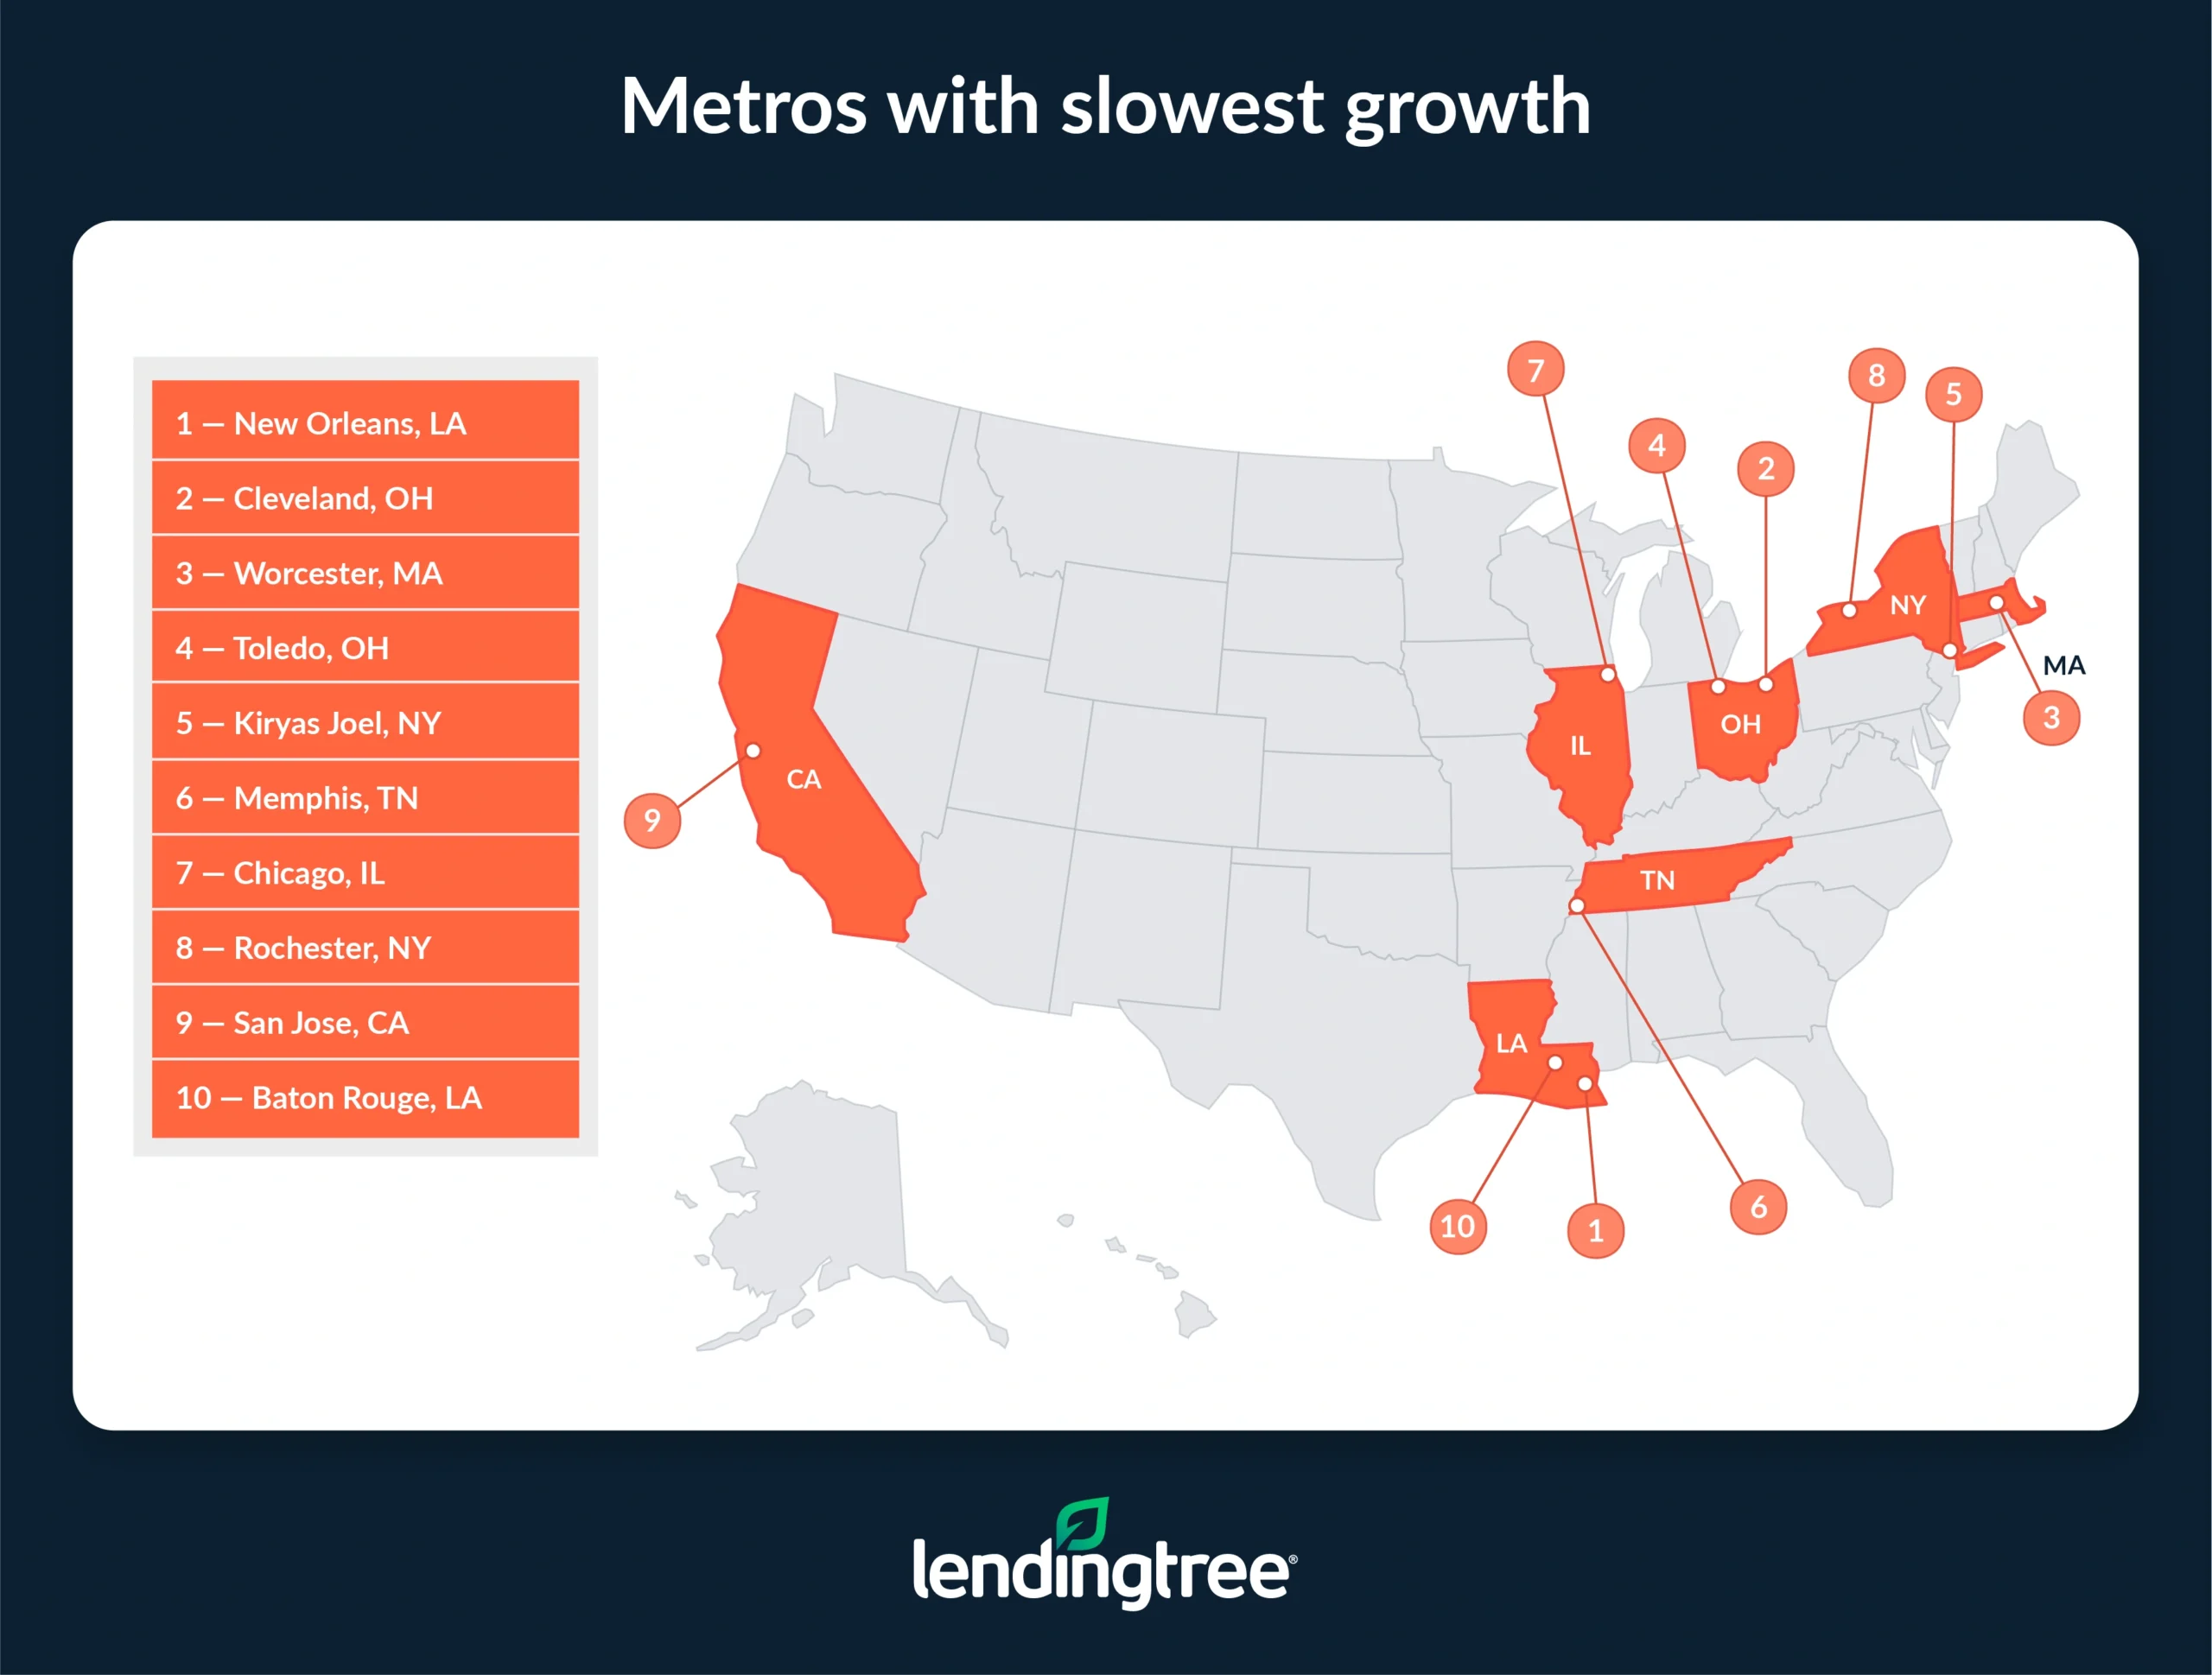
Other metros near the bottom of the list of boomtowns include Worcester, Mass., and Cleveland — ranking 98th and 99th, respectively, in our latest study. Worcester took a big nosedive from our previous study when it ranked 53rd, and Cleveland took an even bigger nosedive from 44th.
Some contributing factors:
- Both cities saw population decreases: -0.6% in Cleveland (82nd-highest) and -11.4% (99th-highest) in Worcester.
- Both also saw decreases in housing units: -0.4% in Cleveland (87th-highest) and -11.5% in Worcester (99th-highest).
- Although both saw GDP increases, they were among the lowest of the studied metros: Cleveland’s GDP increased by 2.7% (84th-highest), while Worcester’s jumped just 2.3% (88th-highest).
What does being in a struggling metro mean for small business owners?
“Being in an area that isn’t really growing can create some significant challenges for businesses,” Schulz says. “People simply may not have as much money to spend — or if they do have money, they may not feel comfortable spending much of it because of economic struggles in their area. People who are unsure about their own financial situation tend to be pretty cautious with their money, and that’s not great news for businesses in their area.”
Being in an area that isn’t really growing can create some significant challenges for businesses.

On the other hand, he says there can be opportunities in the slower growth areas.
“For example, a booming area could have more businesses in your niche, trying to sell to the same customers, while competition may be significantly less in another area with slower growth.”
Bigger cities aren’t necessarily booming
A potentially surprising note: The three largest U.S. metros — New York, Los Angeles and Chicago — are 89th, 84th and 94th, respectively, in our ranking of biggest boomtowns.
Why are the big cities struggling? Schulz says one reason is pretty simple: Those three places are expensive, which can make managing a business a bigger challenge.
“Whether you’re talking about rent, salaries, taxes or other economic factors, the higher the costs of doing business in an area, the greater the challenge for the small businessperson,” he says. “Of course, there are other reasons as well, but it’s difficult to overstate the importance of cost. Starting a business is hard wherever you do it. Doing so in a high-cost area just makes it even tougher.”
Full rankings: People and housing
| Rank | Metro | Population change | % of population who moved from another county, state or country | Housing units change | Category score |
|---|---|---|---|---|---|
| 1 | Austin, TX | 5.1% | 18.6% | 9.4% | 78.1 |
| 2 | North Port, FL | 5.9% | 18.9% | 6.5% | 76.7 |
| 3 | Charleston, SC | 4.5% | 18.6% | 4.5% | 73.0 |
| 4 | Lakeland, FL | 8.6% | 15.4% | 7.6% | 72.6 |
| 4 | Colorado Springs, CO | 0.8% | 19.3% | 5.7% | 72.6 |
| 6 | Denver, CO | 1.1% | 19.9% | 3.7% | 72.2 |
| 7 | Provo, UT | 5.2% | 15.5% | 9.7% | 71.9 |
| 8 | Fresno, CA | 16.4% | 7.2% | 17.0% | 70.5 |
| 9 | Orlando, FL | 4.7% | 17.0% | 5.1% | 70.4 |
| 10 | Nashville, TN | 4.5% | 15.5% | 7.8% | 69.5 |
| 10 | Jacksonville, FL | 4.6% | 16.0% | 6.5% | 69.5 |
| 12 | Richmond, VA | 2.5% | 18.0% | 3.4% | 69.1 |
| 12 | Fayetteville, AR | 5.7% | 15.4% | 6.5% | 69.1 |
| 14 | Virginia Beach, VA | -1.4% | 20.4% | 0.0% | 67.8 |
| 15 | Columbia, SC | 2.5% | 17.4% | 2.7% | 67.2 |
| 16 | Boise, ID | 3.1% | 15.1% | 7.1% | 66.9 |
| 17 | Cape Coral, FL | 5.9% | 14.4% | 5.4% | 66.2 |
| 18 | Deltona, FL | 5.3% | 14.7% | 4.7% | 65.7 |
| 19 | Raleigh, NC | 4.2% | 13.9% | 7.4% | 65.6 |
| 20 | Tampa, FL | 3.8% | 15.7% | 3.4% | 65.3 |
| 21 | Greenville, SC | 3.7% | 15.3% | 4.2% | 65.1 |
| 22 | Knoxville, TN | 6.0% | 13.5% | 5.8% | 64.8 |
| 23 | Dallas, TX | 4.4% | 14.4% | 5.0% | 64.6 |
| 24 | Atlanta, GA | 2.6% | 15.5% | 3.6% | 64.1 |
| 24 | Charlotte, NC | 3.9% | 14.6% | 4.5% | 64.1 |
| 26 | Augusta, GA | 1.9% | 15.6% | 3.2% | 63.4 |
| 27 | Madison, WI | 1.6% | 15.4% | 3.8% | 63.2 |
| 28 | Oklahoma City, OK | 2.5% | 15.7% | 2.2% | 63.1 |
| 28 | Grand Rapids, MI | 6.5% | 11.5% | 8.1% | 63.1 |
| 30 | Chattanooga, TN | 2.3% | 14.8% | 3.0% | 61.8 |
| 31 | San Antonio, TX | 3.9% | 13.5% | 4.4% | 61.7 |
| 32 | Durham, NC | -6.9% | 21.2% | -4.4% | 60.8 |
| 33 | Louisville, KY | 6.2% | 10.7% | 7.6% | 60.7 |
| 34 | Birmingham, AL | 6.3% | 10.5% | 7.7% | 60.4 |
| 35 | Houston, TX | 4.2% | 12.1% | 5.5% | 60.0 |
| 36 | Washington, DC | -0.9% | 16.1% | 0.3% | 59.4 |
| 37 | Des Moines, IA | 2.5% | 13.0% | 4.0% | 59.1 |
| 38 | Portland, OR | 0.0% | 14.4% | 2.5% | 58.6 |
| 38 | Palm Bay, FL | 4.4% | 12.3% | 3.3% | 58.6 |
| 40 | Jackson, MS | 3.9% | 12.0% | 4.4% | 58.5 |
| 41 | Seattle, WA | 0.8% | 13.5% | 3.3% | 58.1 |
| 41 | Albany, NY | 0.6% | 14.5% | 1.2% | 58.1 |
| 43 | Minneapolis, MN | 0.6% | 13.6% | 3.0% | 57.9 |
| 44 | Harrisburg, PA | 1.6% | 13.8% | 1.5% | 57.7 |
| 45 | Tucson, AZ | 1.1% | 13.3% | 2.0% | 56.7 |
| 46 | Tulsa, OK | 2.0% | 12.7% | 2.1% | 56.3 |
| 47 | Winston-Salem, NC | 2.1% | 12.4% | 2.5% | 56.1 |
| 48 | Boston, MA | 0.4% | 13.6% | 1.1% | 55.9 |
| 48 | Omaha, NE | 1.3% | 12.5% | 2.8% | 55.9 |
| 50 | Greensboro, NC | 1.4% | 12.7% | 2.0% | 55.7 |
| 51 | Indianapolis, IN | 0.5% | 13.0% | 1.9% | 55.5 |
| 52 | Columbus, OH | 1.4% | 12.4% | 2.4% | 55.4 |
| 53 | Kansas City, MO | 0.9% | 12.6% | 2.1% | 55.2 |
| 54 | Dayton, OH | 0.1% | 13.4% | 0.9% | 55.1 |
| 55 | Little Rock, AR | 2.0% | 11.9% | 2.0% | 54.5 |
| 56 | Sacramento, CA | 0.4% | 12.1% | 2.3% | 53.9 |
| 56 | San Jose, CA | -0.3% | 12.7% | 1.6% | 53.9 |
| 58 | Phoenix, AZ | 2.5% | 10.6% | 3.7% | 53.8 |
| 59 | Spokane, WA | 1.2% | 11.3% | 3.1% | 53.6 |
| 60 | Salt Lake City, UT | 0.4% | 10.9% | 4.3% | 53.2 |
| 61 | Baton Rouge, LA | 0.2% | 11.8% | 2.3% | 53.1 |
| 61 | Syracuse, NY | -0.8% | 13.1% | 0.3% | 53.1 |
| 63 | Las Vegas, NV | 1.9% | 10.7% | 3.1% | 52.9 |
| 64 | San Francisco, CA | -1.2% | 12.5% | 1.7% | 52.8 |
| 64 | Baltimore, MD | -0.1% | 12.5% | 0.7% | 52.8 |
| 66 | Stockton, CA | 1.5% | 10.3% | 3.9% | 52.5 |
| 67 | Miami, FL | 1.5% | 11.3% | 1.4% | 52.3 |
| 68 | Cincinnati, OH | 0.5% | 11.9% | 0.9% | 52.2 |
| 69 | Honolulu, HI | -1.1% | 12.2% | 1.0% | 51.7 |
| 70 | Albuquerque, NM | 0.2% | 11.2% | 1.7% | 51.3 |
| 71 | Akron, OH | -0.2% | 11.5% | 1.1% | 51.0 |
| 72 | Bridgeport, CT | -0.9% | 12.3% | -0.5% | 50.7 |
| 73 | Philadelphia, PA | 0.3% | 10.7% | 1.6% | 50.2 |
| 73 | Scranton, PA | 0.3% | 11.2% | 0.4% | 50.2 |
| 75 | Pittsburgh, PA | 2.9% | 8.3% | 4.4% | 49.9 |
| 75 | Kiryas Joel, NY | 0.4% | 10.6% | 1.4% | 49.9 |
| 77 | Wichita, KS | 0.8% | 10.2% | 1.7% | 49.7 |
| 78 | Allentown, PA | 1.0% | 10.1% | 1.2% | 49.1 |
| 79 | Providence, RI | 0.1% | 10.7% | 0.5% | 49.0 |
| 80 | San Diego, CA | -0.5% | 10.2% | 2.0% | 48.9 |
| 81 | St. Louis, MO | -0.4% | 10.4% | 1.1% | 48.5 |
| 82 | Memphis, TN | -0.1% | 9.6% | 2.2% | 48.1 |
| 83 | Riverside, CA | 0.8% | 8.9% | 2.1% | 47.3 |
| 84 | Milwaukee, WI | -0.4% | 9.4% | 0.6% | 45.9 |
| 85 | New York, NY | -1.4% | 9.6% | 0.7% | 45.6 |
| 86 | El Paso, TX | 0.0% | 8.6% | 1.5% | 45.4 |
| 87 | Rochester, NY | -3.0% | 11.2% | -1.9% | 45.3 |
| 88 | Detroit, MI | -0.5% | 8.4% | 1.4% | 44.5 |
| 89 | Cleveland, OH | -0.6% | 8.8% | 0.4% | 44.3 |
| 90 | Oxnard, CA | -1.2% | 8.3% | 1.1% | 43.4 |
| 91 | McAllen, TX | 2.1% | 5.4% | 4.3% | 43.0 |
| 92 | Chicago, IL | -2.6% | 9.2% | -1.1% | 42.1 |
| 92 | Buffalo, NY | -0.6% | 7.7% | 0.5% | 42.1 |
| 94 | Hartford, CT | -5.0% | 11.3% | -4.4% | 41.5 |
| 95 | Bakersfield, CA | -0.4% | 6.3% | 1.9% | 40.6 |
| 96 | Los Angeles, CA | -1.5% | 6.6% | 1.5% | 40.0 |
| 97 | Ogden, UT | -7.1% | 10.4% | -3.9% | 38.3 |
| 98 | Toledo, OH | -6.8% | 10.2% | -9.1% | 33.3 |
| 99 | Worcester, MA | -11.4% | 11.0% | -11.5% | 29.0 |
| 100 | New Orleans, LA | -23.7% | 10.2% | -19.0% | 10.1 |
Full rankings: Work and earnings
| Rank | Metro | Change in workforce | Change in unemployment rate | Change in median earnings | Category score |
|---|---|---|---|---|---|
| 1 | Orlando, FL | 8.0% | -42.0% | 18.1% | 81.2 |
| 2 | Nashville, TN | 7.8% | -31.6% | 19.9% | 80.3 |
| 3 | Lakeland, FL | 15.1% | -30.2% | 16.1% | 76.4 |
| 4 | Miami, FL | 3.6% | -51.0% | 15.2% | 74.8 |
| 5 | Providence, RI | 0.1% | -41.4% | 18.2% | 74.6 |
| 6 | San Diego, CA | 1.0% | -42.2% | 17.3% | 73.5 |
| 7 | Honolulu, HI | 0.2% | -52.7% | 14.8% | 71.8 |
| 8 | Colorado Springs, CO | 4.7% | -39.3% | 15.4% | 70.5 |
| 9 | Bakersfield, CA | 5.0% | -17.2% | 18.7% | 68.1 |
| 10 | Fresno, CA | 17.2% | -19.6% | 14.0% | 67.8 |
| 11 | Milwaukee, WI | 1.5% | -31.8% | 16.7% | 67.4 |
| 12 | Charleston, SC | 7.7% | -28.6% | 15.0% | 66.8 |
| 13 | Las Vegas, NV | 4.3% | -30.8% | 15.5% | 66.2 |
| 13 | McAllen, TX | 8.9% | -31.5% | 13.8% | 66.2 |
| 15 | Deltona, FL | 9.5% | -29.2% | 14.0% | 66.1 |
| 16 | Greensboro, NC | 2.5% | -27.8% | 16.6% | 66.0 |
| 17 | Grand Rapids, MI | 8.8% | -24.4% | 14.8% | 65.2 |
| 18 | Dallas, TX | 7.1% | -25.5% | 15.1% | 65.0 |
| 18 | Oxnard, CA | -0.4% | -32.3% | 16.3% | 65.0 |
| 20 | Winston-Salem, NC | 6.3% | -28.6% | 14.7% | 64.9 |
| 21 | Denver, CO | 3.0% | -41.8% | 12.9% | 64.2 |
| 21 | Cape Coral, FL | 5.3% | -25.0% | 15.5% | 64.2 |
| 23 | Greenville, SC | 8.3% | -20.6% | 15.3% | 64.1 |
| 24 | Richmond, VA | 5.3% | -30.0% | 14.4% | 64.0 |
| 25 | Los Angeles, CA | 0.7% | -42.7% | 13.4% | 63.9 |
| 26 | Birmingham, AL | 6.4% | -25.8% | 14.7% | 63.6 |
| 26 | North Port, FL | 5.4% | -24.4% | 15.3% | 63.6 |
| 28 | Bridgeport, CT | 0.4% | -48.3% | 12.2% | 63.5 |
| 29 | Boston, MA | 1.3% | -33.3% | 14.7% | 63.0 |
| 29 | Raleigh, NC | 6.8% | -25.0% | 14.5% | 63.0 |
| 31 | Charlotte, NC | 6.1% | -29.8% | 13.7% | 62.9 |
| 32 | Chicago, IL | -0.2% | -29.0% | 15.9% | 62.6 |
| 33 | Hartford, CT | -3.4% | -50.8% | 12.6% | 62.5 |
| 34 | Phoenix, AZ | 4.8% | -30.4% | 13.8% | 62.3 |
| 35 | Akron, OH | 3.5% | -30.2% | 14.1% | 61.9 |
| 36 | Memphis, TN | 1.3% | -38.7% | 13.1% | 61.7 |
| 37 | Jacksonville, FL | 5.6% | -26.2% | 14.0% | 61.4 |
| 38 | Houston, TX | 7.2% | -32.3% | 12.1% | 61.0 |
| 38 | Riverside, CA | 4.7% | -36.5% | 12.1% | 61.0 |
| 40 | Albany, NY | 1.1% | -29.5% | 14.3% | 60.0 |
| 41 | Jackson, MS | 7.9% | -45.1% | 8.8% | 59.8 |
| 42 | San Antonio, TX | 5.9% | -28.8% | 12.6% | 59.5 |
| 42 | Portland, OR | 3.1% | -28.6% | 13.6% | 59.5 |
| 44 | El Paso, TX | 1.2% | -28.3% | 14.1% | 59.1 |
| 45 | Austin, TX | 7.4% | -16.7% | 14.3% | 59.0 |
| 45 | Toledo, OH | -6.6% | -30.5% | 16.3% | 59.0 |
| 47 | Sacramento, CA | 3.0% | -33.3% | 12.4% | 58.8 |
| 48 | Columbus, OH | 2.7% | -36.2% | 11.6% | 58.0 |
| 48 | Little Rock, AR | 0.6% | -29.3% | 13.7% | 58.0 |
| 50 | Albuquerque, NM | 3.2% | -47.7% | 9.1% | 57.9 |
| 51 | St. Louis, MO | 2.7% | -26.7% | 13.4% | 57.8 |
| 51 | Dayton, OH | 1.8% | -30.2% | 13.0% | 57.8 |
| 53 | Detroit, MI | 0.9% | -41.0% | 11.1% | 57.6 |
| 54 | Omaha, NE | 3.3% | -16.7% | 15.0% | 57.3 |
| 55 | Augusta, GA | 2.1% | -7.5% | 16.9% | 56.5 |
| 56 | Syracuse, NY | 2.6% | -30.0% | 12.2% | 56.4 |
| 57 | Boise, ID | 6.4% | -11.8% | 14.4% | 56.1 |
| 57 | Wichita, KS | 2.3% | -29.5% | 12.3% | 56.1 |
| 59 | Pittsburgh, PA | 3.7% | -37.3% | 10.2% | 55.9 |
| 60 | Minneapolis, MN | 1.2% | -27.8% | 12.9% | 55.8 |
| 60 | Des Moines, IA | 4.1% | -28.9% | 11.7% | 55.8 |
| 62 | Harrisburg, PA | 4.2% | -37.3% | 9.9% | 55.6 |
| 63 | Columbia, SC | 4.6% | -21.6% | 12.8% | 55.4 |
| 64 | Tucson, AZ | 3.1% | -29.4% | 11.7% | 55.3 |
| 65 | Cincinnati, OH | 2.5% | -22.2% | 13.3% | 55.2 |
| 66 | Baltimore, MD | 0.6% | -56.0% | 7.1% | 54.9 |
| 67 | Virginia Beach, VA | -2.3% | -35.6% | 12.1% | 54.8 |
| 68 | Ogden, UT | -2.9% | -3.8% | 18.5% | 54.5 |
| 69 | Washington, DC | 0.8% | -44.4% | 8.8% | 53.6 |
| 70 | Indianapolis, IN | 3.3% | -18.4% | 13.1% | 53.5 |
| 71 | Oklahoma City, OK | 2.5% | -21.1% | 12.8% | 53.4 |
| 71 | Madison, WI | 2.8% | -24.1% | 12.1% | 53.4 |
| 73 | Palm Bay, FL | 6.1% | -26.2% | 10.5% | 53.3 |
| 74 | Rochester, NY | -3.6% | -32.0% | 12.6% | 53.2 |
| 75 | Seattle, WA | 3.5% | -20.0% | 12.4% | 52.7 |
| 76 | Philadelphia, PA | 1.4% | -38.3% | 9.4% | 52.6 |
| 76 | Spokane, WA | 3.3% | -17.6% | 12.9% | 52.6 |
| 78 | Atlanta, GA | 5.6% | -17.9% | 11.9% | 52.2 |
| 79 | New York, NY | 0.4% | -43.4% | 8.5% | 52.0 |
| 80 | Tulsa, OK | 2.9% | -22.0% | 11.8% | 51.7 |
| 80 | Stockton, CA | 8.9% | -27.7% | 8.6% | 51.7 |
| 82 | Salt Lake City, UT | 3.6% | -6.9% | 14.5% | 51.6 |
| 82 | Buffalo, NY | -1.0% | -33.3% | 10.8% | 51.6 |
| 84 | Kansas City, MO | 2.1% | -26.8% | 11.0% | 51.5 |
| 85 | Louisville, KY | 6.4% | -9.5% | 12.7% | 50.8 |
| 86 | Tampa, FL | 5.4% | -30.2% | 8.9% | 50.7 |
| 87 | Fayetteville, AR | 8.6% | -17.2% | 10.3% | 50.5 |
| 88 | Baton Rouge, LA | 2.1% | -30.8% | 9.6% | 50.0 |
| 89 | Knoxville, TN | 8.0% | -18.9% | 9.9% | 49.8 |
| 90 | San Francisco, CA | -0.1% | -35.7% | 8.9% | 48.8 |
| 91 | Durham, NC | 0.4% | -26.2% | 10.4% | 48.3 |
| 92 | Scranton, PA | -2.0% | -37.1% | 8.9% | 47.9 |
| 93 | Provo, UT | 7.9% | 12.5% | 15.3% | 47.7 |
| 94 | Worcester, MA | -12.0% | -33.3% | 12.2% | 45.9 |
| 95 | Allentown, PA | 1.9% | -34.4% | 6.9% | 44.9 |
| 96 | Cleveland, OH | 1.1% | -36.2% | 6.4% | 43.9 |
| 97 | Chattanooga, TN | 3.8% | -23.1% | 7.4% | 42.3 |
| 98 | Kiryas Joel, NY | 0.9% | -29.8% | 7.0% | 42.1 |
| 99 | San Jose, CA | 3.4% | -28.0% | 6.3% | 41.6 |
| 100 | New Orleans, LA | -23.0% | -43.5% | 11.4% | 39.8 |
Full rankings: Business and economy
| Rank | Metro | Change in annual GDP | Change in EINs granted | Category score |
|---|---|---|---|---|
| 1 | Austin, TX | 14.6% | 21.7% | 79.3 |
| 2 | Cape Coral, FL | 12.3% | 29.0% | 77.0 |
| 3 | Albuquerque, NM | 6.5% | 52.9% | 75.0 |
| 4 | North Port, FL | 11.8% | 24.5% | 72.5 |
| 5 | San Antonio, TX | 12.0% | 15.4% | 67.1 |
| 6 | Deltona, FL | 11.5% | 14.9% | 65.2 |
| 7 | Tampa, FL | 10.5% | 19.3% | 65.0 |
| 7 | Palm Bay, FL | 10.9% | 17.3% | 65.0 |
| 9 | Orlando, FL | 11.7% | 12.9% | 64.5 |
| 10 | Charleston, SC | 11.9% | 10.5% | 63.5 |
| 11 | Provo, UT | 9.5% | 21.5% | 63.4 |
| 12 | Boise, ID | 10.5% | 16.2% | 63.0 |
| 13 | Colorado Springs, CO | 6.2% | 35.1% | 62.2 |
| 14 | Omaha, NE | 9.4% | 19.5% | 61.8 |
| 15 | Denver, CO | 8.3% | 22.4% | 60.3 |
| 16 | Nashville, TN | 9.2% | 15.9% | 58.8 |
| 17 | Sacramento, CA | 4.4% | 37.9% | 58.6 |
| 17 | Knoxville, TN | 6.3% | 29.1% | 58.6 |
| 19 | Spokane, WA | 6.6% | 27.6% | 58.5 |
| 20 | Raleigh, NC | 9.5% | 14.0% | 58.4 |
| 21 | Jacksonville, FL | 10.9% | 6.2% | 57.6 |
| 22 | Tucson, AZ | 6.1% | 27.7% | 57.0 |
| 23 | Miami, FL | 10.4% | 7.4% | 56.8 |
| 24 | El Paso, TX | 8.1% | 15.6% | 55.2 |
| 25 | Phoenix, AZ | 7.9% | 16.3% | 55.0 |
| 26 | Kansas City, MO | 7.8% | 15.3% | 54.0 |
| 27 | Houston, TX | 9.9% | 4.4% | 53.3 |
| 28 | Ogden, UT | 6.9% | 17.3% | 52.6 |
| 29 | Las Vegas, NV | 9.8% | 2.7% | 51.8 |
| 29 | Bridgeport, CT | 9.5% | 4.0% | 51.8 |
| 31 | Dallas, TX | 9.1% | 5.8% | 51.7 |
| 32 | McAllen, TX | 5.8% | 20.5% | 51.3 |
| 33 | Lakeland, FL | 6.5% | 17.1% | 51.2 |
| 34 | Salt Lake City, UT | 6.0% | 18.7% | 50.7 |
| 35 | Seattle, WA | 8.5% | 6.7% | 50.5 |
| 35 | Albany, NY | 2.6% | 34.2% | 50.5 |
| 37 | Wichita, KS | 5.7% | 18.3% | 49.6 |
| 38 | Greenville, SC | 7.0% | 12.0% | 49.4 |
| 39 | Fayetteville, AR | 5.5% | 17.4% | 48.3 |
| 40 | Charlotte, NC | 8.4% | 3.8% | 48.2 |
| 41 | Chattanooga, TN | 5.0% | 17.0% | 46.5 |
| 42 | Indianapolis, IN | 6.1% | 11.4% | 46.2 |
| 43 | Allentown, PA | 6.0% | 11.5% | 45.9 |
| 44 | Oklahoma City, OK | 6.4% | 8.7% | 45.3 |
| 44 | Durham, NC | 7.0% | 5.8% | 45.3 |
| 46 | Fresno, CA | 3.5% | 19.6% | 43.6 |
| 47 | Tulsa, OK | 5.4% | 9.7% | 42.9 |
| 48 | Honolulu, HI | 5.1% | 9.2% | 41.7 |
| 48 | Madison, WI | 5.5% | 7.4% | 41.7 |
| 50 | San Diego, CA | 4.5% | 11.3% | 41.2 |
| 50 | Portland, OR | 4.1% | 13.1% | 41.2 |
| 52 | Hartford, CT | 5.2% | 7.6% | 40.9 |
| 53 | Louisville, KY | 3.6% | 14.9% | 40.8 |
| 54 | Buffalo, NY | 4.2% | 12.0% | 40.7 |
| 55 | Pittsburgh, PA | 4.2% | 9.8% | 39.3 |
| 56 | Winston-Salem, NC | 3.8% | 10.9% | 38.7 |
| 57 | Scranton, PA | 2.2% | 17.5% | 38.2 |
| 58 | Riverside, CA | 3.1% | 12.7% | 37.8 |
| 59 | Virginia Beach, VA | 5.1% | 3.3% | 37.7 |
| 60 | Harrisburg, PA | 2.4% | 15.6% | 37.6 |
| 61 | Minneapolis, MN | 4.0% | 6.9% | 36.7 |
| 62 | Columbia, SC | 5.4% | -0.3% | 36.3 |
| 63 | San Jose, CA | 2.8% | 11.4% | 36.0 |
| 64 | Boston, MA | 3.9% | 6.0% | 35.8 |
| 65 | Worcester, MA | 2.3% | 13.3% | 35.7 |
| 66 | St. Louis, MO | 5.1% | 0.0% | 35.6 |
| 67 | New York, NY | 3.9% | 5.5% | 35.5 |
| 67 | Grand Rapids, MI | 3.1% | 9.3% | 35.5 |
| 69 | Bakersfield, CA | 1.2% | 17.7% | 35.3 |
| 70 | Washington, DC | 5.1% | -1.2% | 34.8 |
| 71 | Providence, RI | 2.2% | 11.0% | 33.9 |
| 72 | Kiryas Joel, NY | 2.1% | 11.4% | 33.8 |
| 73 | Philadelphia, PA | 4.7% | -1.1% | 33.6 |
| 74 | San Francisco, CA | 2.9% | 5.9% | 32.7 |
| 74 | Dayton, OH | 2.9% | 5.9% | 32.7 |
| 74 | Syracuse, NY | 0.3% | 18.1% | 32.7 |
| 77 | Columbus, OH | 3.1% | 4.7% | 32.5 |
| 78 | Milwaukee, WI | 4.1% | -0.6% | 32.1 |
| 79 | Detroit, MI | 4.9% | -4.8% | 31.7 |
| 80 | Richmond, VA | 3.3% | 2.3% | 31.5 |
| 81 | Los Angeles, CA | 3.2% | 2.5% | 31.3 |
| 81 | Cincinnati, OH | 2.7% | 4.8% | 31.3 |
| 83 | Atlanta, GA | 6.1% | -11.3% | 31.1 |
| 83 | Rochester, NY | 0.3% | 15.7% | 31.1 |
| 83 | Little Rock, AR | 4.7% | -4.8% | 31.1 |
| 86 | Augusta, GA | 2.8% | 3.7% | 30.9 |
| 87 | Des Moines, IA | -0.5% | 18.5% | 30.6 |
| 88 | Birmingham, AL | 3.3% | -0.7% | 29.5 |
| 89 | Greensboro, NC | 3.4% | -1.3% | 29.4 |
| 90 | Stockton, CA | -1.6% | 21.6% | 29.2 |
| 91 | Baltimore, MD | 4.3% | -6.2% | 28.9 |
| 92 | Baton Rouge, LA | 6.0% | -14.8% | 28.5 |
| 92 | Oxnard, CA | 0.8% | 9.4% | 28.5 |
| 94 | Jackson, MS | 4.0% | -7.4% | 27.2 |
| 95 | Toledo, OH | 2.0% | 0.8% | 26.5 |
| 96 | Chicago, IL | 4.0% | -11.4% | 24.6 |
| 97 | Cleveland, OH | 2.7% | -11.8% | 20.3 |
| 98 | Akron, OH | 1.0% | -4.7% | 19.7 |
| 99 | Memphis, TN | 1.7% | -12.7% | 16.6 |
| 100 | New Orleans, LA | 3.6% | -22.3% | 16.1 |
Full rankings: Overall
| Rank | Metro | People and housing | Work and earnings | Business and economy | Final score |
|---|---|---|---|---|---|
| 1 | Austin, TX | 78.1 | 59.0 | 79.3 | 72.1 |
| 2 | Orlando, FL | 70.4 | 81.2 | 64.5 | 72.0 |
| 3 | North Port, FL | 76.7 | 63.6 | 72.5 | 70.9 |
| 4 | Nashville, TN | 69.5 | 80.3 | 58.8 | 69.5 |
| 5 | Cape Coral, FL | 66.2 | 64.2 | 77.0 | 69.1 |
| 6 | Colorado Springs, CO | 72.6 | 70.5 | 62.2 | 68.4 |
| 7 | Charleston, SC | 73.0 | 66.8 | 63.5 | 67.8 |
| 8 | Lakeland, FL | 72.6 | 76.4 | 51.2 | 66.7 |
| 9 | Deltona, FL | 65.7 | 66.1 | 65.2 | 65.7 |
| 10 | Denver, CO | 72.2 | 64.2 | 60.3 | 65.6 |
| 11 | San Antonio, TX | 61.7 | 59.5 | 67.1 | 62.8 |
| 11 | Jacksonville, FL | 69.5 | 61.4 | 57.6 | 62.8 |
| 13 | Raleigh, NC | 65.6 | 63.0 | 58.4 | 62.3 |
| 14 | Boise, ID | 66.9 | 56.1 | 63.0 | 62.0 |
| 15 | Albuquerque, NM | 51.3 | 57.9 | 75.0 | 61.4 |
| 16 | Miami, FL | 52.3 | 74.8 | 56.8 | 61.3 |
| 17 | Provo, UT | 71.9 | 47.7 | 63.4 | 61.0 |
| 18 | Fresno, CA | 70.5 | 67.8 | 43.6 | 60.6 |
| 19 | Dallas, TX | 64.6 | 65.0 | 51.7 | 60.4 |
| 20 | Tampa, FL | 65.3 | 50.7 | 65.0 | 60.3 |
| 21 | Greenville, SC | 65.1 | 64.1 | 49.4 | 59.5 |
| 22 | Palm Bay, FL | 58.6 | 53.3 | 65.0 | 59.0 |
| 23 | Charlotte, NC | 64.1 | 62.9 | 48.2 | 58.4 |
| 24 | Omaha, NE | 55.9 | 57.3 | 61.8 | 58.3 |
| 25 | Houston, TX | 60.0 | 61.0 | 53.3 | 58.1 |
| 26 | Knoxville, TN | 64.8 | 49.8 | 58.6 | 57.7 |
| 27 | Sacramento, CA | 53.9 | 58.8 | 58.6 | 57.1 |
| 28 | Phoenix, AZ | 53.8 | 62.3 | 55.0 | 57.0 |
| 28 | Las Vegas, NV | 52.9 | 66.2 | 51.8 | 57.0 |
| 30 | Tucson, AZ | 56.7 | 55.3 | 57.0 | 56.3 |
| 31 | Albany, NY | 58.1 | 60.0 | 50.5 | 56.2 |
| 32 | Fayetteville, AR | 69.1 | 50.5 | 48.3 | 56.0 |
| 33 | Bridgeport, CT | 50.7 | 63.5 | 51.8 | 55.3 |
| 34 | Honolulu, HI | 51.7 | 71.8 | 41.7 | 55.1 |
| 35 | Spokane, WA | 53.6 | 52.6 | 58.5 | 54.9 |
| 35 | Richmond, VA | 69.1 | 64.0 | 31.5 | 54.9 |
| 37 | Grand Rapids, MI | 63.1 | 65.2 | 35.5 | 54.6 |
| 38 | San Diego, CA | 48.9 | 73.5 | 41.2 | 54.5 |
| 39 | Oklahoma City, OK | 63.1 | 53.4 | 45.3 | 53.9 |
| 40 | Seattle, WA | 58.1 | 52.7 | 50.5 | 53.8 |
| 41 | Kansas City, MO | 55.2 | 51.5 | 54.0 | 53.6 |
| 42 | McAllen, TX | 43.0 | 66.2 | 51.3 | 53.5 |
| 43 | Virginia Beach, VA | 67.8 | 54.8 | 37.7 | 53.4 |
| 44 | El Paso, TX | 45.4 | 59.1 | 55.2 | 53.2 |
| 44 | Winston-Salem, NC | 56.1 | 64.9 | 38.7 | 53.2 |
| 46 | Portland, OR | 58.6 | 59.5 | 41.2 | 53.1 |
| 47 | Columbia, SC | 67.2 | 55.4 | 36.3 | 53.0 |
| 48 | Madison, WI | 63.2 | 53.4 | 41.7 | 52.8 |
| 49 | Providence, RI | 49.0 | 74.6 | 33.9 | 52.5 |
| 50 | Wichita, KS | 49.7 | 56.1 | 49.6 | 51.8 |
| 50 | Salt Lake City, UT | 53.2 | 51.6 | 50.7 | 51.8 |
| 52 | Indianapolis, IN | 55.5 | 53.5 | 46.2 | 51.7 |
| 53 | Boston, MA | 55.9 | 63.0 | 35.8 | 51.6 |
| 54 | Durham, NC | 60.8 | 48.3 | 45.3 | 51.5 |
| 55 | Birmingham, AL | 60.4 | 63.6 | 29.5 | 51.2 |
| 56 | Louisville, KY | 60.7 | 50.8 | 40.8 | 50.8 |
| 57 | Greensboro, NC | 55.7 | 66.0 | 29.4 | 50.4 |
| 58 | Harrisburg, PA | 57.7 | 55.6 | 37.6 | 50.3 |
| 58 | Tulsa, OK | 56.3 | 51.7 | 42.9 | 50.3 |
| 58 | Augusta, GA | 63.4 | 56.5 | 30.9 | 50.3 |
| 61 | Chattanooga, TN | 61.8 | 42.3 | 46.5 | 50.2 |
| 62 | Minneapolis, MN | 57.9 | 55.8 | 36.7 | 50.1 |
| 63 | Washington, DC | 59.4 | 53.6 | 34.8 | 49.3 |
| 64 | Atlanta, GA | 64.1 | 52.2 | 31.1 | 49.1 |
| 65 | Riverside, CA | 47.3 | 61.0 | 37.8 | 48.7 |
| 66 | Columbus, OH | 55.4 | 58.0 | 32.5 | 48.6 |
| 67 | Jackson, MS | 58.5 | 59.8 | 27.2 | 48.5 |
| 67 | Dayton, OH | 55.1 | 57.8 | 32.7 | 48.5 |
| 67 | Des Moines, IA | 59.1 | 55.8 | 30.6 | 48.5 |
| 67 | Milwaukee, WI | 45.9 | 67.4 | 32.1 | 48.5 |
| 67 | Ogden, UT | 38.3 | 54.5 | 52.6 | 48.5 |
| 72 | Pittsburgh, PA | 49.9 | 55.9 | 39.3 | 48.4 |
| 73 | Hartford, CT | 41.5 | 62.5 | 40.9 | 48.3 |
| 74 | Bakersfield, CA | 40.6 | 68.1 | 35.3 | 48.0 |
| 75 | Little Rock, AR | 54.5 | 58.0 | 31.1 | 47.9 |
| 76 | Syracuse, NY | 53.1 | 56.4 | 32.7 | 47.4 |
| 77 | St. Louis, MO | 48.5 | 57.8 | 35.6 | 47.3 |
| 78 | Allentown, PA | 49.1 | 44.9 | 45.9 | 46.6 |
| 79 | Cincinnati, OH | 52.2 | 55.2 | 31.3 | 46.2 |
| 80 | Oxnard, CA | 43.4 | 65.0 | 28.5 | 45.6 |
| 81 | Baltimore, MD | 52.8 | 54.9 | 28.9 | 45.5 |
| 81 | Philadelphia, PA | 50.2 | 52.6 | 33.6 | 45.5 |
| 83 | Scranton, PA | 50.2 | 47.9 | 38.2 | 45.4 |
| 84 | Los Angeles, CA | 40.0 | 63.9 | 31.3 | 45.1 |
| 85 | San Francisco, CA | 52.8 | 48.8 | 32.7 | 44.8 |
| 85 | Buffalo, NY | 42.1 | 51.6 | 40.7 | 44.8 |
| 87 | Detroit, MI | 44.5 | 57.6 | 31.7 | 44.6 |
| 88 | Stockton, CA | 52.5 | 51.7 | 29.2 | 44.5 |
| 89 | New York, NY | 45.6 | 52.0 | 35.5 | 44.4 |
| 90 | Akron, OH | 51.0 | 61.9 | 19.7 | 44.2 |
| 91 | Baton Rouge, LA | 53.1 | 50.0 | 28.5 | 43.9 |
| 92 | San Jose, CA | 53.9 | 41.6 | 36.0 | 43.8 |
| 93 | Rochester, NY | 45.3 | 53.2 | 31.1 | 43.2 |
| 94 | Chicago, IL | 42.1 | 62.6 | 24.6 | 43.1 |
| 95 | Memphis, TN | 48.1 | 61.7 | 16.6 | 42.1 |
| 96 | Kiryas Joel, NY | 49.9 | 42.1 | 33.8 | 41.9 |
| 97 | Toledo, OH | 33.3 | 59.0 | 26.5 | 39.6 |
| 98 | Worcester, MA | 29.0 | 45.9 | 35.7 | 36.9 |
| 99 | Cleveland, OH | 44.3 | 43.9 | 20.3 | 36.2 |
| 100 | New Orleans, LA | 10.1 | 39.8 | 16.1 | 22.0 |
How to grow in your metro: Top small business tips
No matter if your small business is in a top boomtown or a metro that’s lower on the list, there are always things you can do to grow your business. Here are some strategies all small business owners can use — regardless of their metro’s current climate:
- Network, network, network. Booming metros will have plenty of organizations geared toward helping small business owners connect with other entrepreneurs. Googling “small business networking resources in my area” is a good place to start, whether you’re looking for partnerships, funding, training or most anything else to do with running a business.
- Think local. A booming area is a rapidly changing area. Making the effort to understand how your business can better serve the needs of the community as it grows and changes can help you uncover opportunities that you may never have expected.
- Focus on customers’ needs. Sounds super basic, right? But the truth is, the company that best meets customers’ needs often wins. In the day-to-day flurry of expenses and spreadsheets, it can be easy to forget this core truth. But, sometimes, the best way to differentiate your business from the competition is to provide the best service.
- Search for grants. Corporate and government entities offer an array of small business grants. The best part? The funds don’t have to be repaid. Each has its own application requirements, and some are for specific types of businesses, but the right ones can be a helpful resource for small business owners.
- Explore other funding options. If you need capital to help your business grow, be sure you understand your options. Some possibilities may include taking out a small business loan or opening a business credit card. Some businesses also turn to crowdfunding.
Methodology
LendingTree analysts ranked and scored the 100 largest metros across eight unique metrics. The eight metrics were grouped into three categories, which were scored according to their equally weighted component metric scores. These three category scores were then averaged (equal weight) for the final score for each metro.
The categories and component metrics are:
People and housing
- Population growth between 2021 and 2023. (U.S. Census Bureau 2021 and 2023 American Community Survey — ACS — with one-year estimates)
- Percentage of the 2023 population who moved from another county, state or country in the prior two years. Some metros cover multiple counties and states. (Census Bureau 2022 and 2023 ACS with one-year estimates)
- Change in housing units between 2021 and 2023. (Census Bureau 2021 and 2023 ACS with one-year estimates)
Work and earnings
- Change in the number of people active in the workforce between 2021 and 2023. (Census Bureau 2021 and 2023 ACS with one-year estimates)
- Change in unemployment rates from annual averages for 2021 and 2023. (U.S. Bureau of Labor Statistics — BLS — Local Area Unemployment Statistics)
- Change in median earnings between 2021 and 2023. (Census Bureau 2021 and 2023 ACS with one-year estimates)
Business and economy
- Change in the annual GDP between 2021 and 2023. (U.S. Bureau of Economic Analysis — BEA)
- Number of employer identification numbers (EINs) applied for in 2022 and 2023 compared to the number applied for in 2020 and 2021. (Census Bureau Business Formation Statistics, mapped to metros using Census Bureau delineation files)
Each metric was scored according to its distance from the lowest and highest values, with the highest value earning a score of 100 and the lowest a score of zero. These were then averaged at the category level, and that value was also scored according to its distance from the lowest and highest values, with the highest earning a score of 100 and the lowest a score of zero.
These categorical scores were then averaged for the final scores. The highest possible score was 100 and the lowest possible was zero.
Compare business loan offers