Post-Holiday Retail Spending Falls Average of 22.4%, but Declines Getting Smaller in 2020s


Many businesses, especially retail, eagerly await the rush at year’s end that can boost annual revenue. But the pendulum quickly oscillates the other way, too, with a post-holiday slump that business owners know by now to expect.
According to a LendingTree study, retail industry spending drops an average of 22.4% between December and January — though the drop has been getting smaller lately. Our analysis, which reaches back to 1992, finds that five of the six smallest post-holiday retail spending declines have been in the 2020s.
Here’s what we found.
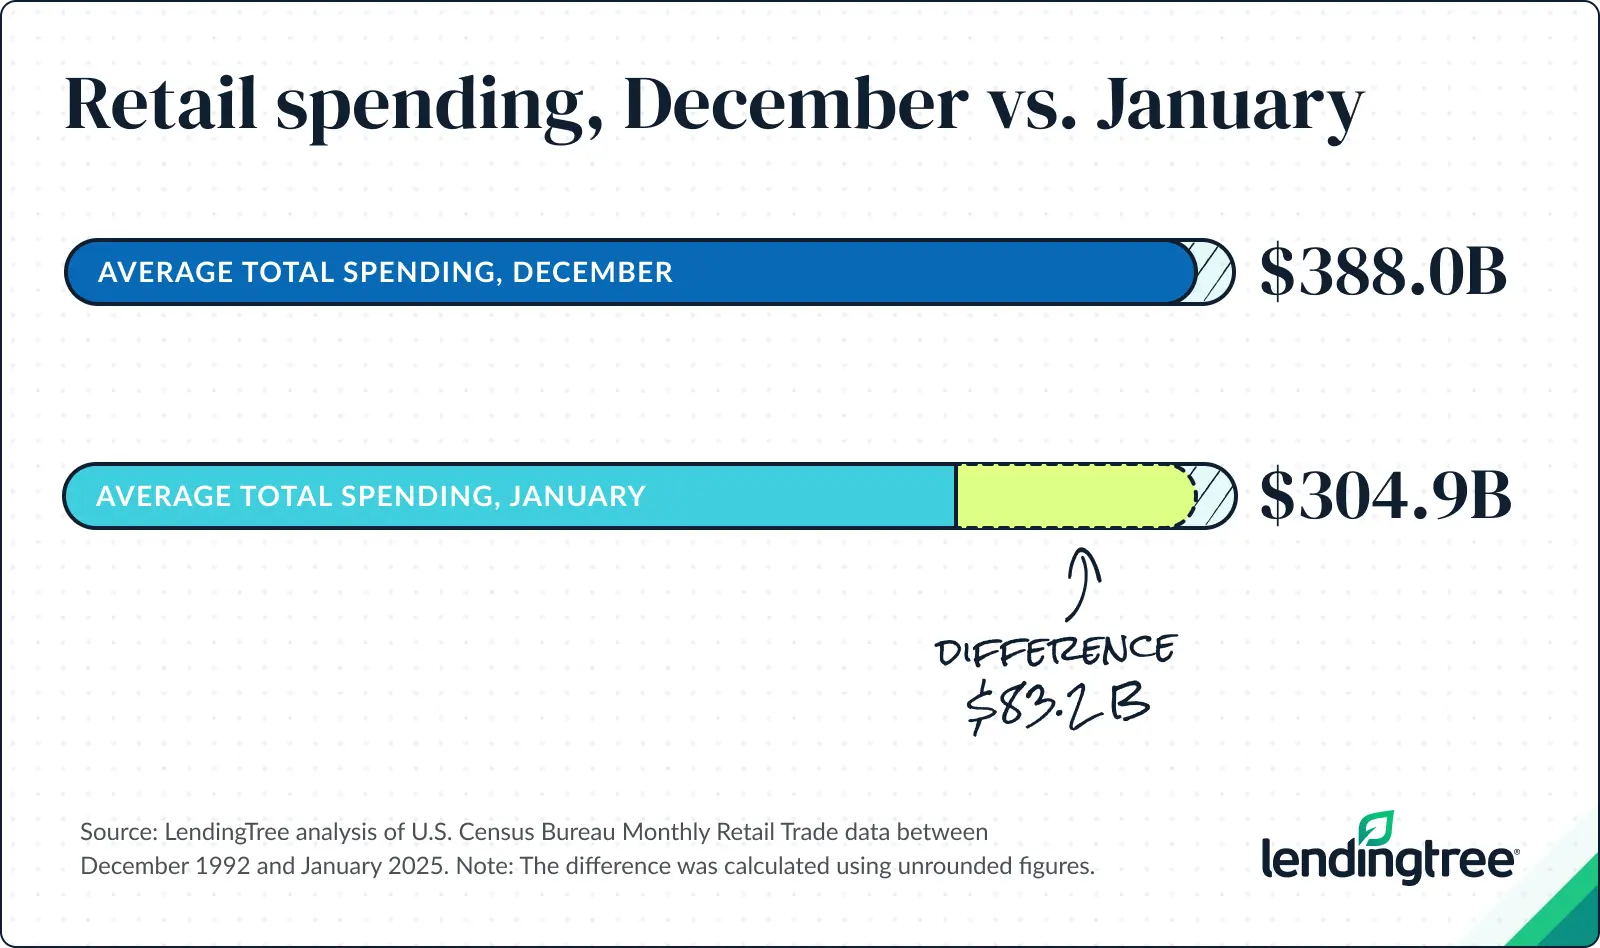
- On average, retail spending drops 22.4% between December and January. In the period spanning from December 1992 to January 2025, consumers spent an average of $304.9 billion in total each January, versus $388.0 billion in December. That’s an average decline of $83.2 billion a year.
- Despite this significant average decline, post-holiday retail spending doesn’t drop as much as it did in the past. Across the years analyzed, five of the six smallest post-holiday retail spending declines have been in the 2020s. Retail spending fell just 16.0% between December 2022 and January 2023 — the smallest drop.
- Among the retail subsectors, department stores experience the steepest post-holiday drop. Department store spending fell an average of 58.0% annually between December (starting in 1992) and January (ending in 2025). Clothing stores (55.3%) and sporting goods, hobby, musical instrument and book stores (45.5%) follow.
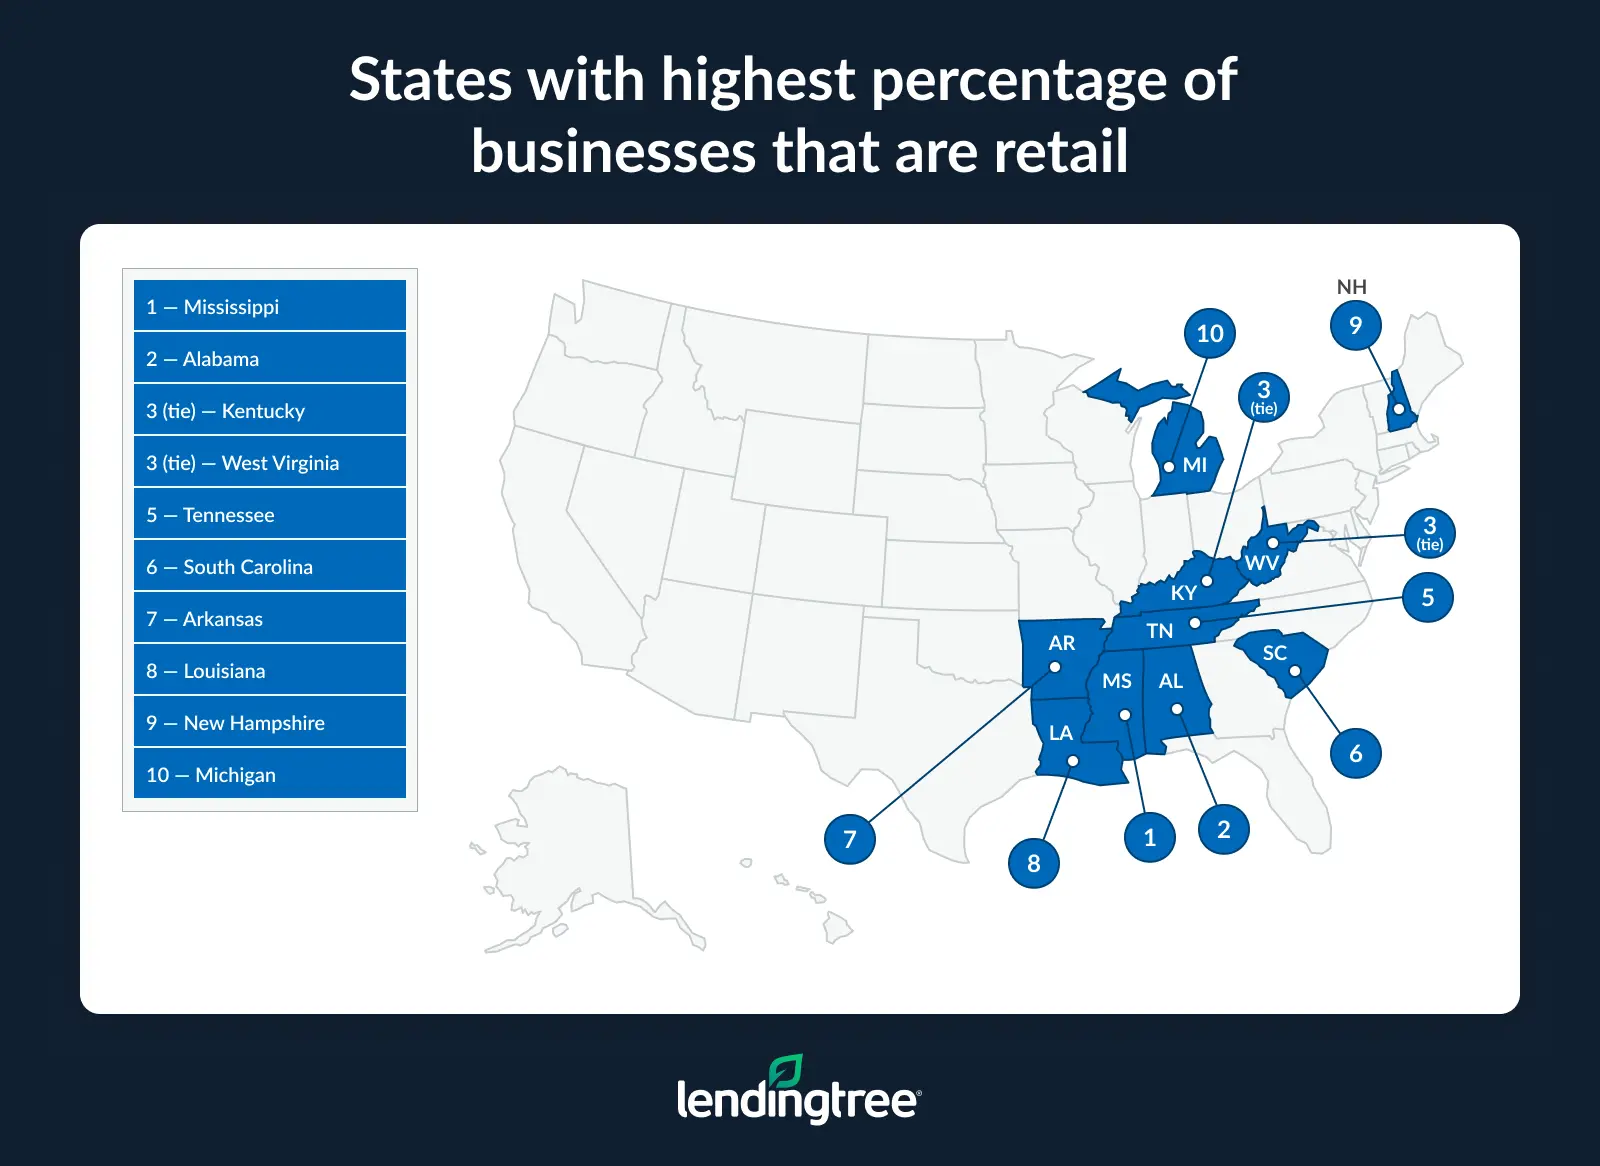
- Post-holiday slowdowns are especially painful for Mississippi businesses, where 18.7% of establishments are retail. That’s the highest by state, ahead of Alabama (16.9%) and Kentucky and West Virginia (both 15.9%). Conversely, the District of Columbia (6.9%) has the lowest rate of businesses in retail, followed by Washington and Colorado, both at 10.2%.
- The spending decline extends beyond brick-and-mortar stores. E-commerce, which represents a growing share of total retail sales, saw a 20.3% drop in spending between the fourth quarter of 2024 and the first quarter of 2025. E-commerce now makes up 17.8% of fourth-quarter retail spending, compared with just 1.2% in 2000.
Post-holiday retail spending drops 22.4%
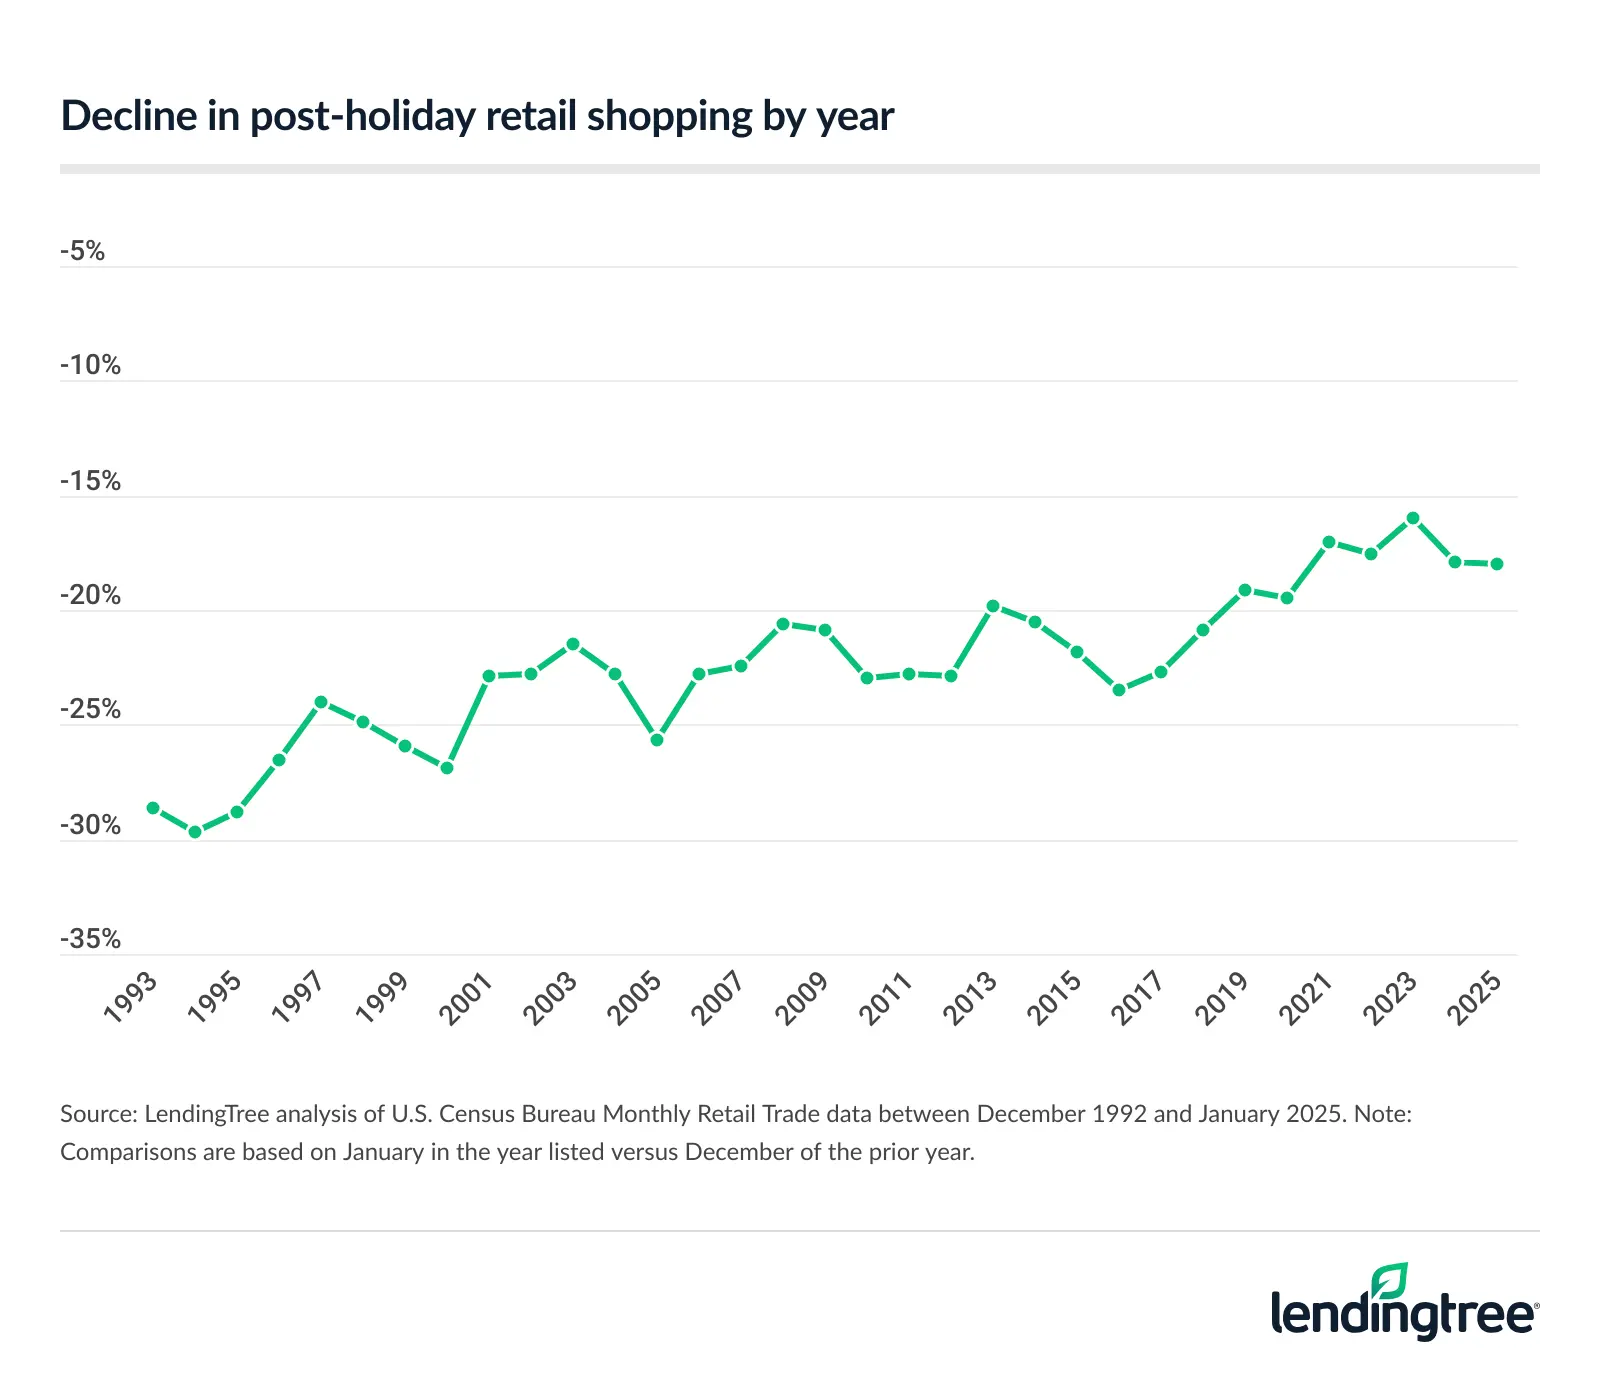
In the years between December 1992 and January 2025, our analysis finds that retail spending dropped an average of 22.4% between December and January — the well-known post-holiday slump.
However, five of the six years in which it’s dropped the least are in the 2020s: 2021 (when spending between the two months dropped 17.0%), 2022 (17.6%), 2023 (16.0%), 2024 (17.9%) and 2025 (18.0%). The other lowest drop was not too long ago in 2019, when spending dropped 19.1%.
The post-holiday retail slump was considerably more robust in the early 1990s. The analyzed year with the biggest drop was 1994, when spending fell 29.7%. In all the years of the 1990s that we studied, the slump was at least 24.0%. Now, in 2025, we haven’t seen a slump that big since 2005 — a full 20 years.
The change, says Matt Schulz, LendingTree chief consumer finance analyst and author of “Ask Questions, Save Money, Make More: How to Take Control of Your Financial Life,” likely has something to do with the rise of online shopping.
“Banks, retailers and tech companies have done an amazing job of making it as easy as possible to buy whatever you want whenever and however you want,” he explains. “That sort of ease of purchasing gives people a lot more options than they used to have.”
Maybe you didn’t get what you wanted as a holiday gift after all — so you simply get online, add it to your cart and it arrives at your door a few days later.
“That’s not just good for consumers,” Schulz says. “It’s also good for businesses because it means that the success of their business isn’t as completely dependent on the holiday season as it used to be.”
Department stores take biggest post-holiday hit
While the retail sector as a whole is hit by the post-holiday spending drop, the impact varies by subsectors.
Specifically, department stores bear the brunt of the January slump, with spending falling an average of 58.0% annually over the years we analyzed. Other heavily impacted subsectors include clothing stores (where spending dropped an average of 55.3% during the studied time frame), sporting goods and hobby stores selling items like musical instruments and books (45.5%), general merchandise stores (40.1%) and electronics stores (39.2%).
Retail subsectors that see biggest post-holiday spending declines
| Retail subsector | % decline in retail spending between December, January |
|---|---|
| Department stores | -58.0% |
| Clothing stores | -55.3% |
| Sporting goods, hobby, musical instrument and book stores | -45.5% |
| General merchandise | -40.1% |
| Electronics stores | -39.2% |
| Miscellaneous retail | -26.0% |
| Nonstore retail | -23.5% |
| Furniture stores | -21.9% |
| Health and personal care stores | -12.9% |
| Food and beverage stores | -10.3% |
| Food service and drinking | -7.7% |
| Motor vehicle and parts dealers | -7.0% |
| Grocery stores | -6.5% |
| Gas stations | -4.0% |
Meanwhile, some retail subsectors see lower-than-average post-holiday slumps — namely gas stations (where spending drops only 4.0%), grocery stores (6.5%), motor vehicle and parts dealers (7.0%), and food service and drinking establishments (7.7%). (Many of these make intuitive sense: Most people don’t give each other gasoline or groceries as Christmas presents.)
For the most heavily hit subsectors, of course, these post-holiday spending drops “are a big deal,” Schulz agrees. But they aren’t insurmountable.
If the drops are “somewhat predictable and consistent over the years,” Schulz goes on, “businesses can adjust. Many, many businesses see seasonal ups and downs, which can be especially scary and challenging for new businesses. However, with some careful planning, data analysis and forethought, businesses can learn how to ride out the seasonal lows, make the most out of the seasonal highs and stay successful during the in-between times.”
Mississippi has largest share of businesses that are retail
While retail accounts for at least 10.0% of business establishments in every state but one (more on that soon), Mississippi has the largest share of retail businesses (18.7%), making it particularly vulnerable to the post-holiday shopping slump.
The state with the next-highest proportion of retail businesses is Alabama (16.9%), followed by Kentucky and West Virginia (which tie for 15.9%). In fact, eight of the 10 states that lead in this regard are in the South — a region that already experiences higher amounts of poverty and lower rates of economic mobility.
Compounding the painful effects, many of these states also have a relatively high proportion of employees who work in retail. In fact, in Mississippi, 14.3% of the workforce is in retail, compared with the national average of 12.4%. (Note that this average excludes the District of Columbia, where only 3.8% of the workforce is employed in retail establishments.)
The same holds true in Alabama, where 13.1% of employees are in retail, as well as in other states topping the list, like Kentucky (12.6%), West Virginia (14.1%), South Carolina (13.0%), Arkansas (12.9%), Louisiana (13.1%) and New Hampshire (15.2%). (In Maine, the state with the highest proportion of employees in retail, 15.5% of the workforce works in the sector, though only 13.9% of its business establishments are retail, the 13th-highest rate in the nation.)
Conversely, the District of Columbia has both the lowest rate of businesses in retail (6.9%) and the smallest share of employees therein (3.8%). Washington State and Colorado follow, tied for a percentage of retail businesses at 10.2%; in both states, the number of employees in retail is lower than the national average.
“Struggling businesses can hit a state hard,” Schulz says. “When businesses fail or have to cut employees during slow times, it can have a ripple effect through the state and local economy because people who are nervous about their jobs don’t tend to spend freely.” That’s a trend that’s likely to hurt doubly in states that are already economically struggling — like Mississippi, which has one of the highest poverty rates in the country.
Full rankings: States with highest percentage of businesses that are retail
| Rank | State | % of businesses that are retail | % of employees that work in retail |
|---|---|---|---|
| 1 | Mississippi | 18.7% | 14.3% |
| 2 | Alabama | 16.9% | 13.1% |
| 3 | Kentucky | 15.9% | 12.6% |
| 3 | West Virginia | 15.9% | 14.1% |
| 5 | Tennessee | 15.6% | 11.8% |
| 6 | South Carolina | 15.2% | 13.0% |
| 7 | Arkansas | 15.0% | 12.9% |
| 8 | Louisiana | 14.6% | 13.1% |
| 9 | New Hampshire | 14.5% | 15.2% |
| 10 | Michigan | 14.3% | 11.5% |
| 11 | New Mexico | 14.2% | 14.5% |
| 12 | Vermont | 14.1% | 14.6% |
| 13 | Maine | 13.9% | 15.5% |
| 14 | North Carolina | 13.8% | 12.5% |
| 15 | Georgia | 13.7% | 11.7% |
| 16 | Oklahoma | 13.6% | 13.2% |
| 17 | Indiana | 13.5% | 11.5% |
| 18 | Ohio | 13.4% | 11.0% |
| 18 | Hawaii | 13.4% | 12.6% |
| 20 | New York | 13.3% | 9.8% |
| 21 | South Dakota | 13.2% | 14.3% |
| 21 | Missouri | 13.2% | 11.9% |
| 21 | Iowa | 13.2% | 13.2% |
| 24 | Connecticut | 13.1% | 11.8% |
| 24 | Pennsylvania | 13.1% | 11.4% |
| 26 | Delaware | 12.6% | 13.6% |
| 26 | Kansas | 12.6% | 11.6% |
| 26 | Texas | 12.6% | 11.5% |
| 29 | New Jersey | 12.5% | 11.8% |
| 29 | Wisconsin | 12.5% | 11.8% |
| 31 | Massachusetts | 12.3% | 10.3% |
| 31 | Virginia | 12.3% | 11.8% |
| 31 | Nebraska | 12.3% | 11.9% |
| 34 | North Dakota | 12.2% | 13.0% |
| 35 | Rhode Island | 12.1% | 11.2% |
| 36 | Florida | 11.8% | 11.5% |
| 37 | Nevada | 11.7% | 12.3% |
| 37 | Maryland | 11.7% | 11.7% |
| 39 | Minnesota | 11.5% | 10.9% |
| 40 | Oregon | 11.3% | 12.7% |
| 41 | Wyoming | 11.2% | 15.1% |
| 42 | Illinois | 11.1% | 10.1% |
| 42 | Montana | 11.1% | 15.4% |
| 44 | Arizona | 11.0% | 12.4% |
| 45 | Alaska | 10.9% | 12.9% |
| 46 | Idaho | 10.8% | 13.3% |
| 46 | Utah | 10.8% | 11.3% |
| 48 | California | 10.4% | 10.4% |
| 49 | Colorado | 10.2% | 11.4% |
| 49 | Washington | 10.2% | 11.1% |
| 51 | District of Columbia | 6.9% | 3.8% |
E-commerce sees a significant decline in quarterly spending
Although e-commerce has likely been part of the reason behind the decreasing steepness of the post-holiday spending slump, as discussed above, it’s true that spending declines persist even in cyberspace. Quarterly e-commerce saw a 20.3% decrease in spending between the fourth quarter of 2024 and the first quarter of 2025 — and there was a decline in every Q1 studied with the exception of the year 2000. (Note: This part of our study highlights quarterly, rather than monthly, data.)
Still, e-commerce makes up an increasingly large portion of overall retail spending, especially in the fourth quarter. In 2024, e-commerce accounted for 17.8% of Q4 retail spending, compared with just 1.2% of such spending in 2000.
Note: For our purposes, e-commerce refers to negotiations in which goods and services are ordered by the buyer over an Internet, extranet, Electronic Data Interchange (EDI) network, electronic mail or other online system. Payments don’t necessarily need to be made online.
Buckling up for post-holiday retail slump: Top tips for businesses
As Schulz points out above, fluctuations in business can be challenging, but they can also be overcome. If you have a retail business of your own (or are considering starting one up), here are our top expert tips for surviving the trough that follows the holiday retail spending wave:
- Build seasonality into your business plan. “If you know that the spring is slow, for example, you can adjust your spending during that time to help your business’s bottom line,” Schulz points out. At the other end of the equation, consider ramping up marketing spend or hiring to address extra demand (and maximize sales) during busy times of year, like the holidays. In any case, stay agile: “Businesses are living, breathing things,” Schulz warns. “Those who can’t adjust and adapt won’t survive.”
- Let the data guide you. “You can’t make smart decisions about your business if you don’t know how much is coming in and going out of it each month,” Schulz says. “That can be challenging to get a handle on in the early days of your business, but even then, you can research your industry and your competitors and try to make some educated guesses.”
- Get creative. “Yes, customers are creatures of habit and seasonality is a very real thing,” Schulz admits. “However, you have more power over your business than you think, and a little creativity can go a long way.” Examples he offers include working with other businesses or organizations in your area to create an event to generate buzz and extra sales, like Amazon Prime Day. “It’s an event that never existed until someone on that team came up with it and put the site’s marketing muscle behind it as a way to drum up sales during a slow period of the year,” he points out. While, obviously, being one of the biggest websites in the world can help such an effort succeed, similar creative moves can still make a big difference on a smaller scale: Small Business Saturday is another example that leverages customers’ desire to shop local.
- Don’t forget about small business loans. Obviously, staying in debt long-term could hurt your business — but when used in an intelligent way (such as when put toward marketing that generates sustainable sales), even a small loan can go a long way toward helping your business succeed.
Methodology
To estimate how much retail spending declines between December and January, LendingTree researchers analyzed U.S. Census Bureau Monthly Retail Trade data. Researchers analyzed December 1992 to January 2025, comparing monthly retail spending figures from December and January.
Separately, using U.S. Census Bureau 2023 County Business Patterns survey data, states were ranked based on the percentage of establishments in each state that fall in the retail sector.
Lastly, using U.S. Census Bureau Retail Indicators Branch data, researchers determined how much e-commerce spending changed by quarter from the first quarter of 1999 through the second quarter of 2025. We focused on comparing the last quarter of a year to the first quarter of the next year.
Compare business loan offers