A Growing Presence, a Persistent Gap: Women in US Business Ownership


Starting a business is hard no matter who you are, but the odds aren’t evenly stacked. Women are still significantly less likely than men to own a business. And when they do, those businesses tend to be smaller.
Here’s a closer look at where women-owned businesses are most common, and what those businesses look like.
- Women are less likely than men to own businesses — and they also tend to run smaller ones. Women own just 22.9% of employer businesses nationally, compared with 61.3% for men. On average, women-owned businesses have a revenue of $1.7 million. That compares to an average of $4.1 million among male-owned businesses.
- The share of women-owned businesses has risen. 22.9% of businesses were women-owned in 2023, up from 20.0% in 2017. Comparatively, the share of men-owned businesses grew slightly from 61.0% to 61.3% in the same period.
- Female entrepreneurs are most common in the health care and social assistance industry. Women own 36.5% of businesses in the industry. Educational services (29.4%) and real estate and rental and leasing (27.8%) notably follow.
- By state, Alaska has the highest share of women-owned businesses. There, 27.2% of businesses are women-owned. Virginia (25.3%) and Colorado (25.2%) follow. Conversely, just 15.9% of businesses in South Dakota are owned by women, with New Hampshire (16.8%) and Delaware (17.8%) rounding out the bottom three.
- By metro, Durham, N.C., has the highest share of female entrepreneurs. 28.0% of businesses there are owned by women. Anchorage, Alaska (27.9%), and Albuquerque, N.M. (26.7%), follow. Meanwhile, Provo, Utah (14.6%), Worcester, Mass. (16.9%), and Knoxville, Tenn. (17.0%), have the smallest share of businesses owned by women.
Women own a smaller share of businesses than men
Nationally, women own just 22.9% of employer businesses. Men own a significant 61.3%, while 11.9% are owned equally by women and men.
Breakdown of American businesses by gender
| Metric | Total | Women-owned | Men-owned | Equally men-owned and women-owned |
|---|---|---|---|---|
| # of firms | 5,934,950 | 1,356,990 | 3,638,693 | 707,385 |
| % of total businesses | N/A | 22.9% | 61.3% | 11.9% |
| Receipts ($1,000s) | $48.2 trillion | $2.3 trillion | $14.8 trillion | $1.4 trillion |
| Avg. receipts | $8.1 million | $1.7 million | $4.1 million | $2.0 million |
| Employees | 132,849,544 | 11,686,613 | 47,513,554 | 6,904,769 |
| Avg. # of employees | 22.4 | 8.6 | 13.1 | 9.8 |
| Annual payroll ($1,000s) | $8.9 trillion | $522.5 billion | $2.8 trillion | $299.9 billion |
| Avg. payroll | $1.5 million | $385,047 | $775,596 | $423,905 |
It’s not just that women own a smaller share of businesses — the businesses they do own are also less profitable. Women-owned businesses have an average revenue of $1.7 million and employ 8.6 people on average. Comparatively, male-owned businesses have an average revenue of $4.1 million and employ 13.1 people on average.
The share of women-owned businesses has risen
While men may dominate the small business world, women are catching up. Compared to the 20.0% of businesses that were women-owned in 2017, 22.9% were owned by women in 2023. The number of women-owned businesses increased by 19.6% during this period.
Business growth by ownership gender, 2017-23
| Ownership gender | # of firms owned, 2017 | % of firms owned, 2017 | # of firms owned, 2023 | % of firms owned, 2023 | Growth, 2017-23 |
|---|---|---|---|---|---|
| Total | 5,744,643 | N/A | 5,934,950 | N/A | 3.3% |
| Women-owned | 1,134,549 | 20.0% | 1,356,990 | 22.9% | 19.6% |
| Men-owned | 3,480,438 | 61.0% | 3,638,693 | 61.3% | 4.5% |
| Equally men-owned and women-owned | 859,735 | 15.0% | 707,385 | 11.9% | -17.7% |
Meanwhile, the share of men-owned businesses grew from 61.0% to 61.3% in the same period. The number of men-owned businesses increased by just 4.5%. However, businesses equally owned by both genders fell 17.7%.
Matt Schulz, LendingTree chief consumer finance analyst and author of “Ask Questions, Save Money, Make More: How to Take Control of Your Financial Life,” says that some of the growth among women-owned businesses is happening out of necessity.
“Women tend to earn less than men, and starting a small business can be a smart way to attempt to bridge that gap,” he says. “Owning your own business can also give you more flexibility to control your schedule while you’re building financial security on your own terms.”
Another factor that may contribute to the rise in women-owned businesses is improvements in technology, Schulz says. “Technology has made it easier, faster and cheaper than ever before for anyone to start a business,” he says. “The reduced costs are especially important for female entrepreneurs, who, unfortunately, tend to have less access to capital than men.”
Which industries have the highest share of women-owned businesses?
When it comes to the industries in which women are most likely to own businesses, the health care and social assistance industry ranks first. In this industry, women own 36.5% of businesses.
Industries where women own the highest share of businesses
| Industry | Total firms | Women-owned firms | Men-owned firms | % women-owned |
|---|---|---|---|---|
| Health care and social assistance | 683,909 | 249,546 | 307,442 | 36.5% |
| Other services (except public administration) | 410,671 | 133,005 | 215,405 | 32.4% |
| Industries not classified | 6,798 | 2,100 | 4,068 | 30.9% |
| Educational services | 102,149 | 30,066 | 29,933 | 29.4% |
| Real estate and rental and leasing | 352,783 | 98,065 | 185,605 | 27.8% |
| Professional, scientific and technical services | 857,978 | 224,886 | 538,941 | 26.2% |
| Accommodation and food services | 563,147 | 130,809 | 328,966 | 23.2% |
| Administrative and support and waste management and remediation services | 369,239 | 79,487 | 235,073 | 21.5% |
| Arts, entertainment and recreation | 146,468 | 30,119 | 71,025 | 20.6% |
| Finance and insurance | 230,302 | 43,991 | 156,445 | 19.1% |
| Information | 81,266 | 13,783 | 51,348 | 17.0% |
| Wholesale trade | 274,582 | 41,036 | 192,927 | 14.9% |
| Agriculture, forestry, fishing and hunting | 21,059 | 2,710 | 14,380 | 12.9% |
| Mining, quarrying and oil and gas extraction | 16,698 | 1,997 | 11,541 | 12.0% |
| Management of companies and enterprises | 23,323 | 2,554 | 10,832 | 11.0% |
| Construction | 774,636 | 67,503 | 617,311 | 8.7% |
| Utilities | 6,850 | 554 | 2,873 | 8.1% |
Other notable industries for female entrepreneurs include educational services (29.4%) and real estate and rental and leasing (27.8%).
Schulz says one simple reason why women are most represented as business owners in these industries today is that these have long been industries seen as acceptable for women to take on. “Women have been teachers or nurses or taken on other such roles in these industries for generations, meaning that there are likely fewer barriers to entry in those industries than there are in more traditionally male-dominated fields,” he says.
On the other hand, women own a smaller share of businesses operating in utilities (8.1%), construction (8.7%) and the management of companies and enterprises (11.0%).
Alaska has the highest share of female entrepreneurs
By state, Alaska has the highest share of women-owned businesses, at 27.2%. It’s followed by Virginia (25.3%) and Colorado (25.2%).
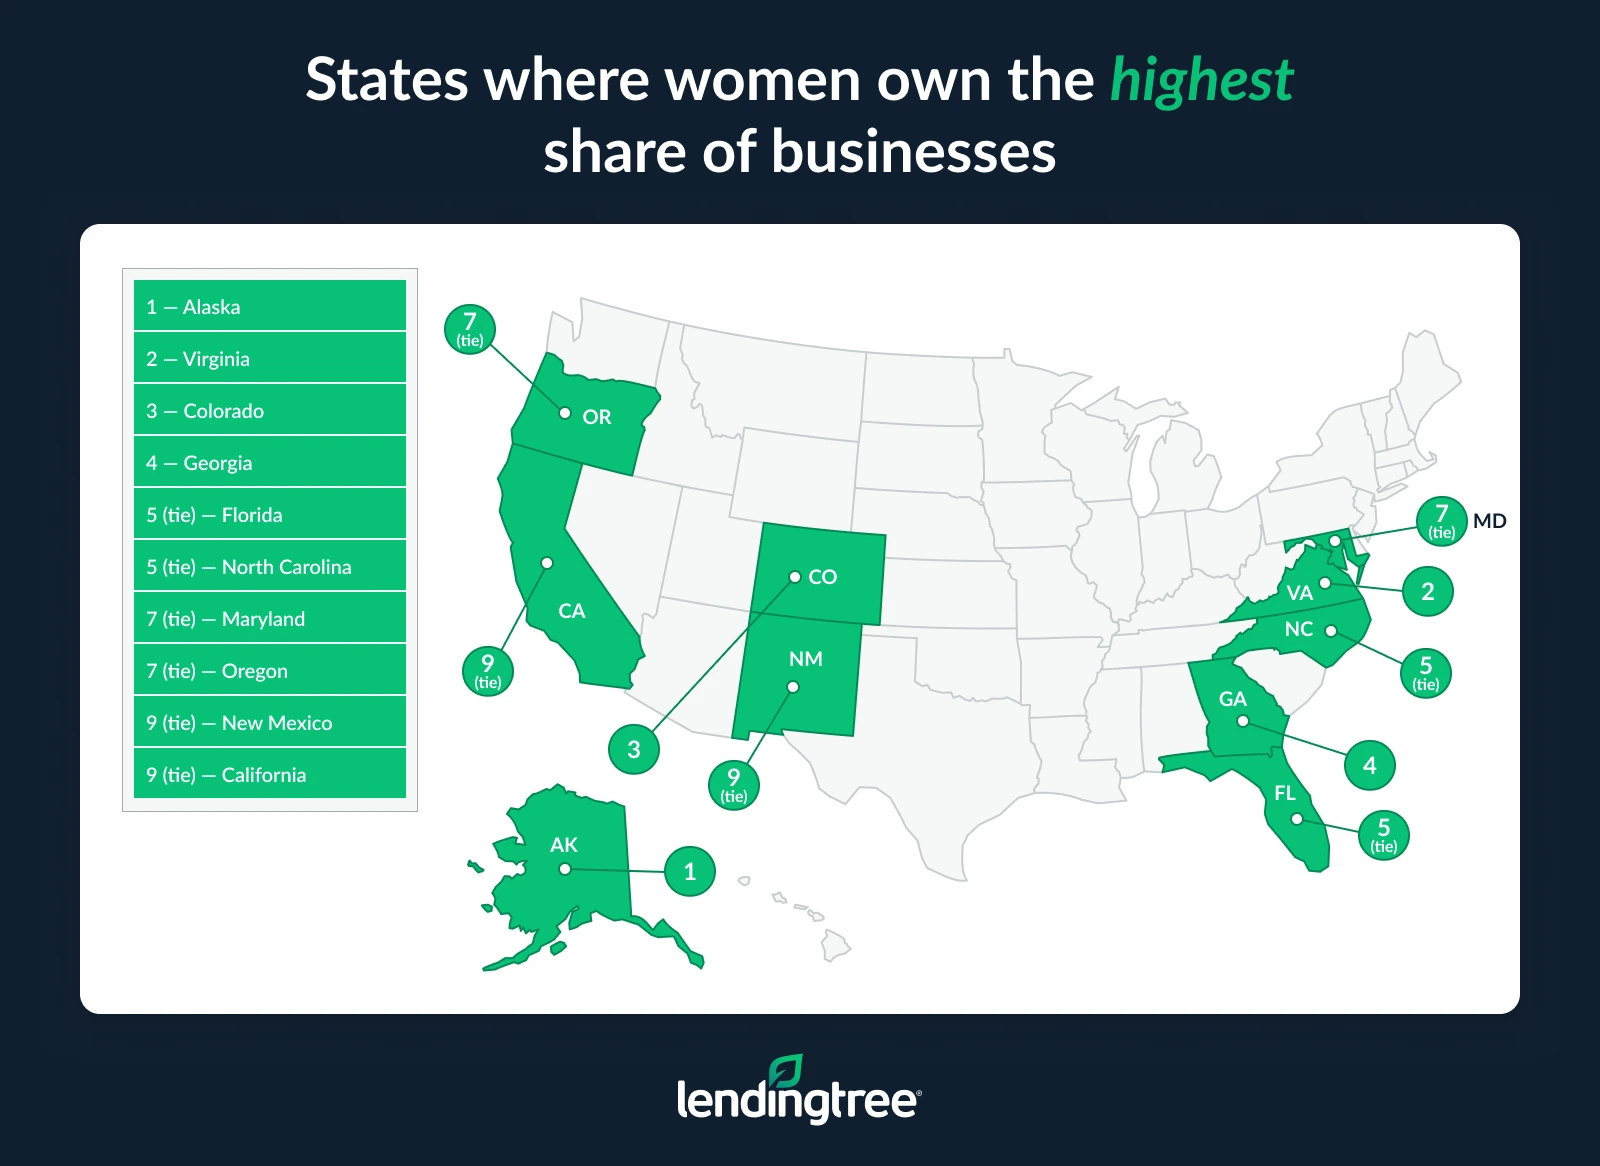
On the other end of the list, just 15.9% of businesses in South Dakota are owned by women — the lowest share of any state. New Hampshire (16.8%) and Delaware (17.8%) follow.
Full rankings: States where women own the highest share of businesses
| Rank | State | # of total businesses | # of men-owned businesses | # of women-owned businesses | % of women-owned businesses |
|---|---|---|---|---|---|
| 1 | Alaska | 16,222 | 8,149 | 4,406 | 27.2% |
| 2 | Virginia | 147,928 | 87,383 | 37,471 | 25.3% |
| 3 | Colorado | 140,658 | 80,825 | 35,397 | 25.2% |
| 4 | Georgia | 188,525 | 115,816 | 46,374 | 24.6% |
| 5 | Florida | 500,294 | 300,567 | 120,751 | 24.1% |
| 5 | North Carolina | 181,475 | 106,108 | 43,704 | 24.1% |
| 7 | Maryland | 104,496 | 64,518 | 25,129 | 24.0% |
| 7 | Oregon | 91,384 | 50,752 | 21,907 | 24.0% |
| 9 | New Mexico | 32,406 | 17,228 | 7,760 | 23.9% |
| 9 | California | 791,791 | 473,859 | 189,543 | 23.9% |
| 11 | Hawaii | 23,211 | 12,352 | 5,507 | 23.7% |
| 11 | Washington | 153,111 | 83,451 | 36,227 | 23.7% |
| 13 | District of Columbia | 14,583 | 7,410 | 3,403 | 23.3% |
| 14 | Arizona | 119,314 | 65,867 | 27,447 | 23.0% |
| 14 | New York | 427,227 | 279,024 | 98,051 | 23.0% |
| 16 | South Carolina | 86,169 | 53,953 | 19,720 | 22.9% |
| 17 | Nevada | 59,486 | 34,496 | 13,541 | 22.8% |
| 17 | Texas | 470,732 | 280,606 | 107,124 | 22.8% |
| 19 | Illinois | 238,091 | 151,621 | 52,815 | 22.2% |
| 20 | Missouri | 102,850 | 58,942 | 22,632 | 22.0% |
| 21 | Montana | 34,269 | 18,200 | 7,249 | 21.2% |
| 22 | Minnesota | 110,485 | 67,197 | 23,346 | 21.1% |
| 22 | Wyoming | 19,113 | 10,138 | 4,033 | 21.1% |
| 24 | Mississippi | 41,925 | 25,531 | 8,756 | 20.9% |
| 25 | Oklahoma | 69,555 | 40,734 | 14,501 | 20.8% |
| 26 | Michigan | 163,461 | 106,308 | 33,872 | 20.7% |
| 26 | New Jersey | 185,622 | 121,647 | 38,402 | 20.7% |
| 28 | Ohio | 170,013 | 108,364 | 35,005 | 20.6% |
| 28 | Louisiana | 77,611 | 46,106 | 15,973 | 20.6% |
| 28 | Massachusetts | 137,011 | 88,673 | 28,190 | 20.6% |
| 31 | Indiana | 103,466 | 63,593 | 21,054 | 20.3% |
| 31 | Pennsylvania | 212,827 | 136,489 | 43,278 | 20.3% |
| 33 | Vermont | 16,582 | 8,696 | 3,325 | 20.1% |
| 34 | Maine | 32,944 | 19,680 | 6,595 | 20.0% |
| 35 | Kansas | 52,627 | 30,124 | 10,499 | 19.9% |
| 35 | Rhode Island | 23,020 | 14,513 | 4,576 | 19.9% |
| 37 | Connecticut | 65,346 | 41,578 | 12,939 | 19.8% |
| 38 | Wisconsin | 101,315 | 60,702 | 19,796 | 19.5% |
| 38 | Arkansas | 49,201 | 27,955 | 9,605 | 19.5% |
| 40 | Tennessee | 96,320 | 60,163 | 18,693 | 19.4% |
| 41 | Nebraska | 41,718 | 23,594 | 7,854 | 18.8% |
| 42 | Alabama | 70,676 | 45,591 | 13,219 | 18.7% |
| 43 | Idaho | 46,244 | 25,557 | 8,588 | 18.6% |
| 43 | Iowa | 57,666 | 34,220 | 10,700 | 18.6% |
| 45 | West Virginia | 22,945 | 13,950 | 4,164 | 18.1% |
| 46 | North Dakota | 18,519 | 11,209 | 3,332 | 18.0% |
| 47 | Utah | 76,759 | 47,333 | 13,705 | 17.9% |
| 48 | Delaware | 22,350 | 13,915 | 3,989 | 17.8% |
| 49 | New Hampshire | 29,391 | 18,573 | 4,943 | 16.8% |
| 50 | South Dakota | 22,507 | 13,602 | 3,586 | 15.9% |
North Carolina metro has highest share of women-owned businesses
By metro, Durham, N.C., ranks first for its share of women-owned businesses, with 28.0% owned by women. Anchorage, Alaska (27.9%), and Albuquerque, N.M. (26.7%), rank second and third, respectively.
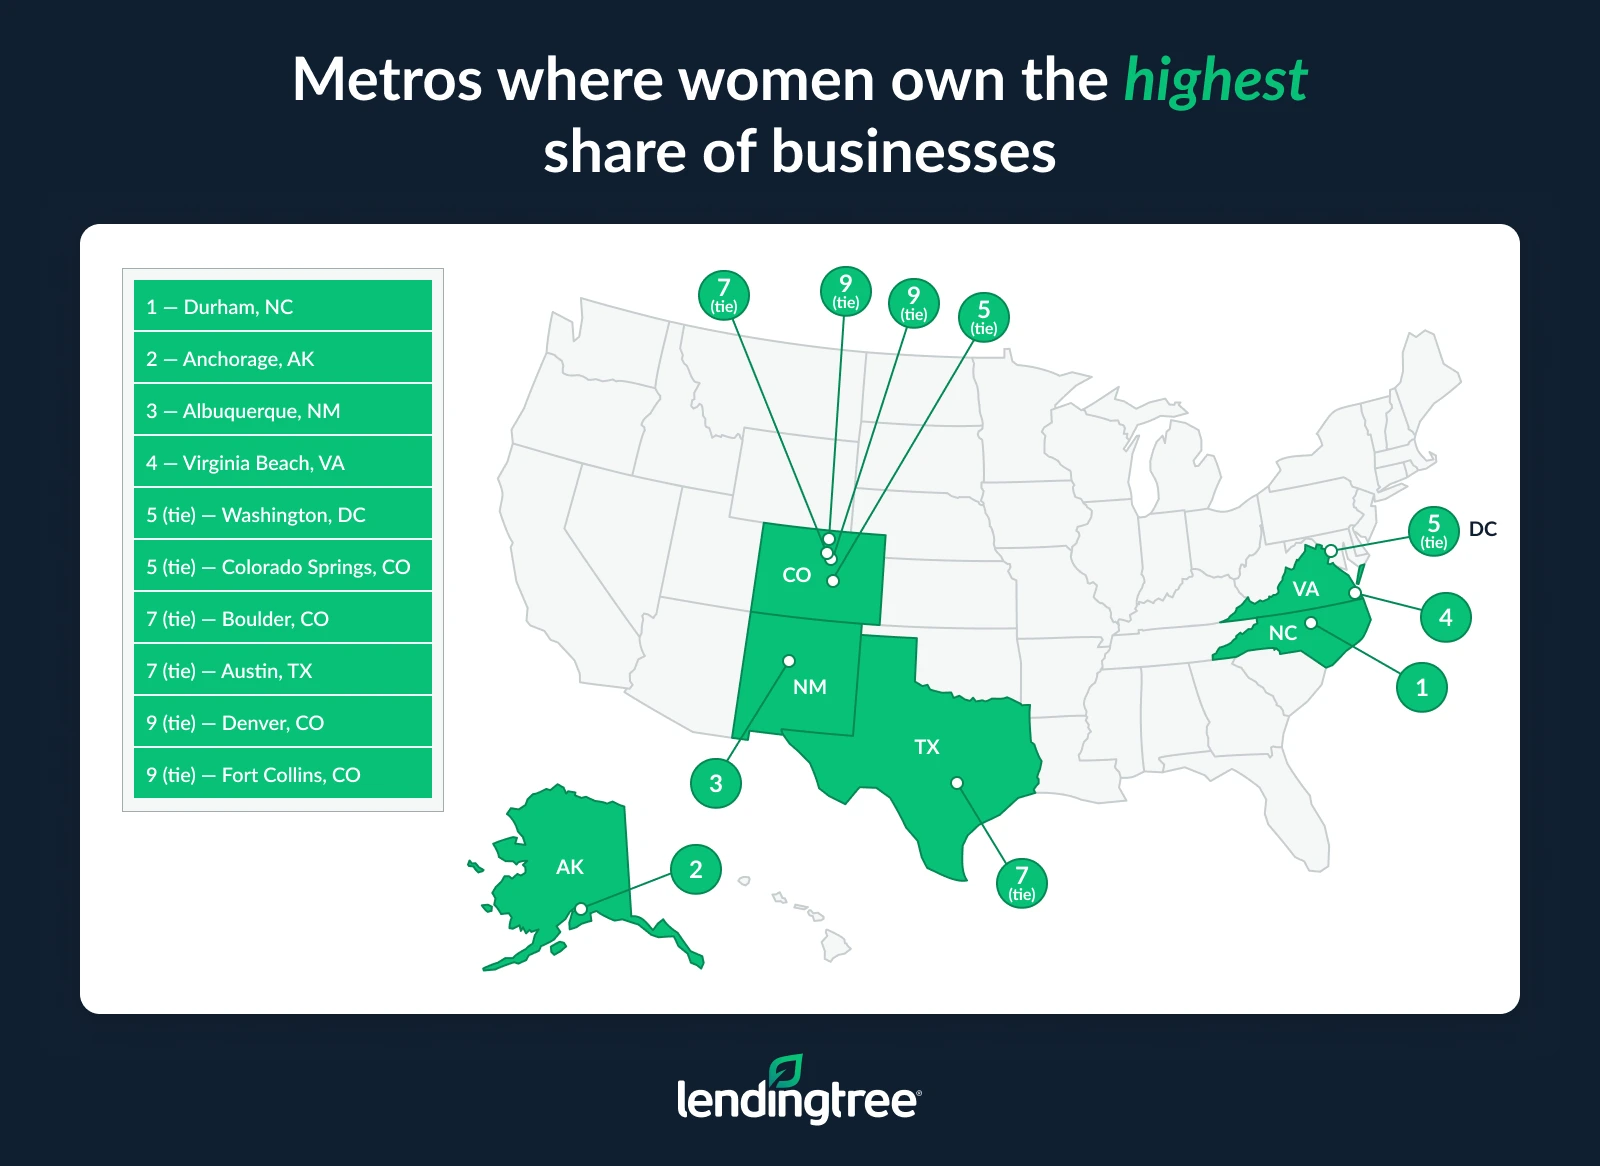
In other metros, women-owned businesses are less prevalent. Provo, Utah, ranks last, with just 14.6% of its businesses owned by women. That’s followed by Worcester, Mass. (16.9%), and Knoxville, Tenn. (17.0%).
Full rankings: Metros where women own the highest share of businesses
| Rank | Metro | # of total businesses | # of men-owned businesses | # of women-owned businesses | % of women-owned businesses |
|---|---|---|---|---|---|
| 1 | Durham, NC | 11,145 | 5,871 | 3,123 | 28.0% |
| 2 | Anchorage, AK | 9,165 | 4,755 | 2,559 | 27.9% |
| 3 | Albuquerque, NM | 14,243 | 7,234 | 3,799 | 26.7% |
| 4 | Virginia Beach, VA | 26,640 | 15,172 | 7,060 | 26.5% |
| 5 | Washington, DC | 112,724 | 65,609 | 29,617 | 26.3% |
| 5 | Colorado Springs, CO | 15,326 | 8,265 | 4,025 | 26.3% |
| 7 | Boulder, CO | 11,211 | 6,410 | 2,875 | 25.6% |
| 7 | Austin, TX | 49,673 | 28,008 | 12,734 | 25.6% |
| 9 | Denver, CO | 70,391 | 41,222 | 17,954 | 25.5% |
| 9 | Fort Collins, CO | 9,675 | 5,013 | 2,464 | 25.5% |
| 11 | Atlanta, GA | 122,550 | 73,823 | 31,139 | 25.4% |
| 12 | Raleigh, NC | 29,030 | 16,410 | 7,334 | 25.3% |
| 13 | Seattle, WA | 82,891 | 44,984 | 20,919 | 25.2% |
| 14 | Miami, FL | 184,959 | 111,067 | 46,459 | 25.1% |
| 14 | Los Angeles, CA | 336,814 | 203,001 | 84,558 | 25.1% |
| 16 | Portland, OR | 56,235 | 31,532 | 14,060 | 25.0% |
| 17 | Bend, OR | 8,281 | 4,276 | 2,049 | 24.7% |
| 18 | Charleston, SC | 17,766 | 10,571 | 4,354 | 24.5% |
| 19 | San Francisco, CA | 100,859 | 57,894 | 24,599 | 24.4% |
| 20 | Savannah, GA | 8,193 | 4,383 | 1,972 | 24.1% |
| 21 | Orlando, FL | 61,884 | 36,838 | 14,852 | 24.0% |
| 22 | Las Vegas, NV | 42,644 | 24,836 | 10,110 | 23.7% |
| 23 | Naples, FL | 10,496 | 5,912 | 2,478 | 23.6% |
| 23 | Asheville, NC | 11,073 | 5,945 | 2,608 | 23.6% |
| 25 | Tampa, FL | 71,518 | 42,454 | 16,795 | 23.5% |
| 25 | San Diego, CA | 73,742 | 43,904 | 17,301 | 23.5% |
| 27 | Columbia, SC | 13,954 | 8,147 | 3,269 | 23.4% |
| 28 | Charlotte, NC | 51,955 | 30,833 | 12,109 | 23.3% |
| 28 | St. Louis, MO | 46,420 | 26,724 | 10,813 | 23.3% |
| 28 | Baltimore, MD | 52,245 | 32,738 | 12,164 | 23.3% |
| 31 | San Jose, CA | 41,139 | 23,583 | 9,514 | 23.1% |
| 31 | Cape Coral, FL | 18,318 | 10,132 | 4,232 | 23.1% |
| 33 | Phoenix, AZ | 84,672 | 47,873 | 19,384 | 22.9% |
| 34 | Sacramento, CA | 43,985 | 25,375 | 10,010 | 22.8% |
| 35 | Minneapolis, MN | 74,019 | 45,536 | 16,798 | 22.7% |
| 35 | Richmond, VA | 25,043 | 15,076 | 5,682 | 22.7% |
| 37 | New York, NY | 458,820 | 302,138 | 103,898 | 22.6% |
| 37 | San Antonio, TX | 36,579 | 21,289 | 8,275 | 22.6% |
| 39 | Albany, NY | 14,323 | 8,707 | 3,226 | 22.5% |
| 39 | Des Moines, IA | 13,738 | 7,915 | 3,092 | 22.5% |
| 39 | Houston, TX | 120,160 | 71,411 | 27,043 | 22.5% |
| 39 | New Orleans, LA | 18,120 | 10,366 | 4,077 | 22.5% |
| 43 | Wichita, KS | 10,440 | 5,821 | 2,338 | 22.4% |
| 44 | Portland, ME | 15,784 | 9,253 | 3,511 | 22.2% |
| 44 | Chicago, IL | 191,463 | 123,792 | 42,579 | 22.2% |
| 44 | Jacksonville, FL | 35,398 | 21,335 | 7,857 | 22.2% |
| 44 | Honolulu, HI | 15,796 | 8,882 | 3,502 | 22.2% |
| 48 | McAllen, TX | 10,226 | 6,073 | 2,264 | 22.1% |
| 48 | Little Rock, AR | 14,058 | 7,693 | 3,105 | 22.1% |
| 50 | Kansas City, MO | 40,183 | 23,518 | 8,817 | 21.9% |
| 50 | Akron, OH | 11,296 | 7,064 | 2,473 | 21.9% |
| 52 | Oxnard, CA | 19,173 | 11,296 | 4,182 | 21.8% |
| 52 | Tucson, AZ | 16,265 | 8,490 | 3,546 | 21.8% |
| 54 | Oklahoma City, OK | 30,237 | 17,645 | 6,550 | 21.7% |
| 55 | Bridgeport, CT | 20,734 | 12,429 | 4,473 | 21.6% |
| 56 | Indianapolis, IN | 35,587 | 21,817 | 7,641 | 21.5% |
| 57 | Wilmington, NC | 10,008 | 5,551 | 2,144 | 21.4% |
| 58 | Allentown, PA | 13,162 | 7,906 | 2,795 | 21.2% |
| 58 | Winston-Salem, NC | 10,939 | 6,066 | 2,317 | 21.2% |
| 60 | Columbus, OH | 31,429 | 19,415 | 6,635 | 21.1% |
| 60 | Greenville, SC | 16,947 | 10,584 | 3,576 | 21.1% |
| 62 | Philadelphia, PA | 116,015 | 74,318 | 24,261 | 20.9% |
| 63 | Rochester, NY | 17,546 | 10,950 | 3,655 | 20.8% |
| 64 | Scranton, PA | 10,510 | 6,303 | 2,179 | 20.7% |
| 65 | North Port, FL | 21,818 | 13,113 | 4,503 | 20.6% |
| 65 | Riverside, CA | 68,452 | 41,489 | 14,122 | 20.6% |
| 65 | Grand Rapids, MI | 20,228 | 12,748 | 4,162 | 20.6% |
| 65 | Detroit, MI | 77,189 | 51,765 | 15,870 | 20.6% |
| 69 | Boston, MA | 100,798 | 64,868 | 20,711 | 20.5% |
| 70 | Deltona, FL | 12,588 | 7,262 | 2,548 | 20.2% |
| 70 | Providence, RI | 32,086 | 20,589 | 6,481 | 20.2% |
| 72 | Tulsa, OK | 18,528 | 10,679 | 3,720 | 20.1% |
| 72 | Buffalo, NY | 20,456 | 13,070 | 4,107 | 20.1% |
| 72 | Cincinnati, OH | 33,466 | 20,663 | 6,715 | 20.1% |
| 75 | Syracuse, NY | 11,211 | 7,169 | 2,241 | 20.0% |
| 75 | Santa Maria, CA | 9,955 | 5,827 | 1,988 | 20.0% |
| 77 | Cleveland, OH | 38,624 | 24,755 | 7,690 | 19.9% |
| 77 | Reno, NV | 12,204 | 6,661 | 2,425 | 19.9% |
| 79 | Memphis, TN | 16,251 | 9,768 | 3,210 | 19.8% |
| 79 | Madison, WI | 13,402 | 7,638 | 2,647 | 19.8% |
| 81 | Louisville, KY | 22,270 | 13,722 | 4,384 | 19.7% |
| 81 | Milwaukee, WI | 27,733 | 17,309 | 5,456 | 19.7% |
| 83 | Omaha, NE | 19,490 | 11,362 | 3,826 | 19.6% |
| 83 | Harrisburg, PA | 10,239 | 6,206 | 2,005 | 19.6% |
| 85 | Dayton, OH | 11,037 | 6,727 | 2,153 | 19.5% |
| 85 | Port St. Lucie, FL | 11,509 | 7,044 | 2,242 | 19.5% |
| 87 | Hartford, CT | 20,512 | 13,042 | 3,976 | 19.4% |
| 88 | Salt Lake City, UT | 28,143 | 16,782 | 5,422 | 19.3% |
| 88 | Ogden, UT | 13,574 | 7,964 | 2,615 | 19.3% |
| 90 | Baton Rouge, LA | 14,755 | 8,482 | 2,840 | 19.2% |
| 90 | Fayetteville, AR | 11,586 | 6,267 | 2,227 | 19.2% |
| 92 | Birmingham, AL | 19,704 | 12,135 | 3,753 | 19.0% |
| 93 | Jackson, MS | 10,468 | 6,524 | 1,977 | 18.9% |
| 93 | Boise, ID | 19,332 | 10,582 | 3,647 | 18.9% |
| 95 | Greensboro, NC | 14,936 | 9,012 | 2,809 | 18.8% |
| 96 | Nashville, TN | 34,135 | 21,179 | 6,360 | 18.6% |
| 97 | Spokane, WA | 12,700 | 6,841 | 2,283 | 18.0% |
| 98 | Knoxville, TN | 13,742 | 8,430 | 2,334 | 17.0% |
| 99 | Worcester, MA | 15,427 | 10,384 | 2,611 | 16.9% |
| 100 | Provo, UT | 15,041 | 9,434 | 2,189 | 14.6% |
Starting a business as a female entrepreneur: Top expert tips
Women face a lot of pressure in the professional world, particularly as entrepreneurs. We offer the following advice:
- Seek out funding help. “Even though it has never been cheaper to start a business, access to capital is essential to your chances of success,” Schulz says. “Shopping around for small business loans is a must, as offers can vary significantly from one lender to another.” Other options include using home equity or credit cards, though “you have to make sure that you’re comfortable with the risk that comes with that,” he says. Additionally, he says, “there are loads of organizations geared to help female entrepreneurs with everything from funding to networking to training. Googling ‘resources for female entrepreneurs near me’ can be a great place to start.”
- Get your personal credit in order. “Your personal credit score can have a major effect on your ability to get a small business loan — and it can also impact the terms you receive if you do get one,” he says. “Check your credit score, review your credit report for inaccuracies or possible fraudulent activity, and make sure that you are paying your bills on time every single time. (And, of course, pay off your high-interest debt, though that’s obviously easier said than done.)”
- Have a well-thought-out business plan. If you’re planning to launch a business, a detailed, thoughtful business plan is a must. “Lenders aren’t in the business of handing out money to everyone who asks,” Schulz says. “They’ll want to understand your plan to make your business a success.”
Methodology
LendingTree analyzed U.S. Census Bureau Annual Business Survey (ABS) data to examine trends in women-owned businesses across the U.S. The analysis draws on multiple years of ABS data, including 2017 and 2023 — the earliest and most recent years available for consistent comparison.
In addition to national-level findings, this study includes state- and metro-level analysis. The metro-level analysis focuses on the 100 largest U.S. metros by the number of women-owned employer businesses. We ranked the states and metros from highest to lowest based on the percentage of businesses owned by women.
Compare business loan offers
Recommended Articles