East Coast Dominates States Most at Risk of Coastal Flooding
Coastal flooding is a growing threat in the U.S., but not all regions face the same level of risk. East Coast states are significantly more at risk, according to a LendingTree study, accounting for seven of the 10 most in danger.
We’ll go over the coastal states (and counties) most at risk for flooding. Additionally, we’ll go over home insurance tips for homeowners in states with flood risk.
Key findings
- Louisiana, New Jersey and Virginia are most at risk for coastal flooding. Louisiana ranks in the bottom four in the three categories analyzed (annual frequency, expected annual losses and population exposure). The East Coast dominates the at-risk list, accounting for seven of the 10 in worst shape.
- Virginia has the most coastal flood events annually. At 158.7 coastal flood events annually, Virginia leads by a wide margin. Florida (108.3) is the only other above 100.0.
- Expected annual losses per 10,000 residents are highest in New Jersey. New Jersey has expected annual losses of $682,436 per 10,000 residents. Following at less than a third of New Jersey’s expected losses is Delaware, at $223,849. Louisiana ($127,714) and Oregon ($103,002) are the only others above $100,000.
- Nearly 2 in 5 Louisiana residents are exposed to coastal flooding risk. Louisiana has the highest proportion of residents exposed to coastal flooding, at 38.4%. Florida is the only other above 10.0%, at 17.5%.
- Among 41 coastal sites analyzed, 29 saw average annual coastal flood events double or more from 1990-2009 to 2010-23. Mayport, Fla. (971.4%), saw the biggest increase in coastal flood events, ahead of Wilmington, N.C. (582.5%), and Charleston, S.C. (580.3%). Only seven of the sites experienced a decrease in the studied period.
To determine which coastal states with ocean shorelines are most at risk of coastal flooding, researchers analyzed Federal Emergency Management Agency (FEMA) National Risk Index (NRI) data. The following metrics were weighted equally:
- Annualized frequency of coastal flood events (calculated at the county level for each coastal state)
- Expected annual losses per 10,000 residents (accounts for expected losses from buildings and population, expressed in dollars)
- Percentages of the population exposed to coastal flooding
Separately, researchers analyzed U.S. Environmental Protection Agency (EPA) data from 41 coastal sites. We calculated the change in coastal flood events from 1990-2009 to 2010-23 — periods preset by the EPA.
East Coast states more at risk of coastal flooding
Across the three categories analyzed, Louisiana is the most at risk of coastal flooding. Notably, Louisiana has the highest percentage of residents exposed to coastal flooding (38.4%), the third-highest expected annual losses per 10,000 residents ($127,714) and the fourth-highest annualized frequency of coastal flood events (81.1).
Part of that is due to erosion. Louisiana accounts for a staggering 80% of the country’s coastal wetland loss, according to New Orleans’ Hazard Mitigation Plan. While all coastal areas face challenges with rising sea levels, Louisiana’s sinking Mississippi River Delta compounds the problem, exposing more residents to flood risk, according to Climate Central data.
New Jersey, which ranked worst in our study last year that included different metrics, follows. New Jersey has the highest expected annual losses ($682,436 per 10,000 residents), the fifth-highest percentage of residents exposed to coastal flooding (6.4%) and the eighth-highest annualized frequency of coastal flood events (59.3).
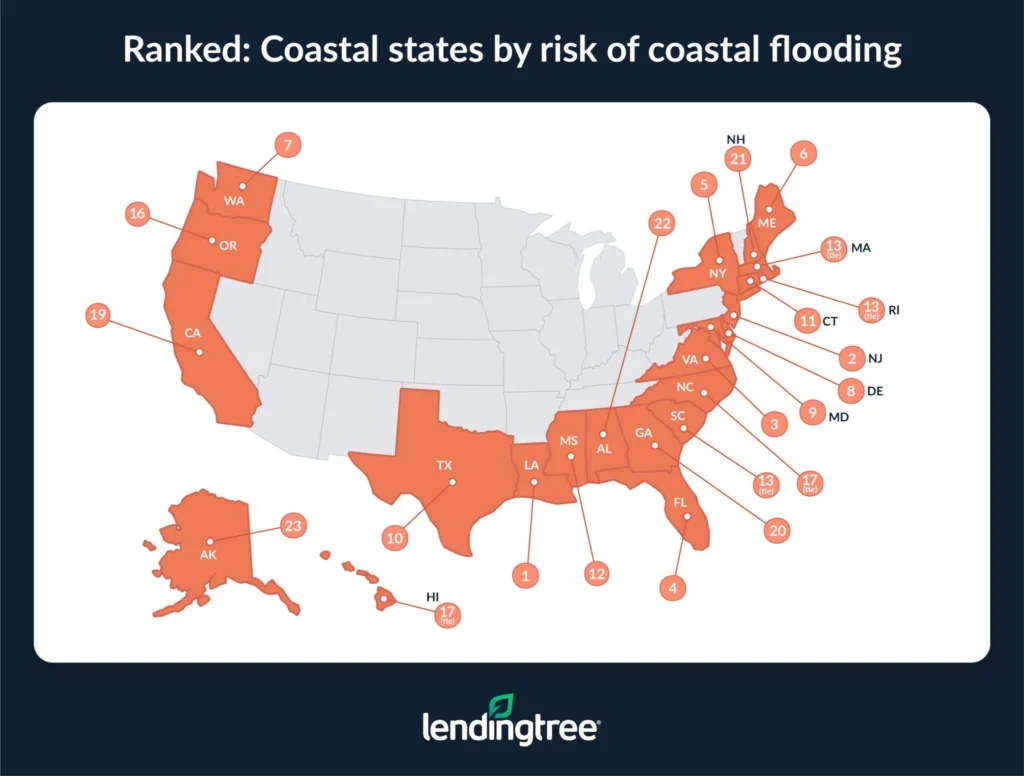
Virginia rounds out the top three, with the highest annualized frequency of coastal flood events (158.7), the fifth-highest expected annual losses ($81,508 per 10,000 residents) and the 10th-highest percentage of residents exposed to coastal flooding (3.9%).
East Coast states account for seven of the 10 most at risk of coastal flooding.
LendingTree home insurance expert and licensed insurance agent Rob Bhatt believes the most important thing for homeowners to know in these states — and any other state — is that flooding can happen just about anywhere.
“It’s important to get to know the flood risks in your area and take steps to protect your home,” he says. “These can include simple things like moving essential appliances from your basement to a higher floor. They can also include stocking up on supplies and filling sandbags if the water in your area starts to rise. You can also consider flood insurance for financial protection from potential flood damage.”
Most people don’t think about flood insurance unless they need a mortgage for a home in a high-risk flood zone, Bhatt says. If you live in a low- or moderate-risk area, you may not be aware that standard homeowners insurance doesn’t cover flood damage until it’s too late.
By county (and state), Bergen County, N.J., has highest risk
Looking at the county most at risk in each coastal state, Bergen County, N.J., has the highest risk. Grays Harbor County, Wash., and Kings County, N.Y., follow.
Ranked: County most at-risk of coastal flooding in each coastal state
| Rank | State | County | Coastal flooding risk score |
|---|---|---|---|
| 1 | New Jersey | Bergen | 100.0 |
| 2 | Washington | Grays Harbor | 98.8 |
| 3 | New York | Kings | 98.4 |
| 4 | Oregon | Clatsop | 98.0 |
| 5 | Texas | Cameron | 97.8 |
| 6 | Delaware | Sussex | 96.8 |
| 7 | Louisiana | Jefferson | 96.2 |
| 8 | Connecticut | Fairfield | 96.0 |
| 9 | Virginia | Accomack | 94.8 |
| 10 | Maryland | Anne Arundel | 94.4 |
| 11 | California | Humboldt | 94.0 |
| 12 | Mississippi | Harrison | 93.2 |
| 13 | Florida | St. Johns | 93.0 |
| 14 | South Carolina | Horry | 89.7 |
| 15 | Massachusetts | Plymouth | 89.1 |
| 16 | North Carolina | Dare | 85.3 |
| 17 | Maine | Hancock | 81.7 |
| 18 | Rhode Island | Washington | 80.3 |
| 19 | New Hampshire | Rockingham | 78.7 |
| 20 | Hawaii | Honolulu | 76.9 |
| 21 | Georgia | Glynn | 70.4 |
| 22 | Alabama | Mobile | 61.4 |
| 23 | Alaska | Juneau | 38.6 |
Meanwhile, Juneau Borough, Alaska, has the lowest risk among the counties in the states analyzed. Mobile County, Ala., and Glynn County, Ga., follow.
Virginia sees 158.7 coastal flood events annually
Switching to the individual metrics, Virginia has the highest annualized frequency of coastal flood events. (As a reminder, this is calculated at the county level for each coastal state.) Virginia has 158.7 coastal floods annually — significantly higher than Florida, the next highest state, at 108.3.
This is largely due to Virginia’s geography, with 250,000 acres of land lying less than 5 feet above the high tide line, according to Climate Central.
With that in mind, Bhatt says it’s crucial that every homeowner assesses their home’s flood risks to decide if flood insurance is right for them. “Flood insurance is only required in high-risk flood zones, and only if you have a mortgage,” he says. “However, flooding can and does happen in low- and moderate-risk areas, too. About 40% of flood insurance claims are outside high-risk areas, according to FEMA. Low or moderate risk doesn’t mean no risk.”
Coastal states with highest annualized frequency of coastal flood events
| Rank | State | Annualized frequency |
|---|---|---|
| 1 | Virginia | 158.7 |
| 2 | Florida | 108.3 |
| 3 | Maine | 95.3 |
| 4 | Louisiana | 81.1 |
| 5 | Texas | 65.3 |
| 6 | Washington | 62.8 |
| 7 | Maryland | 62.4 |
| 8 | New Jersey | 59.3 |
| 9 | North Carolina | 58.6 |
| 10 | New York | 53.3 |
| 11 | Massachusetts | 52.7 |
| 12 | California | 45.6 |
| 13 | Oregon | 33.2 |
| 14 | South Carolina | 28.9 |
| 15 | Connecticut | 22.3 |
| 16 | Georgia | 22.1 |
| 17 | Rhode Island | 18.7 |
| 18 | Mississippi | 17.7 |
| 19 | New Hampshire | 11.7 |
| 20 | Delaware | 11.0 |
| 21 | Alabama | 8.5 |
| 22 | Hawaii | 2.5 |
| 23 | Alaska | 0.1 |
Following Florida, Maine ranks third at 95.3.
Meanwhile, Alaska (0.1), Hawaii (2.5) and Alabama (8.5) have the lowest annualized frequency of coastal flood events among the 23 states with ocean shorelines.
Expected annual losses highest in New Jersey
New Jersey has the highest expected annual losses from buildings and population per 10,000 residents, at $682,436. That can largely be attributed to New Jersey’s population density. New Jersey is the second most densely populated state, according to the U.S. Census Bureau, meaning a higher concentration of houses and businesses is at risk during a flood event.
Delaware follows in a distant second at $223,849.
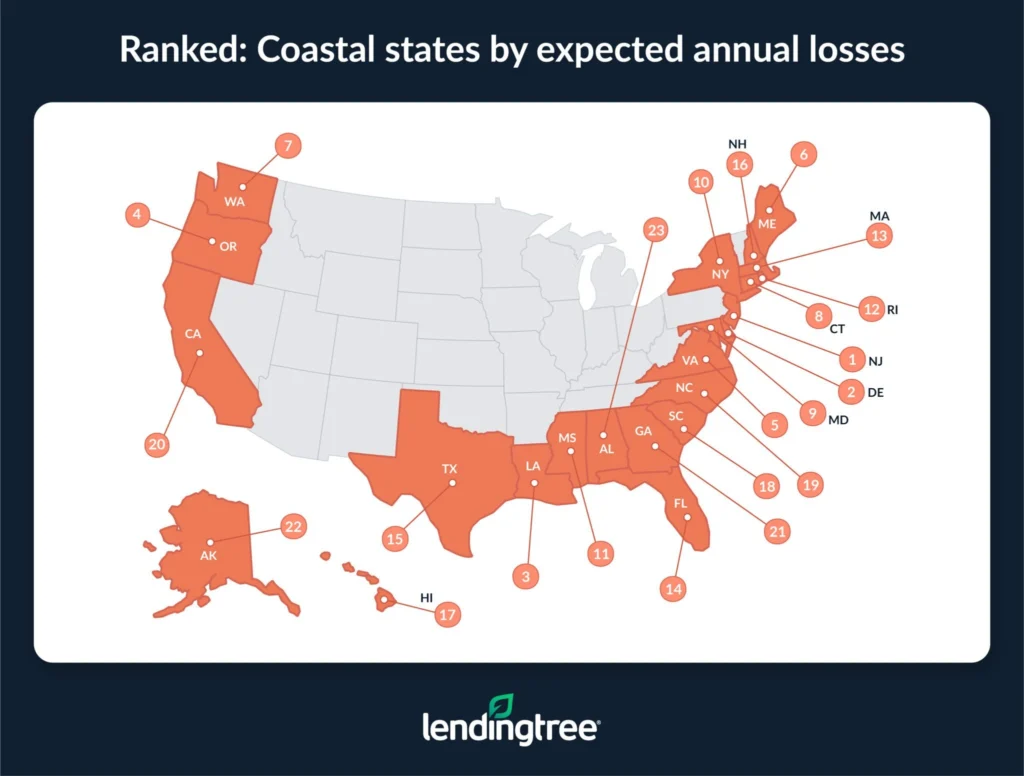
Louisiana ($127,714) and Oregon ($103,002) follow — the only other states above $100,000.
Alabama ($1,059), Alaska ($1,350) and Georgia ($1,723) have the lowest expected annual losses per 10,000 residents.
Coastal states with highest expected annual losses per 10,000 residents
| Rank | State | Expected annual losses |
|---|---|---|
| 1 | New Jersey | $682,436 |
| 2 | Delaware | $223,849 |
| 3 | Louisiana | $127,714 |
| 4 | Oregon | $103,002 |
| 5 | Virginia | $81,508 |
| 6 | Maine | $72,433 |
| 7 | Washington | $67,524 |
| 8 | Connecticut | $66,356 |
| 9 | Maryland | $63,481 |
| 10 | New York | $46,761 |
| 11 | Mississippi | $35,183 |
| 12 | Rhode Island | $33,029 |
| 13 | Massachusetts | $26,114 |
| 14 | Florida | $15,962 |
| 15 | Texas | $14,238 |
| 16 | New Hampshire | $13,338 |
| 17 | Hawaii | $12,160 |
| 18 | South Carolina | $10,412 |
| 19 | North Carolina | $8,099 |
| 20 | California | $3,502 |
| 21 | Georgia | $1,723 |
| 22 | Alaska | $1,350 |
| 23 | Alabama | $1,059 |
Louisiana has highest percentage of residents exposed to risk
Louisiana has a significantly high percentage of residents exposed to flooding risks, at 38.4%.
Not including areas protected by levees (man-made flood protection barriers), more than 46,000 people in Louisiana live on land within 2 feet of the high tide line, according to Climate Central (via PBS).
Coastal states with highest % of residents exposed to coastal flooding
| Rank | State | % exposed |
|---|---|---|
| 1 | Louisiana | 38.4% |
| 2 | Florida | 17.5% |
| 3 | Hawaii | 8.3% |
| 4 | South Carolina | 7.1% |
| 5 | New Jersey | 6.4% |
| 6 | Mississippi | 5.4% |
| 7 | Rhode Island | 5.3% |
| 8 | New York | 4.4% |
| 9 | Delaware | 4.1% |
| 10 | Virginia | 3.9% |
| 11 | Connecticut | 3.3% |
| 12 | Massachusetts | 3.1% |
| 13 | Texas | 2.5% |
| 14 | North Carolina | 1.8% |
| 15 | Georgia | 1.5% |
| 16 | Maryland | 1.4% |
| 17 | Washington | 1.2% |
| 17 | Alabama | 1.2% |
| 19 | California | 1.1% |
| 20 | Maine | 0.7% |
| 21 | New Hampshire | 0.6% |
| 22 | Alaska | 0.5% |
| 23 | Oregon | 0.4% |
Florida follows at 17.5% — the only other state above 10.0%. Hawaii (8.3%) rounds out the top three.
While this may not affect insurance directly, Bhatt says homeowners in these states are likely to see their home insurance rates rise.
“Floods themselves usually don’t directly impact homeowners insurance because home insurance doesn’t cover floods,” he says. “However, most flooding in Louisiana and Florida accompanies tropical storms and hurricanes. Except in wind pool zones, wind damage typically is covered by home insurance. Home insurance companies usually charge higher rates in areas with severe wind events. This allows them to cover the potentially massive costs of rebuilding homes after a major wind event.”
Oregon (0.4%), Alaska (0.5%) and New Hampshire (0.6%) have the lowest percentage of residents exposed to flood risk. Maine (0.7%) is the only other state below 1.0%.
Majority of coastal sites saw flood events rise
Flood risks may be on the rise, too. In fact, 29 of the 41 coastal stations analyzed saw average annual coastal flood events double or more from 1990-2009 to 2010-23. (The Environmental Protection Agency, or EPA, presets these periods.)
Mayport, Fla., saw the biggest increase in coastal flooding events during this period, jumping a whopping 971.4% from an annual average of 0.3 to 3.2. Wilmington, N.C. (582.5%), and Charleston, S.C. (580.3%), follow.
Change in average annual coastal flood events
| Rank | Station | Annual avg., 1990-2009 | Annual avg., 2010-23 | Change |
|---|---|---|---|---|
| 1 | Mayport, FL | 0.3 | 3.2 | 971.4% |
| 2 | Wilmington, NC | 0.5 | 3.1 | 582.5% |
| 3 | Charleston, SC | 1.1 | 7.1 | 580.3% |
| 4 | Annapolis, MD | 1.4 | 7.3 | 412.7% |
| 5 | Fort Pulaski, GA | 1.7 | 7.5 | 354.5% |
| 6 | Galveston Pier 21, TX | 2.5 | 10.4 | 314.3% |
| 7 | San Diego, CA | 1.5 | 5.9 | 303.9% |
| 8 | Cedar Key, FL | 1.2 | 4.6 | 291.8% |
| 9 | Hilo, HI | 3.7 | 14.1 | 285.7% |
| 10 | Kahului, HI | 1.9 | 6.9 | 270.7% |
| 11 | Port Isabel, TX | 0.9 | 2.9 | 236.1% |
| 12 | Baltimore, MD | 1.9 | 6.3 | 230.8% |
| 13 | Boston, MA | 4.2 | 12.9 | 209.8% |
| 14 | Honolulu, HI | 2.5 | 7.6 | 209.0% |
| 15 | Fernandina Beach, FL | 1.7 | 5.1 | 194.5% |
| 16 | Washington, DC | 2.4 | 7.0 | 193.0% |
| 17 | Sandy Hook, NJ | 4.2 | 10.9 | 161.6% |
| 18 | Portland, ME | 3.4 | 8.9 | 160.5% |
| 19 | Newport, RI | 1.9 | 4.9 | 155.6% |
| 20 | The Battery, NY | 4.3 | 10.3 | 139.5% |
| 21 | Bar Harbor, ME | 4.6 | 11.1 | 139.4% |
| 22 | Seattle, WA | 1.8 | 3.9 | 120.4% |
| 23 | Sewells Point, VA | 5.1 | 11.0 | 117.8% |
| 24 | Los Angeles, CA | 1.1 | 2.3 | 117.7% |
| 25 | Pensacola, FL | 1.5 | 3.2 | 110.6% |
| 26 | Philadelphia, PA | 2.6 | 5.4 | 110.1% |
| 27 | Lewes, DE | 4.2 | 8.7 | 107.5% |
| 28 | Friday Harbor, WA | 2.6 | 5.3 | 107.3% |
| 29 | Atlantic City, NJ | 5.2 | 10.7 | 105.6% |
| 30 | Montauk, NY | 2.3 | 4.4 | 91.3% |
| 31 | New London, CT | 2.3 | 4.2 | 87.3% |
| 32 | St. Petersburg, FL | 1.0 | 1.9 | 85.7% |
| 33 | Kings Point, NY | 5.0 | 9.1 | 81.4% |
| 34 | Port San Luis, CA | 0.5 | 0.5 | 0.0% |
| 35 | Astoria, OR | 7.8 | 7.7 | -0.5% |
| 36 | La Jolla, CA | 1.9 | 1.8 | -3.5% |
| 37 | Neah Bay, WA | 8.7 | 6.4 | -25.7% |
| 38 | Crescent City, CA | 3.7 | 1.7 | -54.1% |
| 39 | Adak Island, AK | 1.8 | 0.8 | -56.3% |
| 40 | Sitka, AK | 2.3 | 0.5 | -77.8% |
| 41 | San Francisco, CA | 0.7 | 0.1 | -89.8% |
Bhatt says this likely impacts everyone’s home insurance rates.
“The insurance industry has recognized that climate change is increasing the frequency and severity of flooding and other weather-related disasters,” he says. “These events directly impact their bottom lines, and they have been vocal about their need to increase their rates to meet their increasing costs.”
Traditionally, insurance companies used historical data to assess the disaster risks in the areas they serve. Now, many are utilizing climate modeling to analyze disasters.
Only seven of 41 sites analyzed experienced a decrease in coastal flooding events in the period analyzed — all on the West Coast.
Preparing for coastal flood risk: Top tips for homeowners
In today’s volatile climate, all homeowners should be prepared for potential floods — coastal or not. Bhatt offers the following advice:
- First, get to know your home’s specific flood risks. Then, develop a plan to protect your home from floods.
- Year-round home maintenance is important. “Consider improvements to make your home more resistant to flooding,” he says. “These can range from moving essential appliances to a higher floor to elevating the home. If you have a sump pump, test it throughout the year to make sure it works. Consider upgrading to a model with a backup battery if you don’t already have one.”
- Learn about your flood insurance options. “If you live in a low- or moderate-risk area, you can usually get flood insurance for less than those in high-risk areas,” he says. “Some companies offer inland flood endorsements you can add to an existing home policy. These types of add-ons don’t provide as much protection as full-fledged flood insurance. However, depending on your flood risks, this may be all you need.”
Methodology
LendingTree researchers analyzed Federal Emergency Management Agency (FEMA) National Risk Index (NRI) coastal flooding data to determine the coastal states with ocean shorelines most at risk of coastal flooding.
The three individual categories, weighted equally, were:
- Annualized frequency of coastal flood events
- Expected annual losses per 10,000 residents
- Percentages of the population exposed to coastal flooding