61% Support a Legal Driving Age Limit as Crash Rates Rise After 75


Many things get better with age — but old age (and the subsequent increase in reaction time) can make some ordinary tasks more difficult for people.
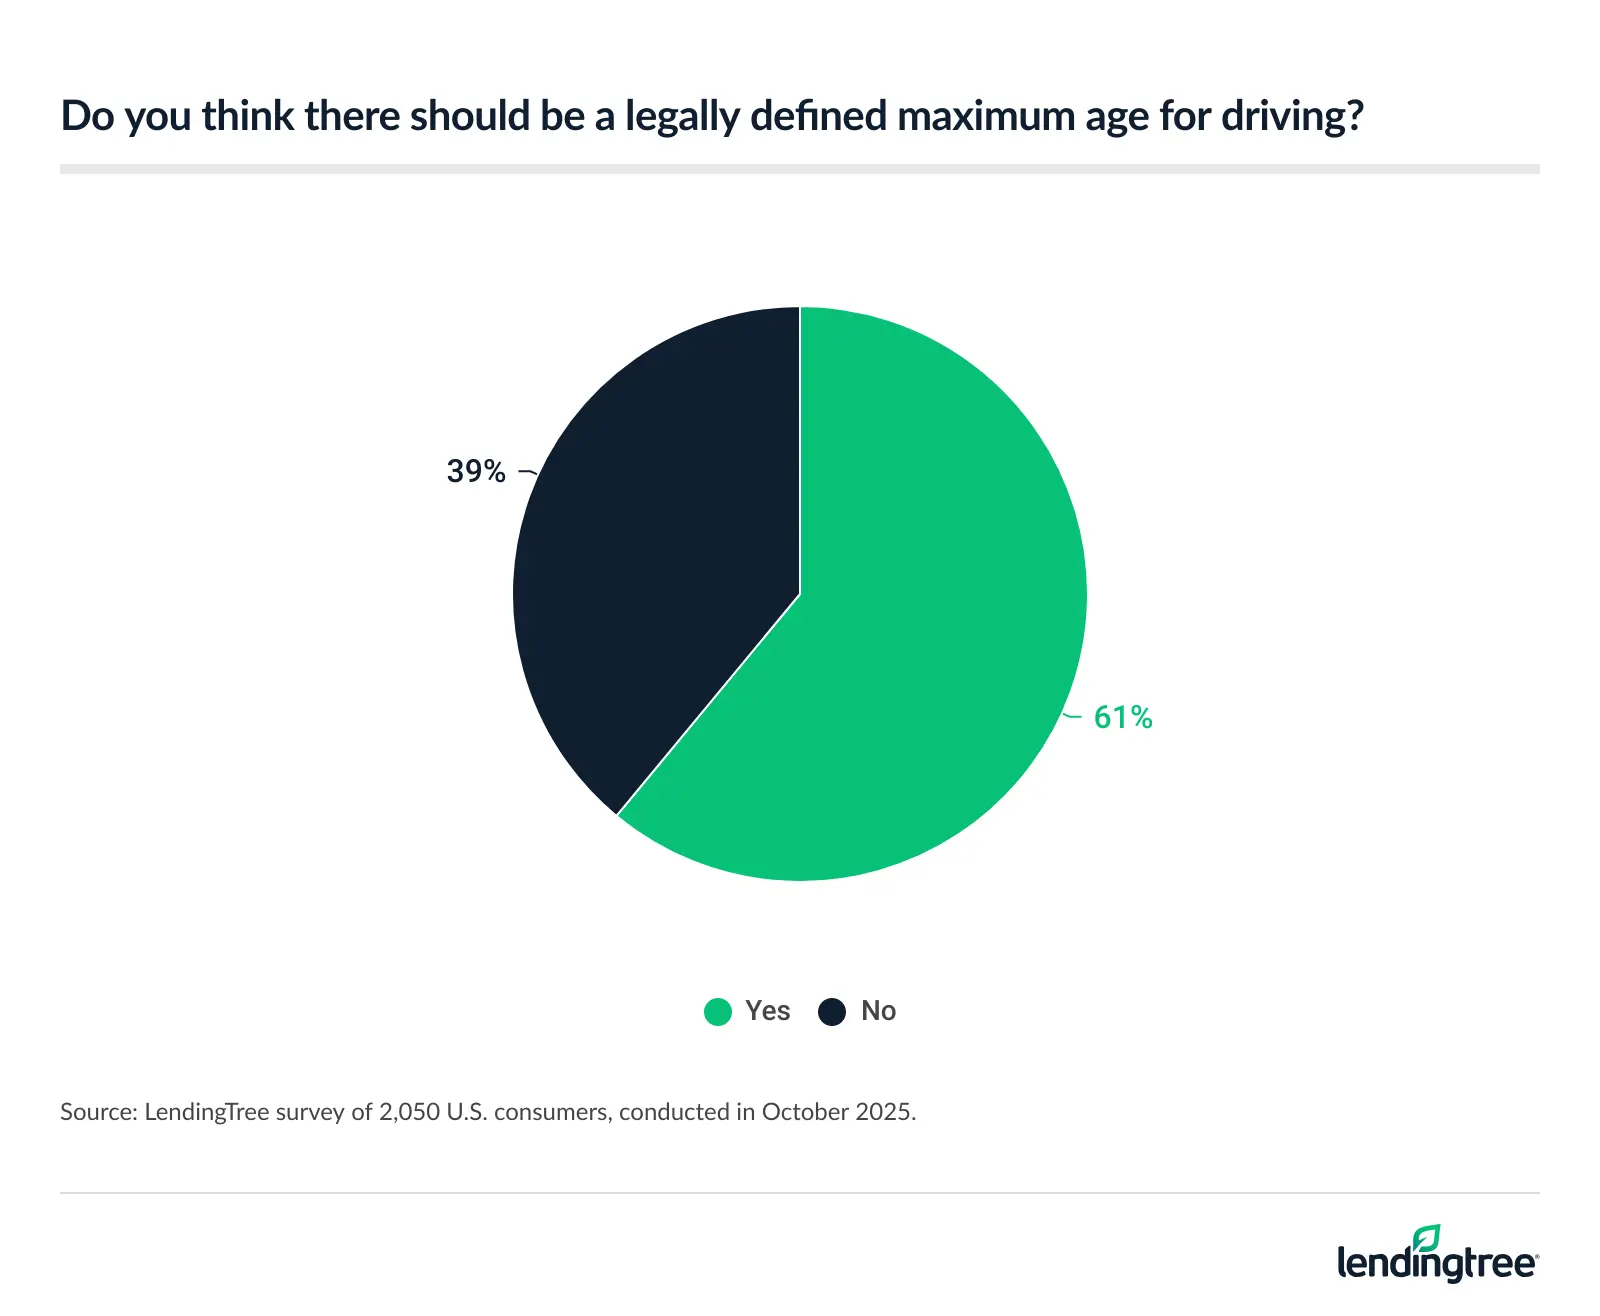
Many Americans believe driving is one of them. In fact, according to a LendingTree survey of 2,050 U.S. consumers, 61% agree that there should be a legally defined maximum driving age. And yet, the rate of older drivers involved in fatal crashes is lower than that among younger ones.
Find the full details below.
Key findings
- More than 6 in 10 Americans think driving shouldn’t be forever. 61% agree there should be a legally defined maximum age for driving. Of those who agree, 29% say that age should be younger than 70, while 55% believe the maximum should be 70 to 84.
- Sentiment toward older drivers varies. 46% of Americans view drivers 70 and older as safer than those 16 to 25, while 27% say they’re just as safe. Yet another 27% believe older drivers are more dangerous.
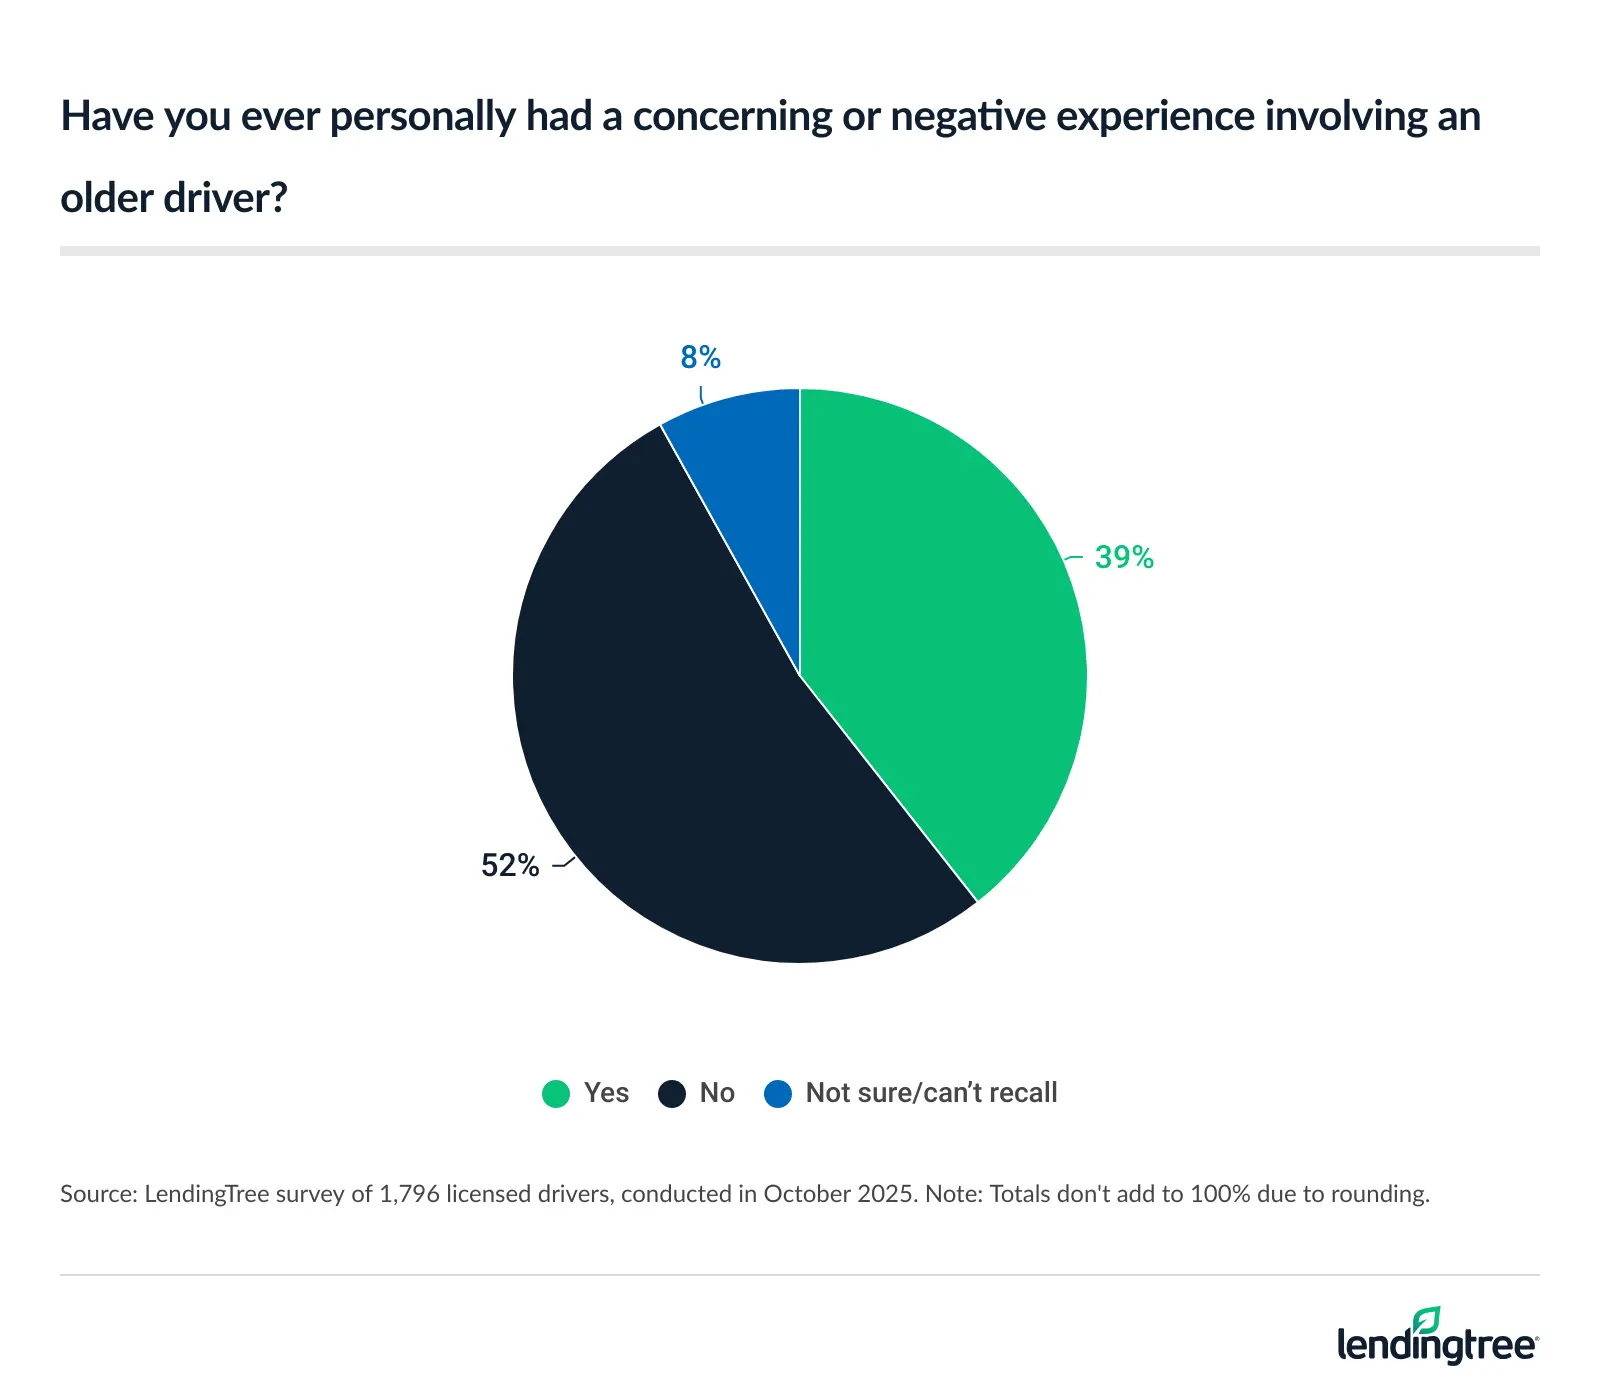
- Plenty of drivers have faced road bumps with older adults behind the wheel. 39% of licensed drivers say they’ve had a concerning or negative experience with an older driver. Additionally, 40% of Americans have had to intervene with an older family member or friend when it came to their driving.
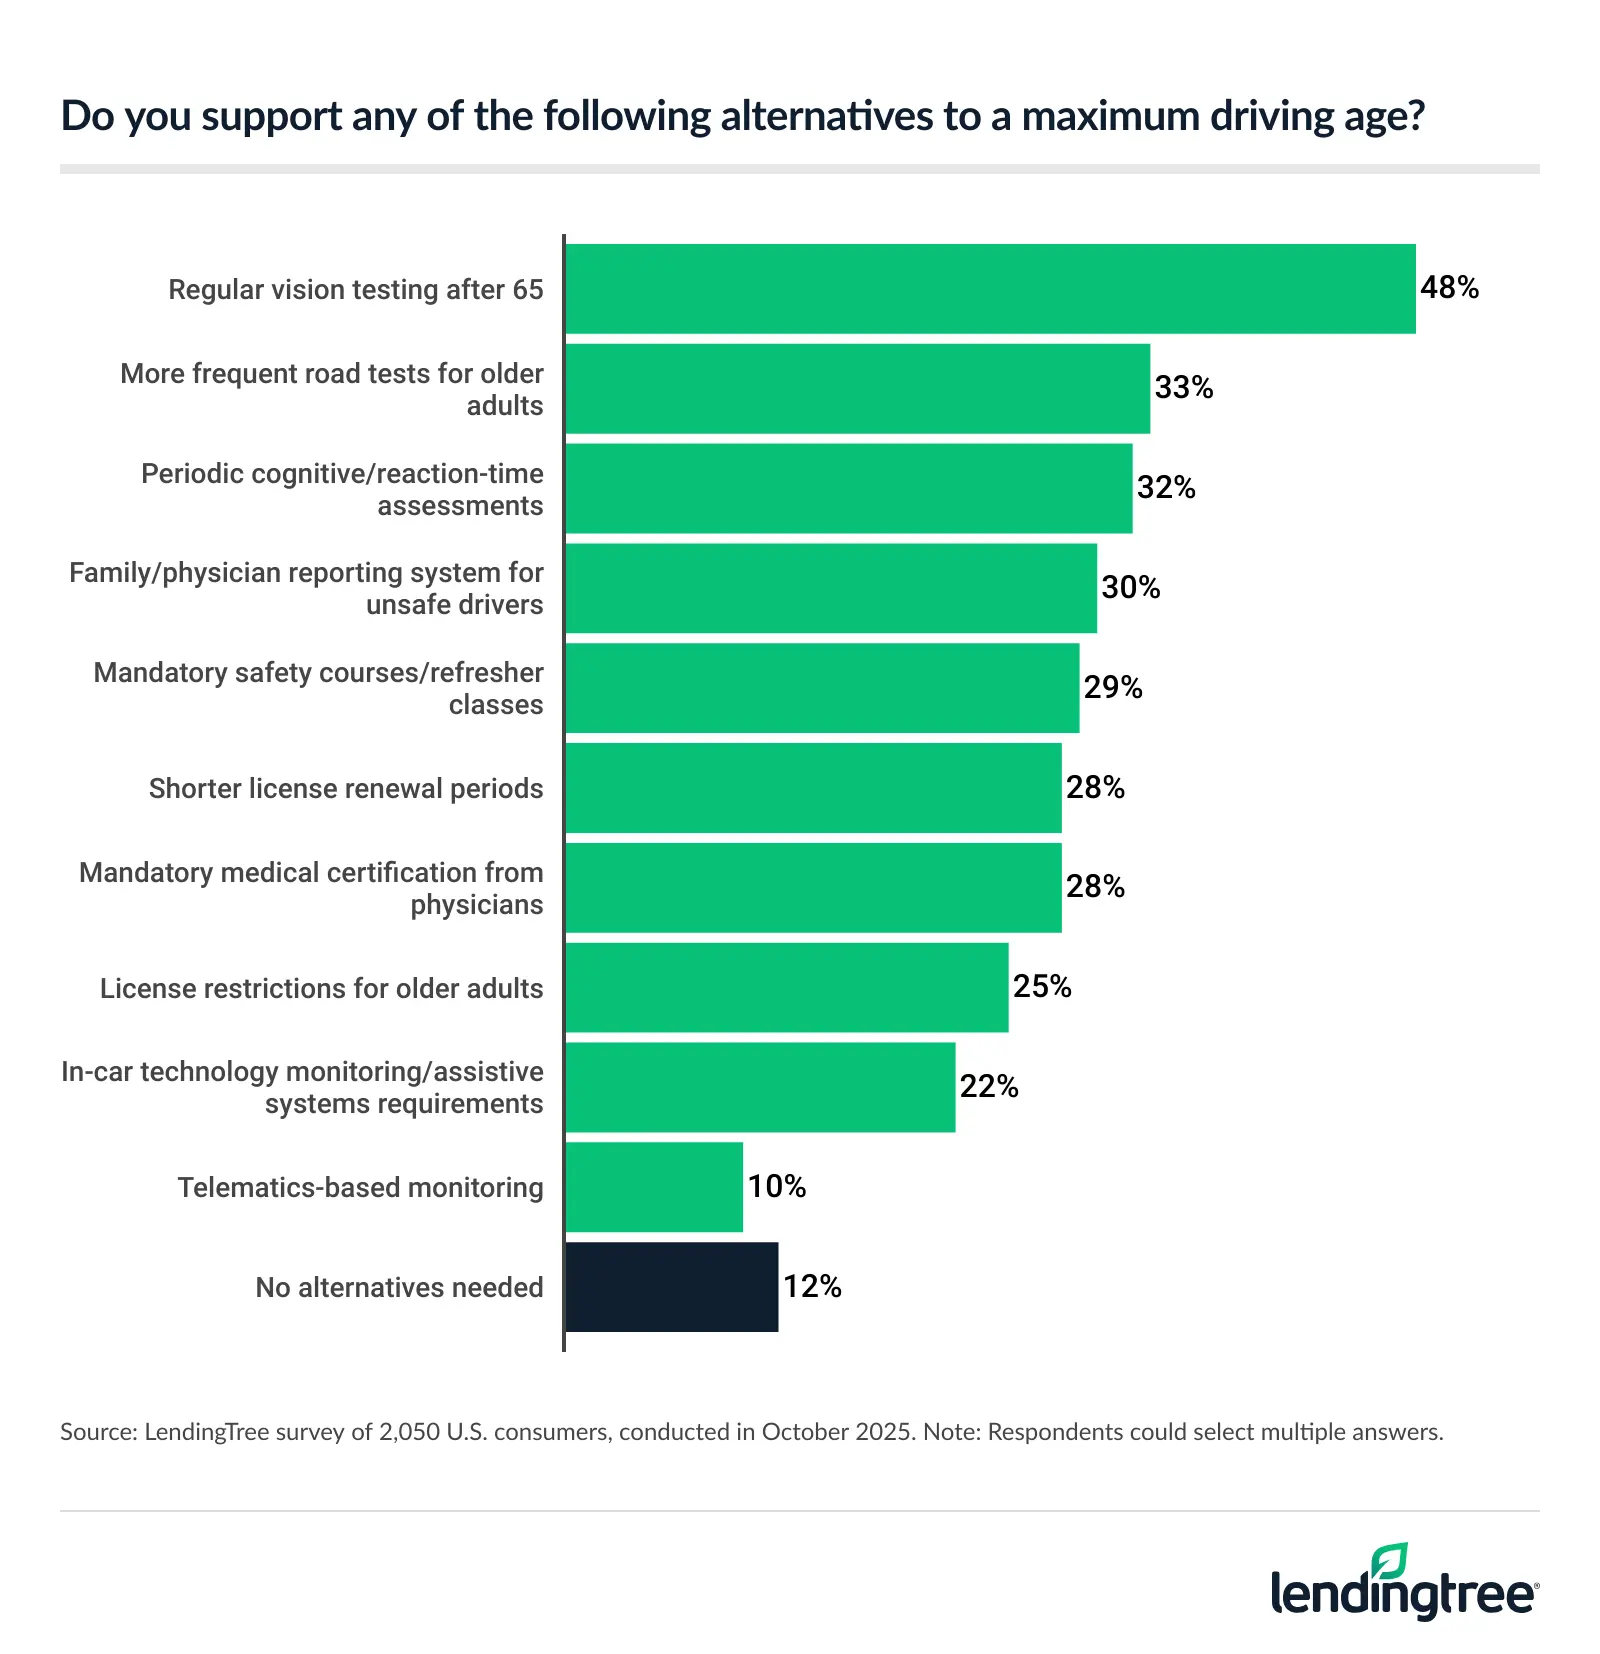
- Most Americans believe there could be alternative routes to safety. The most popular alternatives among Americans are regular vision testing after 65 (48%), frequent road tests for older adults (33%), periodic cognitive or reaction-time assessments (32%) and a family/physician reporting system for unsafe drivers (30%).
- The rate of older drivers involved in fatal crashes is lower than that among younger ones. According to a LendingTree analysis of National Highway Traffic Safety Administration (NHTSA) and Federal Highway Administration (FHWA) data, 41.7 drivers ages 16 to 20 were involved in fatal crashes in 2023 per 100,000 licensed drivers — significantly higher than the 16.2 rate among drivers 75 to 84 and the 18.4 rate among drivers 85 and older.
Americans believe driving should have maximum age limit
More than 6 in 10 Americans — 61% — believe there should be a legally defined maximum age for driving. (Perhaps unsurprisingly, younger generations are more likely to say so than older ones: 74% of millennials ages 29 to 44 and 71% of Gen Zers ages 18 to 28 want driving age limits, compared with 63% of Gen Xers ages 45 to 60 and 35% of baby boomers ages 61 to 79.)
When it comes to what that age should be, people who think there should be a maximum are somewhat scattered:
- 29%, the largest share, think it should be under 70
- 19% think it should be 70 to 74
- Another 19% think it should be 75 to 79
- 17% say 80 to 84
- 9% think 85 should be the age limit
- 7% think the age limit should be higher than 85
There’s no current universal driving age limit in the U.S., though certain states may have additional renewal requirements for older drivers. Additionally, Peru recently imposed a maximum license renewal age of 80, with only a few exceptions.
While we’ll address the validity of safety concerns surrounding older drivers later, age does impact auto insurance rates. “From the time you start driving, car insurance typically gets cheaper each year up until age 60, after which rates start to go back up,” explains Lindsay Bishop, LendingTree auto insurance expert and former auto insurance agent. “That’s because insurance companies believe older drivers are more likely to make an insurance claim or cause an accident in the future,” she goes on — just like many Americans do.
However, “Driving experience also plays a big part in the cost of car insurance.” That’s why a brand-new driver usually pays a lot more for car insurance than an older driver, even after their 60th birthday. “For example,” says Bishop, “the average cost of full coverage car insurance for an 85-year-old is $227 a month, while a 20-year-old driver pays $329 a month for the same coverage.”
Some believe older drivers are more dangerous than younger ones
For some consumers who believe there should be a maximum driving age, the underlying concern may be safety. More than a quarter, or 27%, of Americans say drivers 70 and older are somewhat or much more dangerous than younger drivers ages 16 to 25.
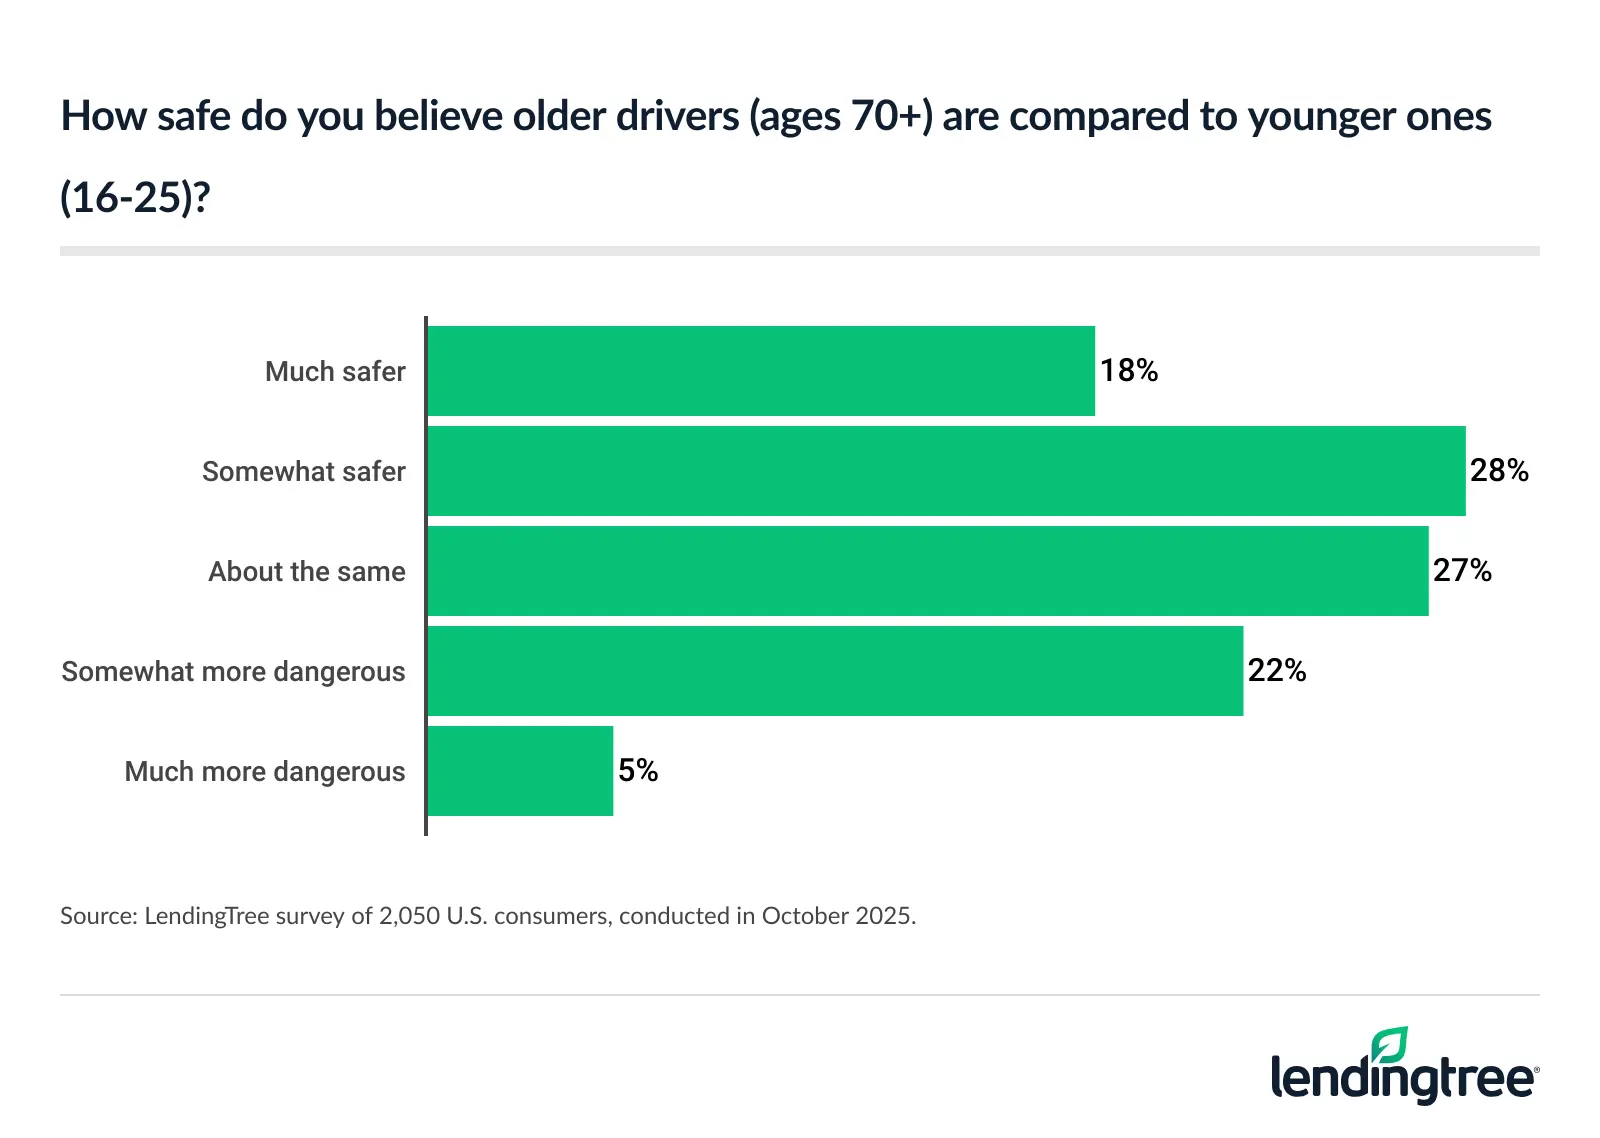
While more respondents — 46% — believe that older drivers are somewhat or much safer than younger ones, another 27% believe these two groups are about the same in terms of driving safety.
However, as we’ll see later, many of these beliefs aren’t reflective of reality.
Nearly 2 in 5 drivers have had bad experience with older driver
Drivers have pet peeves — and for many, older drivers seem to be among them.
Although most licensed drivers haven’t personally had a negative experience involving an older driver, 39% — or nearly 2 in 5 — have. (This statistic, too, varies widely by generation: 51% of both Gen Z and millennial drivers say they’ve had such an experience, compared with only 40% of Gen X and 18% of baby boomer drivers.)
Meanwhile, 52% of drivers affirm that they’ve not had a bad experience with an older driver, while 8% say they’re not sure or they can’t recall.
What’s more, 40% of Americans say they’ve had to intervene upon — that is, discourage or stop — an older friend’s or family member’s driving. Meanwhile, 44% say they’ve felt unsafe as a passenger while an older driver was behind the wheel.
Older drivers aren’t on the road as often as younger ones
Although a significant number of drivers report negative experiences with older drivers, older drivers simply aren’t on the road as often as younger ones.
While 92% of baby boomers have a valid driver’s license, only 37% of them say they drive daily — compared with 69% of millennial and 58% of Gen Z licensed drivers. Overall, 20% of licensed baby boomers say they drive only a few times per month or less, with 3% saying they never drive. (Only 12% of licensed Gen Zers drive a few times per month or less, and only 7% of millennials.)
Americans support additional testing for older drivers
Although the idea of a maximum driving age clearly has some momentum, Americans also have alternative ideas for keeping older drivers safely on the road.
The most popular, regular vision testing after 65, is supported by nearly half (48%) of Americans. Other popular options include more frequent road tests for older adults (33%) and periodic cognitive or reaction-time assessments (32%).
While additional testing may bring some drivers peace of mind, it doesn’t guarantee an improvement in driver safety. For instance, a vision test alone may not account for other age-related changes that could make older drivers unsafe, such as lengthening reaction times. And the tests may have unintended consequences — such as increasing older adults’ social isolation — if older drivers are required to stop driving based on such thresholds, even if the correlation between those thresholds and road safety is weak or unproven.
Fortunately, nearly two-thirds of respondents — 62% — say they’re somewhat or very confident that current state driving laws adequately address age-related driving safety. (Of course, that does mean that 38% aren’t very confident, aren’t at all confident or are unsure of their confidence in those state driving laws.)
Younger drivers more likely to be involved in fatal crashes
While, as discussed, many Americans are concerned about the safety record of older drivers, younger drivers are far more likely to be involved in fatal crashes. (In fact, according to another recent LendingTree study, Gen Zers are the worst drivers on the road, with the highest rates of both accidents and DUIs.)
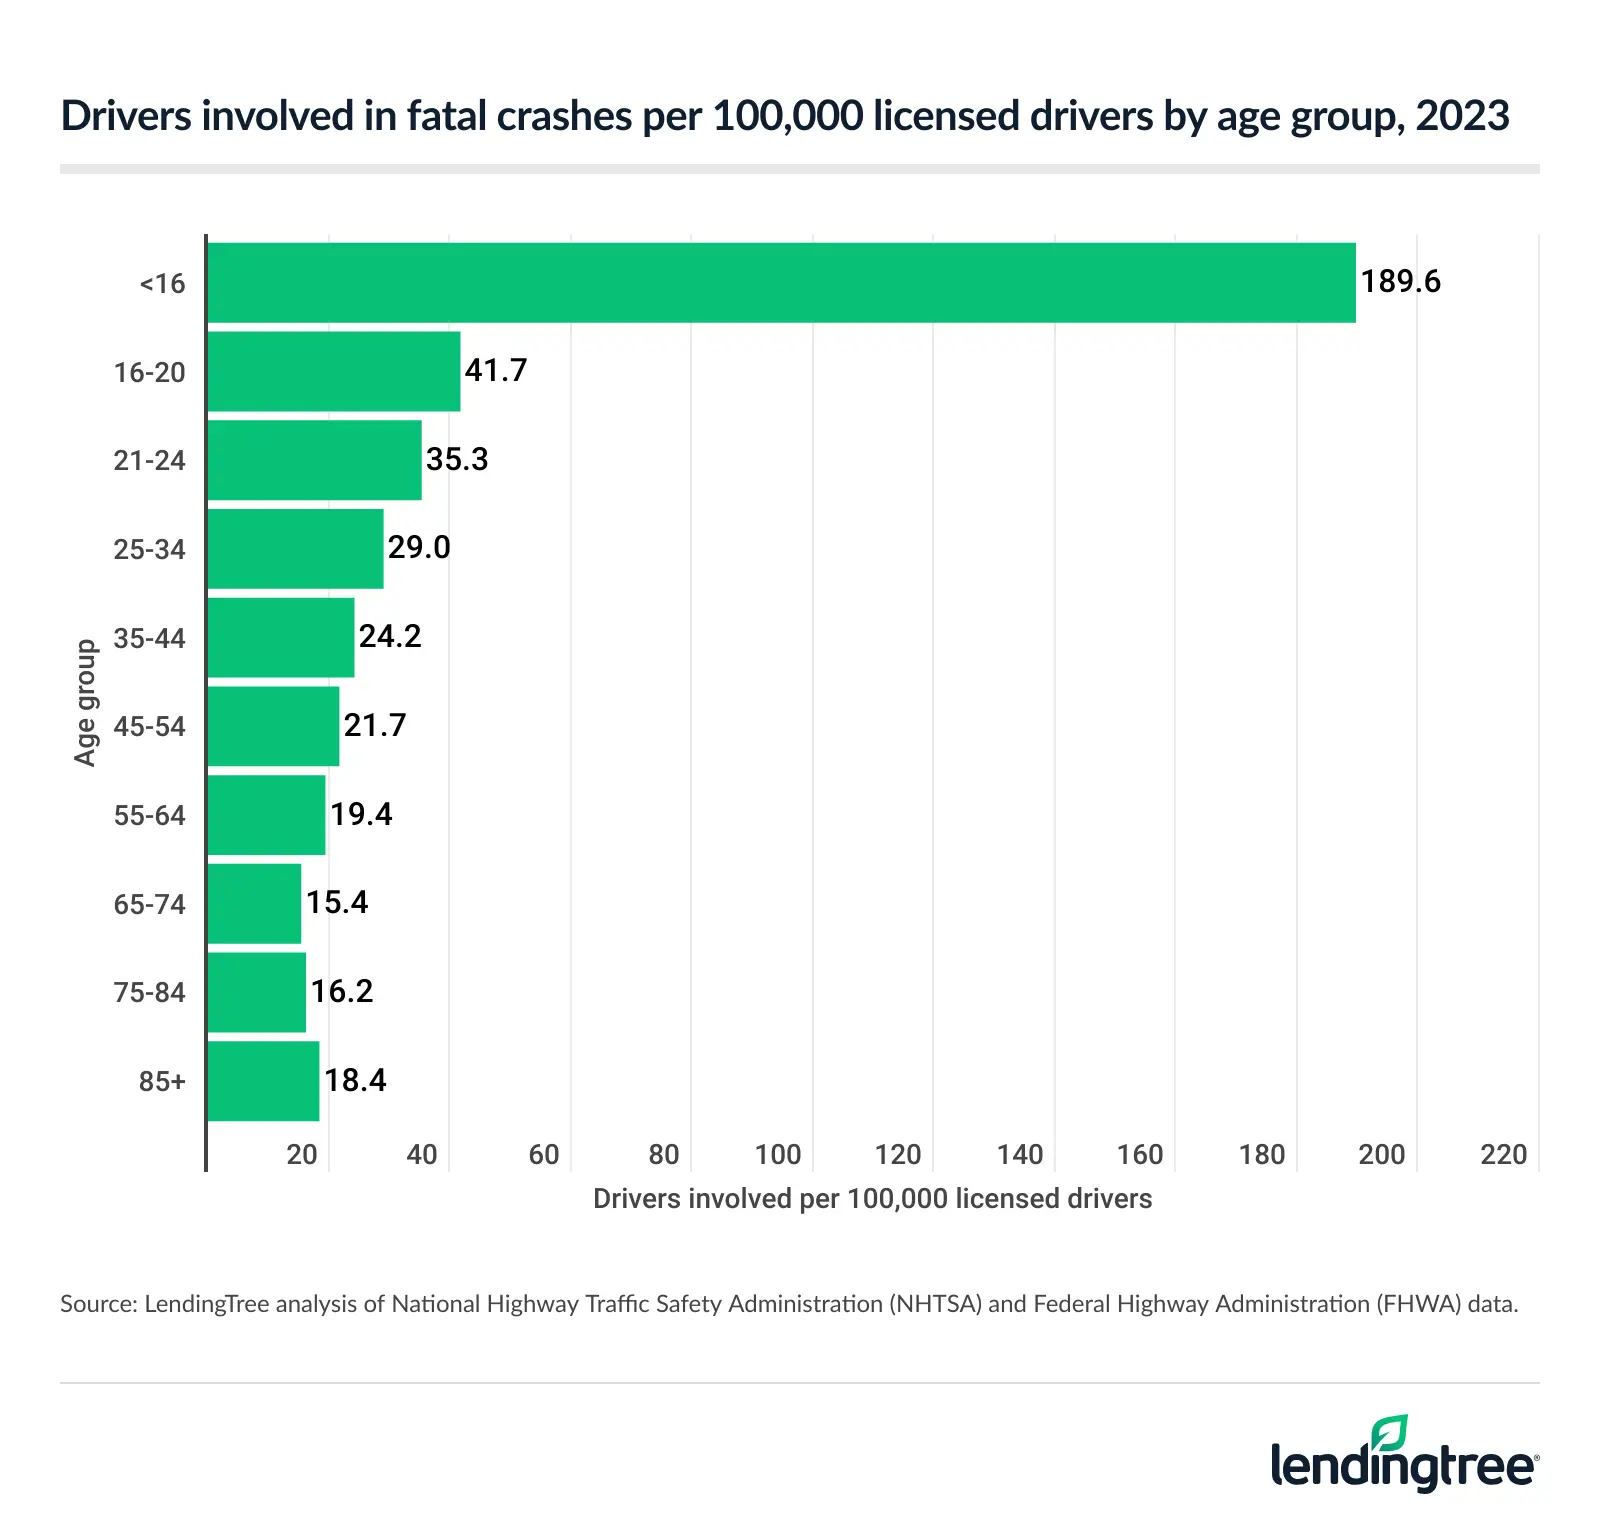
In 2023, drivers under 16 saw by far the highest rate of drivers involved in fatal crashes at 189.6 per 100,000 licensed drivers. From there, the fatal crash rate steadily decreases by age bracket as follows until age 75:
- 16-20: 41.7 drivers involved in fatal crashes per 100,000 licensed drivers
- 21-24: 35.3
- 25-34: 29.0
- 35-44: 24.2
- 45-54: 21.7
- 55-64: 19.4
- 65-74: 15.4
- 75-84: 16.2
- 85+: 18.4
Note that, although the rates are significantly higher for younger drivers, they begin to trend back up slightly when drivers reach the age of 75.
One 2016 study of reaction times across drivers ages 20 to 80 found that while reaction time did progressively increase with age, “A significant group of older drivers was identified who did not show the expected age-related decrease in performance.” In fact, “The high-performing quarter of elderly drivers performed equally well or better than younger drivers did.”
Americans’ misperception about the age of the most dangerous drivers on the road could be explained by ageism and stereotypes about older drivers. For instance, an entire episode of South Park uses the stereotype of inept older drivers — but, clearly, the truth is more nuanced.
Car insurance and older drivers: 3 expert tips
While it’s not the only factor, age is a significant metric in the algorithm that determines the price of your car insurance. If you’re an older driver — or one day hope to be — here are our expert tips for finding affordable coverage throughout your life.
- Shop around. “The easiest way for older drivers to find cheap car insurance is by shopping around for quotes from multiple companies,” Bishop says. And it’s definitely worth your time: “For a full coverage policy, there’s a difference of $301 per month between the cheapest and most expensive companies for older adults.”
- Take advantage of discounts. “Many companies offer discounts for older adults who take an approved defensive driving course,” Bishop explains. “Completing a driving course can usually save you between 5% and 20% off your car insurance bill.”
- Consider switching to a pay-per-mile program. “These plans consider how many miles you drive each month when calculating your car insurance rates,” Bishop says. “Retirees typically drive less than people who commute to an office, so a policy that charges you based on the amount you drive could save you a lot of money.” (Psst: If you’re not comfortable with a pay-per-mile plan, which usually requires you to install a tracking device in your car, some companies also offer low-mileage discounts if you drive fewer than 7,500 miles per year.)
Methodology
LendingTree commissioned QuestionPro to conduct an online survey of 2,050 U.S. consumers ages 18 to 79 from Oct. 9 to 13, 2025. The survey was administered using a nonprobability-based sample, and quotas were used to ensure the sample base represented the overall population. Researchers reviewed all responses for quality control.
We defined generations as the following ages in 2025:
- Generation Z: 18 to 28
- Millennials: 29 to 44
- Generation X: 45 to 60
- Baby boomers: 61 to 79
Separately, LendingTree researchers analyzed National Highway Traffic Safety Administration (NHTSA) Fatality Injury Reporting System Tool (FIRST) and Federal Highway Administration (FHWA) data to determine the rate of drivers involved in fatal crashes per 100,000 licensed drivers by age group.