2026 Home Insurance Stability Report


Rising construction costs, inflation and increasingly severe natural disasters have driven significant volatility in the home insurance market, leading to higher premiums and reduced coverage availability in some regions.
According to a LendingTree study analyzing five categories (rate changes, loss ratios, insurance costs as a percentage of household income, percentage of uninsured homes and market share), New England states have the most stable markets.
Here’s a closer look.
Key findings
- New England states Massachusetts, Vermont, New Hampshire and Maine have the most home insurance stability. These states have experienced among the lowest home insurance rate growth from 2020 to 2025 (ranging from 19.6% to 29.6%), lower percentages of homes without insurance coverage (ranging from 10.0% to 13.2%) and relatively small household insurance burdens.
- Louisiana, Iowa and Arkansas have the least stable home insurance markets. Louisiana and Iowa have the highest loss ratios (both at least 118.0%), while Iowa’s premiums have nearly doubled (96.0%) since 2020. And in Louisiana and Arkansas, uninsured levels are elevated, with roughly 1 in 5 owner-occupied homes lacking coverage.
- Colorado, Iowa and Minnesota have seen the steepest premium surges. Home insurance rates in Colorado doubled from 2020 to 2025 at 100.8%, ahead of Iowa (96.0%) and Minnesota (88.2%).
- Loss ratios highlight some of the most severe market pressures. Louisiana (142.8%), Iowa (118.0%) and Hawaii (112.5%) have the highest loss ratios, meaning insurers are paying significantly more in claims than they collect in premiums.
LendingTree researchers analyzed five indicators of home insurance market health across each state to identify the most and least stable markets. Researchers then applied weighted averages to account for the relative importance of each factor.
These indicators and their weighted averages were:
- Percentage change in home insurance rates, 2020-25 (25%)
- Loss ratio, 2020-24 (25%)
- Percentage of household income spent on home insurance (20%)
- Percentage of homes without insurance (15%)
- Market share among the top five insurers (15%)
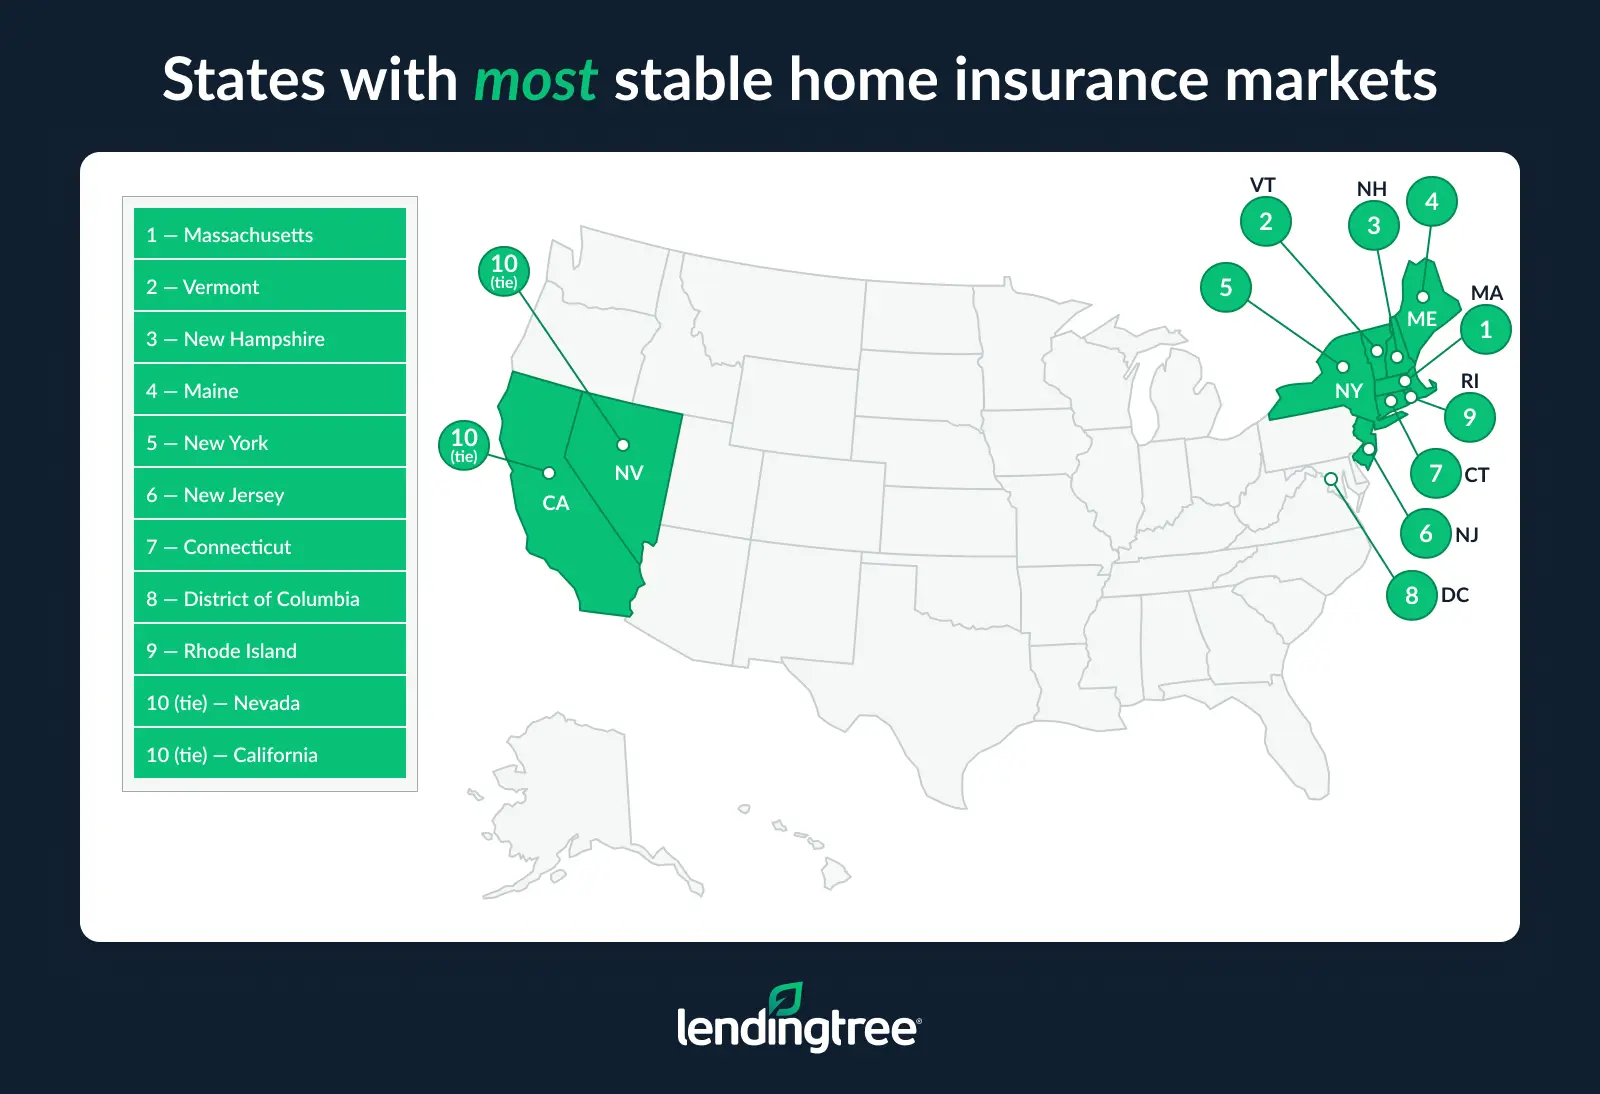
New England states have most stable home insurance markets
Those in New England — Massachusetts, Vermont, New Hampshire and Maine — haven’t experienced as much volatility in home insurance as those in other states have.
In fact, these states have seen among the lowest cumulative home insurance rate growth from 2020 to 2025, all ranking in the lowest 10 in this metric. Additionally, each of these New England states (except Maine) ranks among the 10 states with the lowest percentages of homes without insurance coverage. This is likely because home insurance is a smaller burden on households, with all (again, except Maine) ranking in the top 10 for states where households dedicate the smallest percentage of income to home insurance costs.
LendingTree home insurance expert and licensed insurance agent Rob Bhatt says New England hasn’t been affected by natural disasters as much as other areas, which may account for this stability.
“Insurance rates generally reflect insurance companies’ costs of covering claims in each state,” he says. “We haven’t seen the same level of destruction in these New England states. This has helped keep insurance companies’ expenses predictable, which has also helped keep rates stable for many of the area’s homeowners.”
Looking more broadly, the Northeast is the most stable home insurance region, with eight of the top 10 states with the strongest home insurance markets. These states all spend under 3.0% of their household income on insurance — well below the 50-state average of 3.7% — and loss ratios remain low, contributing to predictability for insurers and consumers.
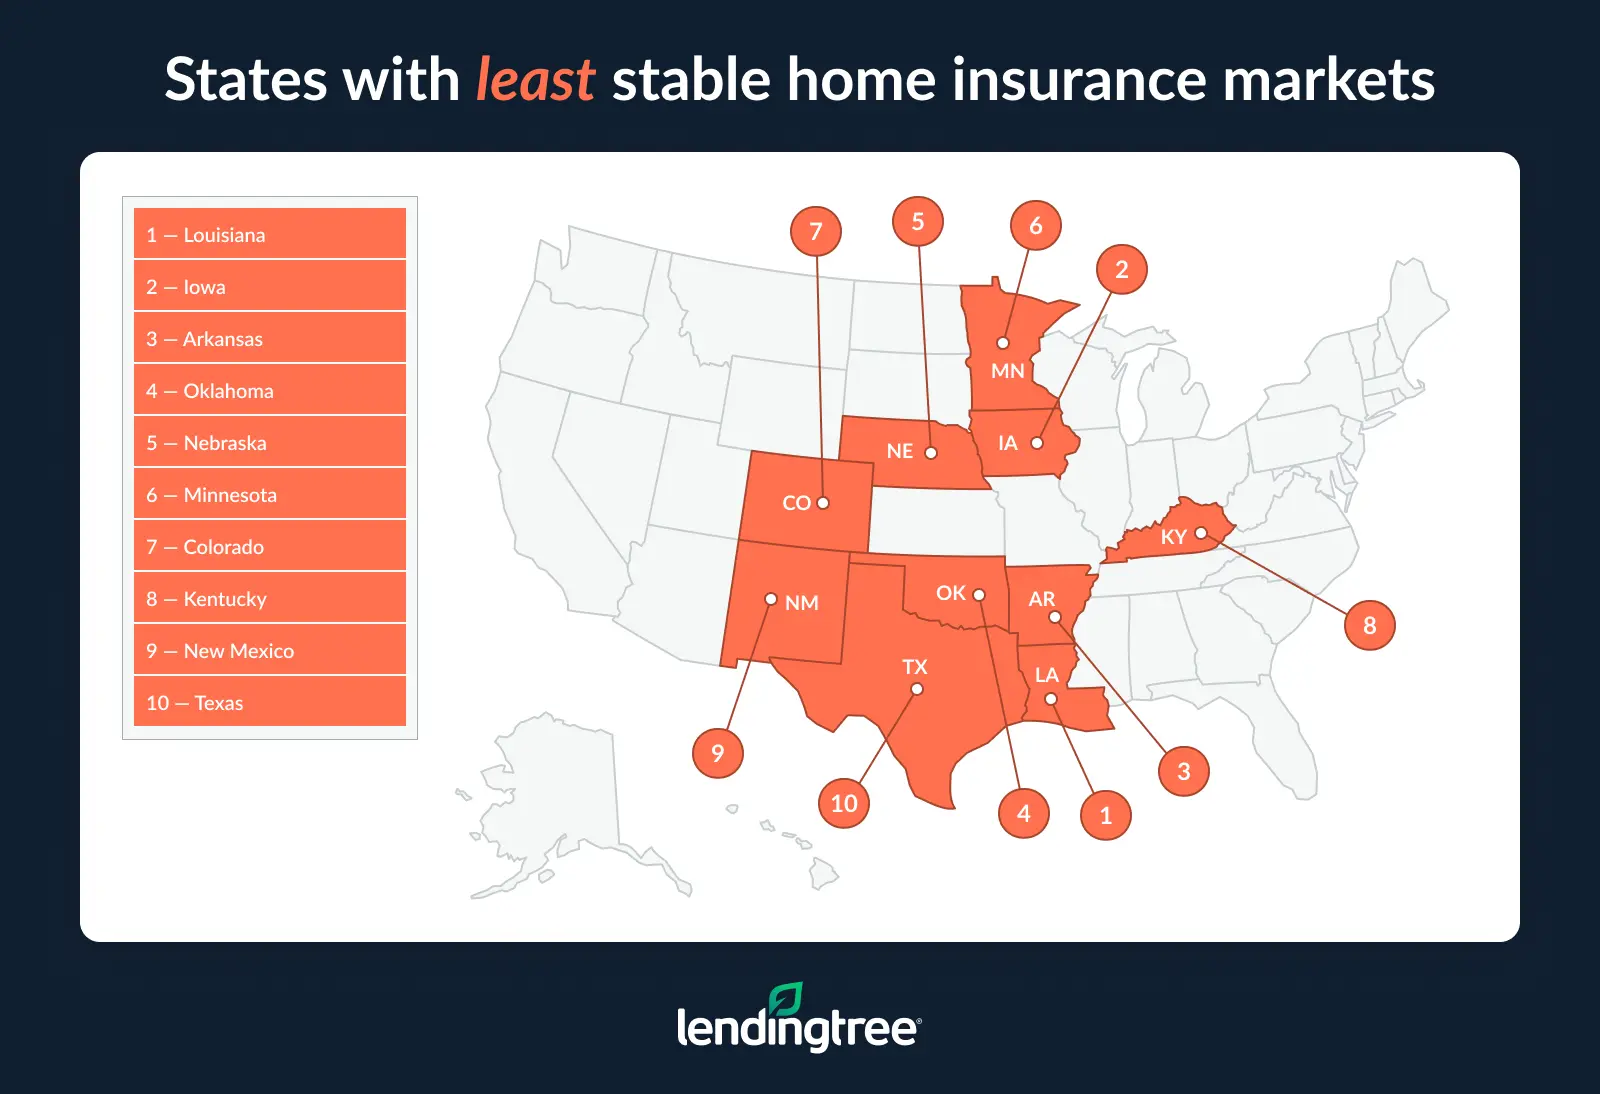
Louisiana, Iowa, Arkansas have least stable markets
Conversely, Louisiana, Iowa and Arkansas have the least stable home insurance markets.
Loss ratios (how much a company pays out in claims relative to how much in premiums it collects) largely determine this. Louisiana (142.8%) has the highest loss ratio by state, with Iowa (118.0%) close behind and Arkansas (99.8%) ranking fourth.
Louisiana and Arkansas also have elevated uninsured levels, at 21.2% and 19.1%, respectively.
Bhatt says it poses a huge risk for homeowners, though it also poses risks to the surrounding community.
“The cost of rebuilding your home after a disaster can be financially devastating without insurance,” he says. “The risks to communities are more indirect in nature. If many homes are abandoned or left unrepaired after a disaster, it may take a community longer to restore its quality of life. On a human level, having a large number of community members experience financial hardship can have an emotional toll on a community.”
Overall, the West and Midwest have volatile markets, dominating the list of 10 states that experienced the sharpest premium increases (with five in the West and five in the Midwest). These regions — along with the South — also have the highest loss ratios (with four of the top 10 in the Midwest and three each in the West and South).
These regions also have heavy cost burdens, with Southern states in particular spending the highest percentage of income on home insurance. While seven of the 10 states spending the highest share of income are in the South, two are in the Midwest and one is in the West.
Full rankings: States with most stable home insurance markets
| Rank | State | % change in home insurance rates, 2020-25 | Loss ratio, 2020-24 | % of homes w/out insurance | Market share, top 5 insurers | % of household income on home insurance | Avg. score |
|---|---|---|---|---|---|---|---|
| 1 | Massachusetts | 29.6% | 39.2% | 10.7% | 38.2% | 1.8% | 92.7 |
| 2 | Vermont | 19.6% | 45.5% | 10.7% | 49.6% | 1.6% | 91.3 |
| 3 | New Hampshire | 26.9% | 45.5% | 10.0% | 46.5% | 1.8% | 90.4 |
| 4 | Maine | 20.0% | 43.2% | 13.2% | 43.7% | 2.4% | 89.0 |
| 5 | New York | 25.5% | 51.2% | 12.0% | 51.7% | 2.2% | 84.8 |
| 6 | New Jersey | 32.1% | 59.7% | 11.2% | 47.2% | 1.7% | 84.2 |
| 7 | Connecticut | 39.4% | 56.2% | 11.4% | 39.2% | 2.7% | 82.4 |
| 8 | District of Columbia | 32.9% | 52.2% | 10.8% | 70.4% | 1.6% | 79.5 |
| 9 | Rhode Island | 45.6% | 50.5% | 12.3% | 45.8% | 2.7% | 79.1 |
| 10 | Nevada | 30.4% | 59.8% | 13.6% | 57.0% | 2.0% | 78.5 |
| 10 | California | 53.7% | 51.9% | 11.3% | 53.3% | 1.3% | 78.5 |
| 12 | Delaware | 33.9% | 57.1% | 13.0% | 59.7% | 1.9% | 78.1 |
| 13 | Pennsylvania | 33.4% | 59.8% | 11.9% | 62.4% | 2.5% | 76.7 |
| 14 | Virginia | 41.4% | 54.9% | 11.8% | 59.4% | 2.7% | 75.9 |
| 15 | Maryland | 47.3% | 66.5% | 11.0% | 62.5% | 1.8% | 73.4 |
| 16 | South Carolina | 28.9% | 65.5% | 15.6% | 48.5% | 4.6% | 71.9 |
| 17 | North Dakota | 39.9% | 54.4% | 16.5% | 53.9% | 3.7% | 70.7 |
| 18 | Ohio | 46.4% | 70.2% | 12.7% | 53.7% | 3.1% | 70.5 |
| 19 | Washington | 55.4% | 71.2% | 11.3% | 63.6% | 1.6% | 69.5 |
| 20 | Idaho | 52.8% | 65.2% | 12.4% | 61.9% | 2.7% | 68.6 |
| 21 | Indiana | 44.1% | 66.9% | 14.1% | 55.8% | 3.7% | 68.5 |
| 21 | Wisconsin | 48.7% | 73.1% | 13.4% | 55.4% | 2.8% | 68.5 |
| 23 | North Carolina | 46.9% | 64.2% | 13.9% | 53.4% | 4.6% | 67.2 |
| 24 | Hawaii | 32.8% | 112.5% | 11.9% | 68.8% | 0.6% | 66.6 |
| 25 | Michigan | 40.8% | 71.7% | 15.0% | 61.4% | 3.4% | 66.4 |
| 26 | Utah | 77.2% | 72.3% | 11.3% | 52.3% | 1.6% | 65.9 |
| 27 | Oregon | 56.5% | 87.4% | 9.7% | 64.9% | 2.2% | 65.1 |
| 27 | Alaska | 24.9% | 58.2% | 20.6% | 88.4% | 1.5% | 65.1 |
| 29 | Tennessee | 42.9% | 73.0% | 14.1% | 61.9% | 4.0% | 65.0 |
| 30 | Georgia | 40.2% | 84.5% | 13.7% | 62.4% | 3.6% | 64.2 |
| 31 | Missouri | 45.5% | 73.4% | 13.8% | 58.7% | 4.7% | 63.6 |
| 32 | West Virginia | 19.2% | 57.0% | 23.9% | 70.0% | 4.1% | 63.0 |
| 33 | Kansas | 42.6% | 55.6% | 13.8% | 60.2% | 7.2% | 62.7 |
| 34 | Florida | 49.5% | 71.7% | 19.4% | 37.1% | 5.0% | 62.5 |
| 35 | Montana | 56.5% | 61.8% | 14.9% | 68.4% | 4.1% | 60.5 |
| 36 | Arizona | 71.0% | 65.8% | 15.1% | 56.3% | 3.2% | 60.4 |
| 37 | Alabama | 41.2% | 63.3% | 18.9% | 67.6% | 4.8% | 59.1 |
| 38 | Illinois | 68.0% | 78.8% | 11.4% | 66.2% | 3.3% | 59.0 |
| 39 | Mississippi | 34.6% | 70.6% | 20.2% | 57.4% | 7.1% | 55.7 |
| 40 | South Dakota | 62.8% | 83.2% | 17.6% | 53.5% | 4.7% | 53.5 |
| 41 | Texas | 55.9% | 71.2% | 17.7% | 59.2% | 6.5% | 52.5 |
| 42 | New Mexico | 45.8% | 76.0% | 23.0% | 67.4% | 4.9% | 50.1 |
| 43 | Kentucky | 46.3% | 81.1% | 17.4% | 68.1% | 7.2% | 49.1 |
| 44 | Colorado | 100.8% | 81.6% | 9.7% | 67.2% | 4.6% | 46.7 |
| 45 | Minnesota | 88.2% | 98.1% | 12.4% | 63.2% | 4.2% | 45.9 |
| 46 | Nebraska | 72.2% | 89.2% | 12.8% | 59.8% | 7.7% | 45.3 |
| 47 | Oklahoma | 54.5% | 73.3% | 18.3% | 66.9% | 9.3% | 43.2 |
| 48 | Arkansas | 56.2% | 99.8% | 19.1% | 67.4% | 6.0% | 42.8 |
| 49 | Iowa | 96.0% | 118.0% | 13.5% | 59.6% | 3.6% | 40.0 |
| 50 | Louisiana | 41.5% | 142.8% | 21.2% | 60.3% | 6.6% | 35.4 |
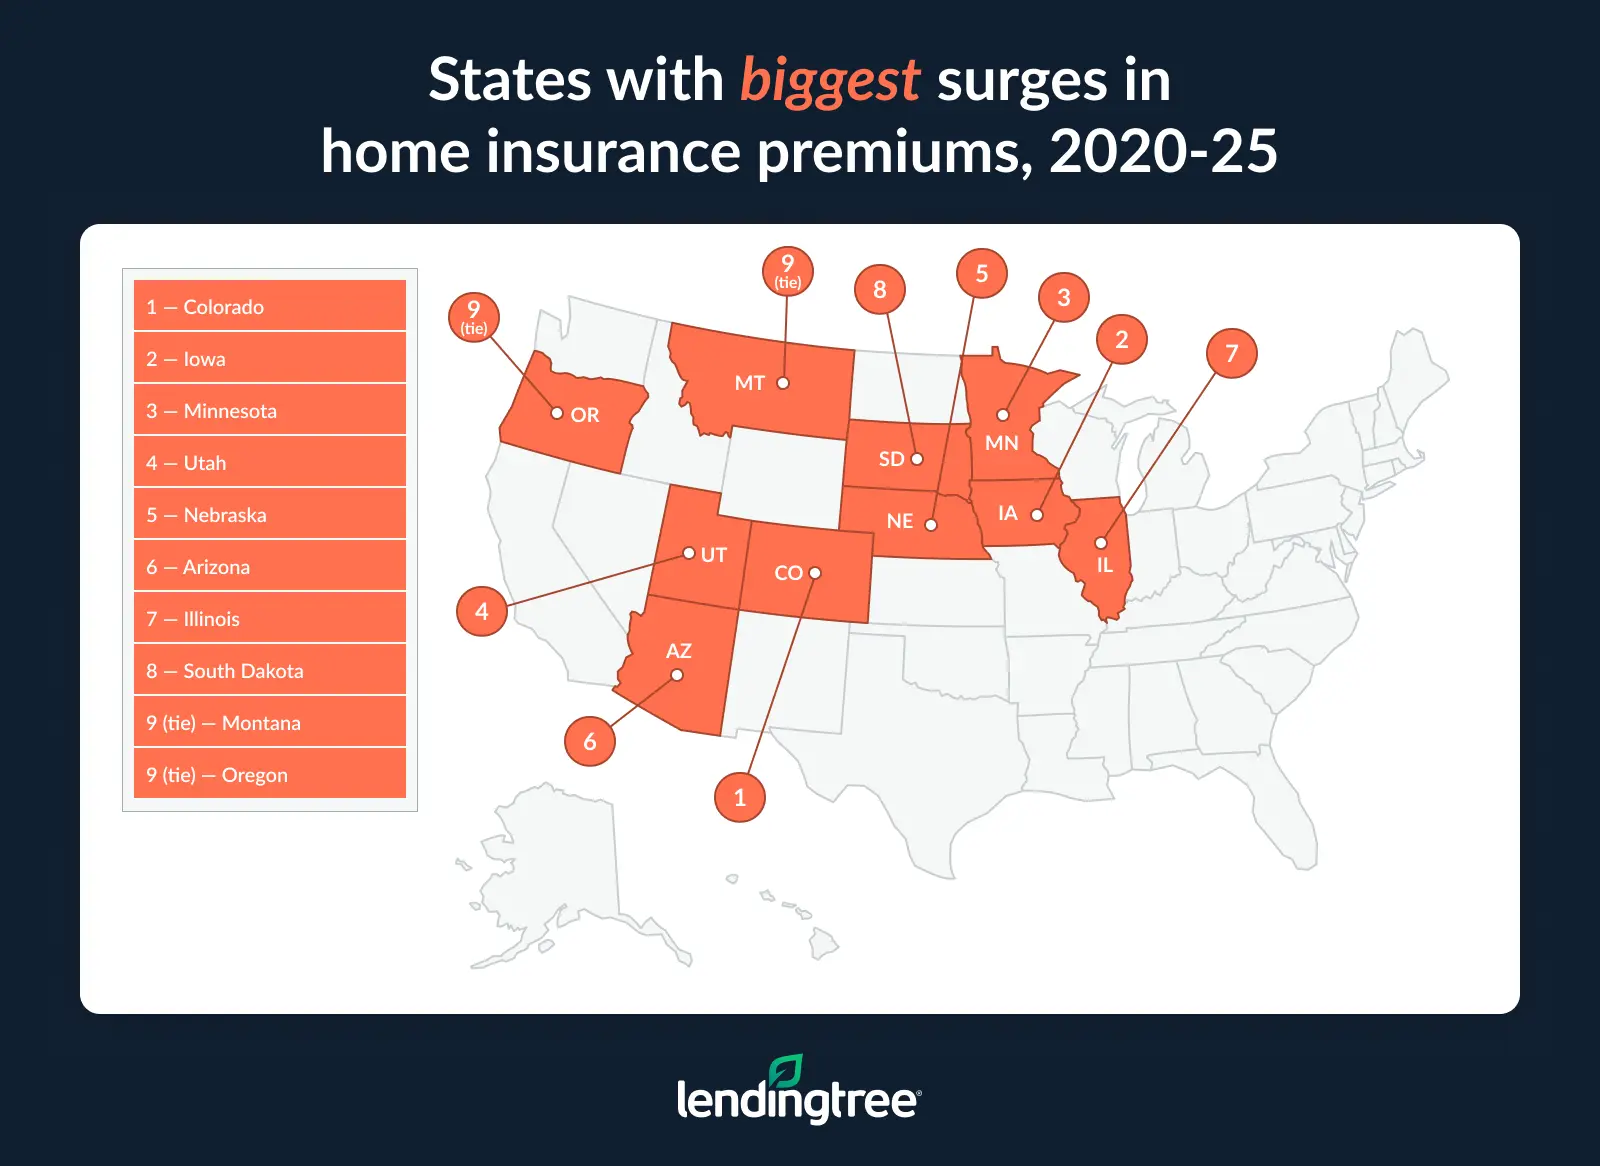
Insurance rates have doubled in Colorado
Colorado, Iowa and Minnesota have seen the steepest premium surges. Home insurance rates in Colorado doubled from 2020 to 2025 — 100.8% cumulatively — ahead of Iowa (96.0%) and Minnesota (88.2%).
Bhatt believes the primary factors behind the steep premium surges in the first half of this decade were increased natural disasters and inflation.
“Insurance companies had to pay to rebuild more homes than normal, and the cost of repairing each one was more expensive,” he says. “That said, 2025 was a relatively calm year on the disaster front, and inflation has calmed down. This is creating optimism that we may see rates stabilize, at least for a while. Of course, any future uptick in disasters, inflation or both could roil the home insurance marketplace once again.”
2025 was a relatively calm year on the disaster front, and inflation has calmed down. This is creating optimism that we may see rates stabilize, at least for a while.

Meanwhile, West Virginia has seen premiums rise just 19.2% — the lowest by state. Vermont (19.6%) and Maine (20.0%) follow.
Full rankings: % change in home insurance rates by state, 2020-25
| Rank | State | % change |
|---|---|---|
| 1 | West Virginia | 19.2% |
| 2 | Vermont | 19.6% |
| 3 | Maine | 20.0% |
| 4 | Alaska | 24.9% |
| 5 | New York | 25.5% |
| 6 | New Hampshire | 26.9% |
| 7 | South Carolina | 28.9% |
| 8 | Massachusetts | 29.6% |
| 9 | Nevada | 30.4% |
| 10 | New Jersey | 32.1% |
| 11 | Hawaii | 32.8% |
| 12 | District of Columbia | 32.9% |
| 13 | Pennsylvania | 33.4% |
| 14 | Delaware | 33.9% |
| 15 | Mississippi | 34.6% |
| 16 | Connecticut | 39.4% |
| 17 | North Dakota | 39.9% |
| 18 | Georgia | 40.2% |
| 19 | Michigan | 40.8% |
| 20 | Alabama | 41.2% |
| 21 | Virginia | 41.4% |
| 22 | Louisiana | 41.5% |
| 23 | Kansas | 42.6% |
| 24 | Tennessee | 42.9% |
| 25 | Indiana | 44.1% |
| 26 | Missouri | 45.5% |
| 27 | Rhode Island | 45.6% |
| 28 | New Mexico | 45.8% |
| 29 | Kentucky | 46.3% |
| 30 | Ohio | 46.4% |
| 31 | North Carolina | 46.9% |
| 32 | Maryland | 47.3% |
| 33 | Wisconsin | 48.7% |
| 34 | Florida | 49.5% |
| 35 | Idaho | 52.8% |
| 36 | California | 53.7% |
| 37 | Oklahoma | 54.5% |
| 38 | Washington | 55.4% |
| 39 | Texas | 55.9% |
| 40 | Arkansas | 56.2% |
| 41 | Oregon | 56.5% |
| 41 | Montana | 56.5% |
| 43 | South Dakota | 62.8% |
| 44 | Illinois | 68.0% |
| 45 | Arizona | 71.0% |
| 46 | Nebraska | 72.2% |
| 47 | Utah | 77.2% |
| 48 | Minnesota | 88.2% |
| 49 | Iowa | 96.0% |
| 50 | Colorado | 100.8% |
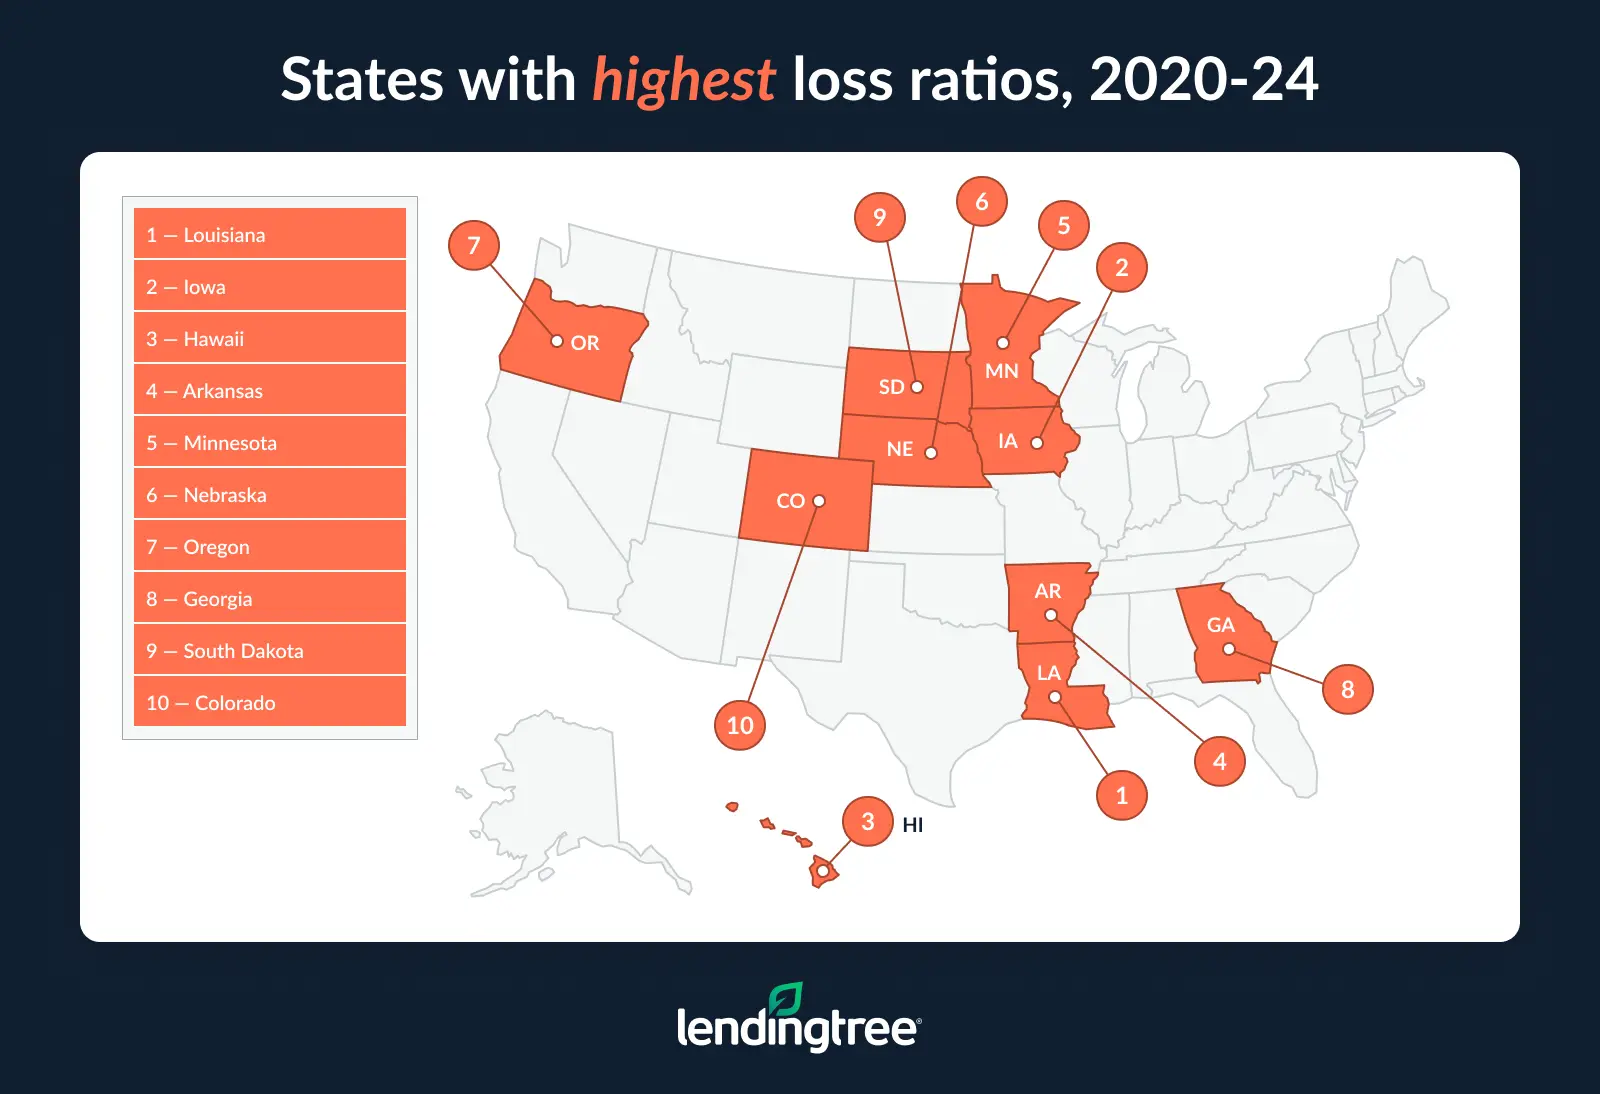
Louisiana has highest loss ratio
In some states, home insurance markets are more significantly affected by loss ratios. Louisiana has the highest loss ratio at 142.8%, with insurers paying more in claims than they collect in premiums.
Loss ratios highlight some of the most severe market pressures. Louisiana (142.8%), Iowa (118.0%) and Hawaii (112.5%) have the highest loss ratios.
Bhatt says this may lead to increased premiums down the line.
“Insurance companies are usually pretty diligent about restoring profitability in states where their loss ratios get too high,” he says. “The most common steps they take to do this include raising their rates and dropping homes they consider too risky to insure. Unfortunately, steps like these create hardships for homeowners. In addition to higher insurance rates, they can make it harder for some homeowners to even get insurance.”
Meanwhile, Massachusetts has the lowest loss ratio, at just 39.2%. Maine (43.2%) follows, with Vermont and New Hampshire tying for third at 45.5%.
Full rankings: Loss ratio by state, 2020-24
| Rank | State | Loss ratio, 2020-24 |
|---|---|---|
| 1 | Massachusetts | 39.2% |
| 2 | Maine | 43.2% |
| 3 | Vermont | 45.5% |
| 3 | New Hampshire | 45.5% |
| 5 | Rhode Island | 50.5% |
| 6 | Wyoming | 51.1% |
| 7 | New York | 51.2% |
| 8 | California | 51.9% |
| 9 | District of Columbia | 52.2% |
| 10 | North Dakota | 54.4% |
| 11 | Virginia | 54.9% |
| 12 | Kansas | 55.6% |
| 13 | Connecticut | 56.2% |
| 14 | West Virginia | 57.0% |
| 15 | Delaware | 57.1% |
| 16 | Alaska | 58.2% |
| 17 | New Jersey | 59.7% |
| 18 | Pennsylvania | 59.8% |
| 18 | Nevada | 59.8% |
| 20 | Montana | 61.8% |
| 21 | Alabama | 63.3% |
| 22 | North Carolina | 64.2% |
| 23 | Idaho | 65.2% |
| 24 | South Carolina | 65.5% |
| 25 | Arizona | 65.8% |
| 26 | Maryland | 66.5% |
| 27 | Indiana | 66.9% |
| 28 | Ohio | 70.2% |
| 29 | Mississippi | 70.6% |
| 30 | Washington | 71.2% |
| 30 | Texas | 71.2% |
| 32 | Michigan | 71.7% |
| 32 | Florida | 71.7% |
| 34 | Utah | 72.3% |
| 35 | Tennessee | 73.0% |
| 36 | Wisconsin | 73.1% |
| 37 | Oklahoma | 73.3% |
| 38 | Missouri | 73.4% |
| 39 | New Mexico | 76.0% |
| 40 | Illinois | 78.8% |
| 41 | Kentucky | 81.1% |
| 42 | Colorado | 81.6% |
| 43 | South Dakota | 83.2% |
| 44 | Georgia | 84.5% |
| 45 | Oregon | 87.4% |
| 46 | Nebraska | 89.2% |
| 47 | Minnesota | 98.1% |
| 48 | Arkansas | 99.8% |
| 49 | Hawaii | 112.5% |
| 50 | Iowa | 118.0% |
| 51 | Louisiana | 142.8% |
Keeping insurance affordable: Top expert tips
If your home insurance premiums have increased dramatically over the years, you’re not alone. Bhatt says there are a few things to keep in mind to help manage your premiums.
- While appealing a premium jump is difficult, it’s not impossible. “It’s tough to appeal a sudden premium jump, per se, but it’s good to ask your agent why your rate has gone up,” he says. “In some cases, your insurance company may have inaccurate information about you or your home. Your agent can correct any erroneous information and also check to see if you qualify for any discounts that may have previously been overlooked.”
- You can also discuss options for lowering your rate. Increasing your deductible or dropping coverage you no longer need can be an alternative to lowering your rate, though understanding the risks involved is key.
- Shop around every few years. “Each company places different weights on the factors they use to determine your rate, like your home’s features, your location and your credit,” Bhatt says. “Your own rate qualifications also change from time to time, especially after your credit improves or a prior claim comes off your record. Getting quotes from a few different companies helps you find the cheapest company for your current situation, which may be different from what it was the last time you shopped for insurance.”
Methodology
LendingTree researchers analyzed five indicators of home insurance market health across each state to identify the most and least stable home insurance markets in the country.
These indicators were:
- Percentage change in home insurance rates, 2020-25
- Loss ratio, 2020-24
- Percentage of homes without insurance
- Market share among the top five insurers
- Percentage of household income on home insurance
LendingTree researchers analyzed home insurance data, pulled in January 2024, from Quadrant Information Services. These rates were publicly sourced from insurer filings and should be used for comparative purposes only. Your quotes will likely differ. The following coverages and deductibles were used unless otherwise noted:
- $400,000 dwelling coverage
- $40,000 other structures
- $200,000 personal property
- $80,000 loss of use coverage
- $100,000 liability
- $5,000 medical payments
- $1,000 deductible
Additionally, LendingTree researchers analyzed the U.S. Census Bureau 2024 American Community Survey (ACS) with one-year estimates — the latest available — to gather data on homes and their annual home insurance costs.
Owner-occupied homes with annual home insurance costs of less than $100 were classified as uninsured. The number of owner-occupied homes that paid less than $100 in annual home insurance costs in 2024 was divided by the total number of owner-occupied homes to calculate the percentage of uninsured homes. This was done by state.
Home insurance rate changes, loss ratios and insurer market share data were compiled using RateWatch from S&P Global, which uses annual information from the National Association of Insurance Commissioners (NAIC).
Each state was scored from 0 to 100 across the five categories. For each category, the highest-performing state received a score of 100 and the lowest received a score of 0, with all others scaled proportionally between the two. Higher scores reflect stronger, more affordable and more stable home insurance markets.
Researchers then applied weighted averages to account for the relative importance of each factor:
- Rate changes and loss ratios each made up 25% of a state’s final score (50% total)
- Insurance costs as a percentage of household income accounted for 20%
- The uninsured homes percentage and the market share percentage each made up 15% (30% total)