Nearly 1 in 7 Homes Across US Are Uninsured
Houses are often Americans’ biggest investment, but many don’t have the proper safety nets to protect them. In fact, 12.2 million U.S. owner-occupied homes are uninsured, according to LendingTree research, leaving these homeowners vulnerable to disasters.
Here’s a look at where the rate of uninsured homes is highest, plus our top tips on finding the best home insurance rates.
- Nearly 1 in 7 homes across the U.S. are uninsured. Overall, 12.2 million of 86.6 million owner-occupied homes are uninsured. That translates to 14.1%.
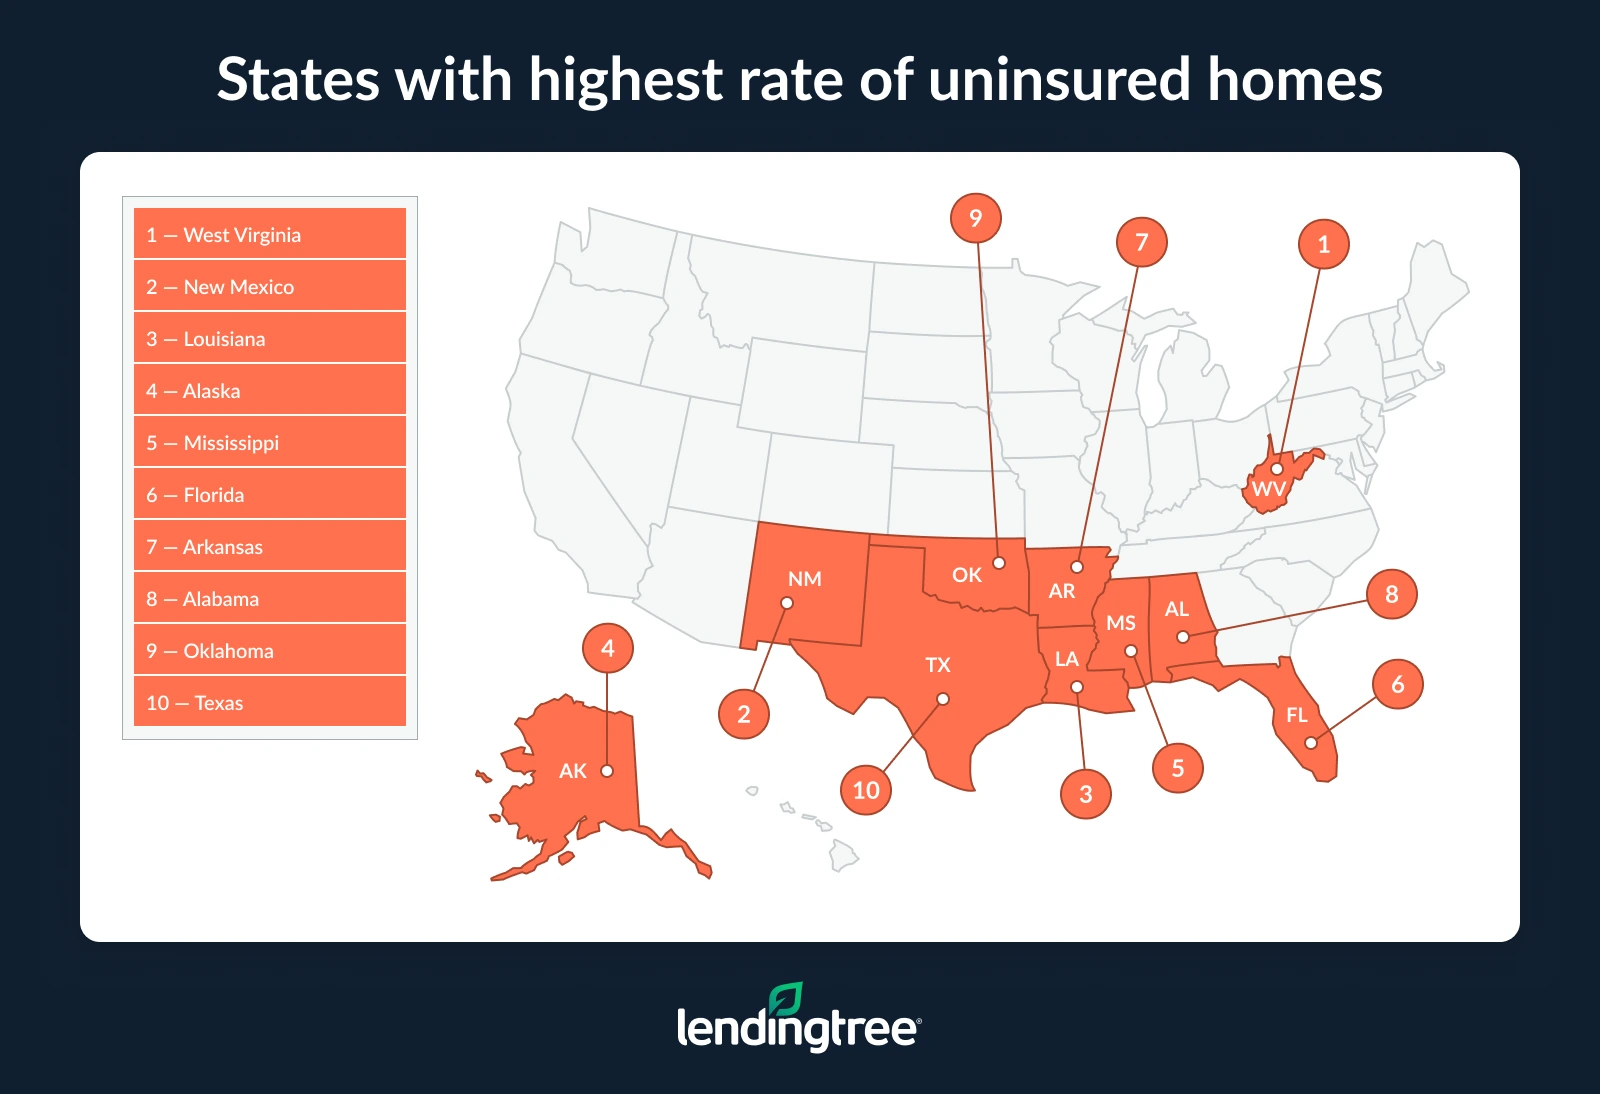
- West Virginia has the highest rate of uninsured homes. 23.9% of homes in the state don’t have insurance coverage, ahead of New Mexico (23.0%) and Louisiana (21.2%).
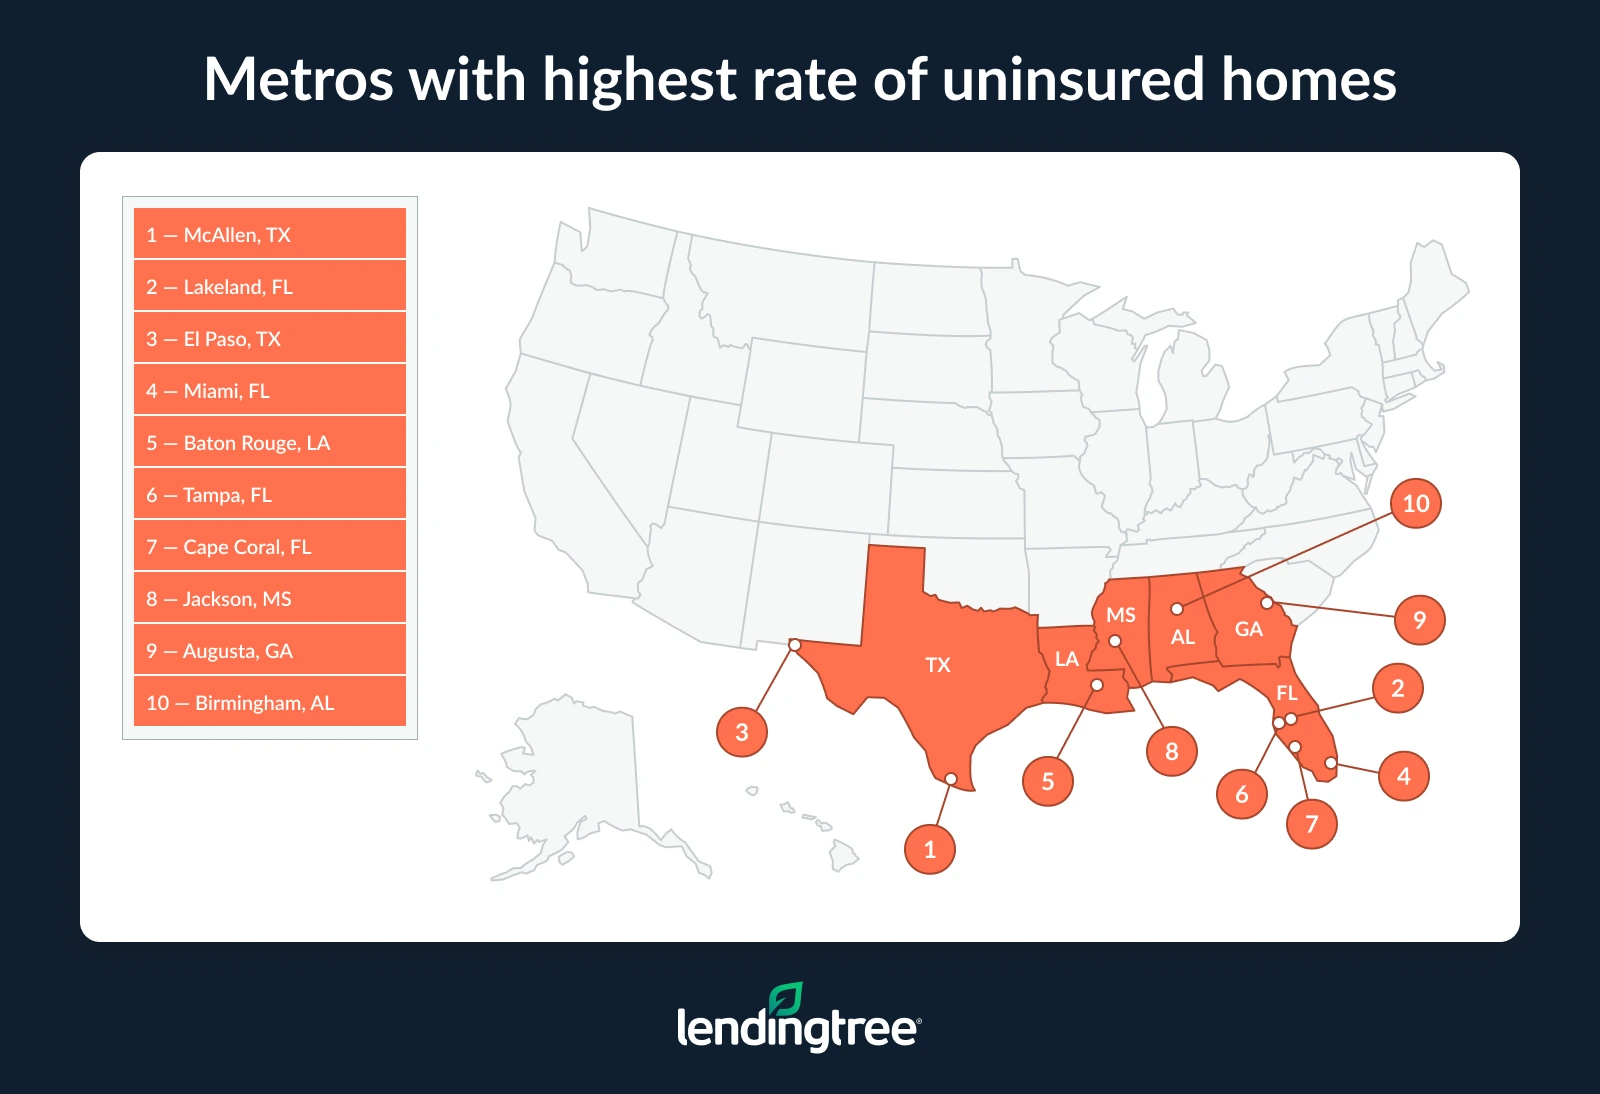
- Among the largest U.S. metros, McAllen, Texas, has the highest uninsured rate — by a wide margin. 41.5% of homes in the Texas metro don’t have home insurance, which is nearly 14 percentage points higher than the next metro on the list, Lakeland, Fla., at 27.8%. El Paso, Texas (24.0%), rounds out the top three.
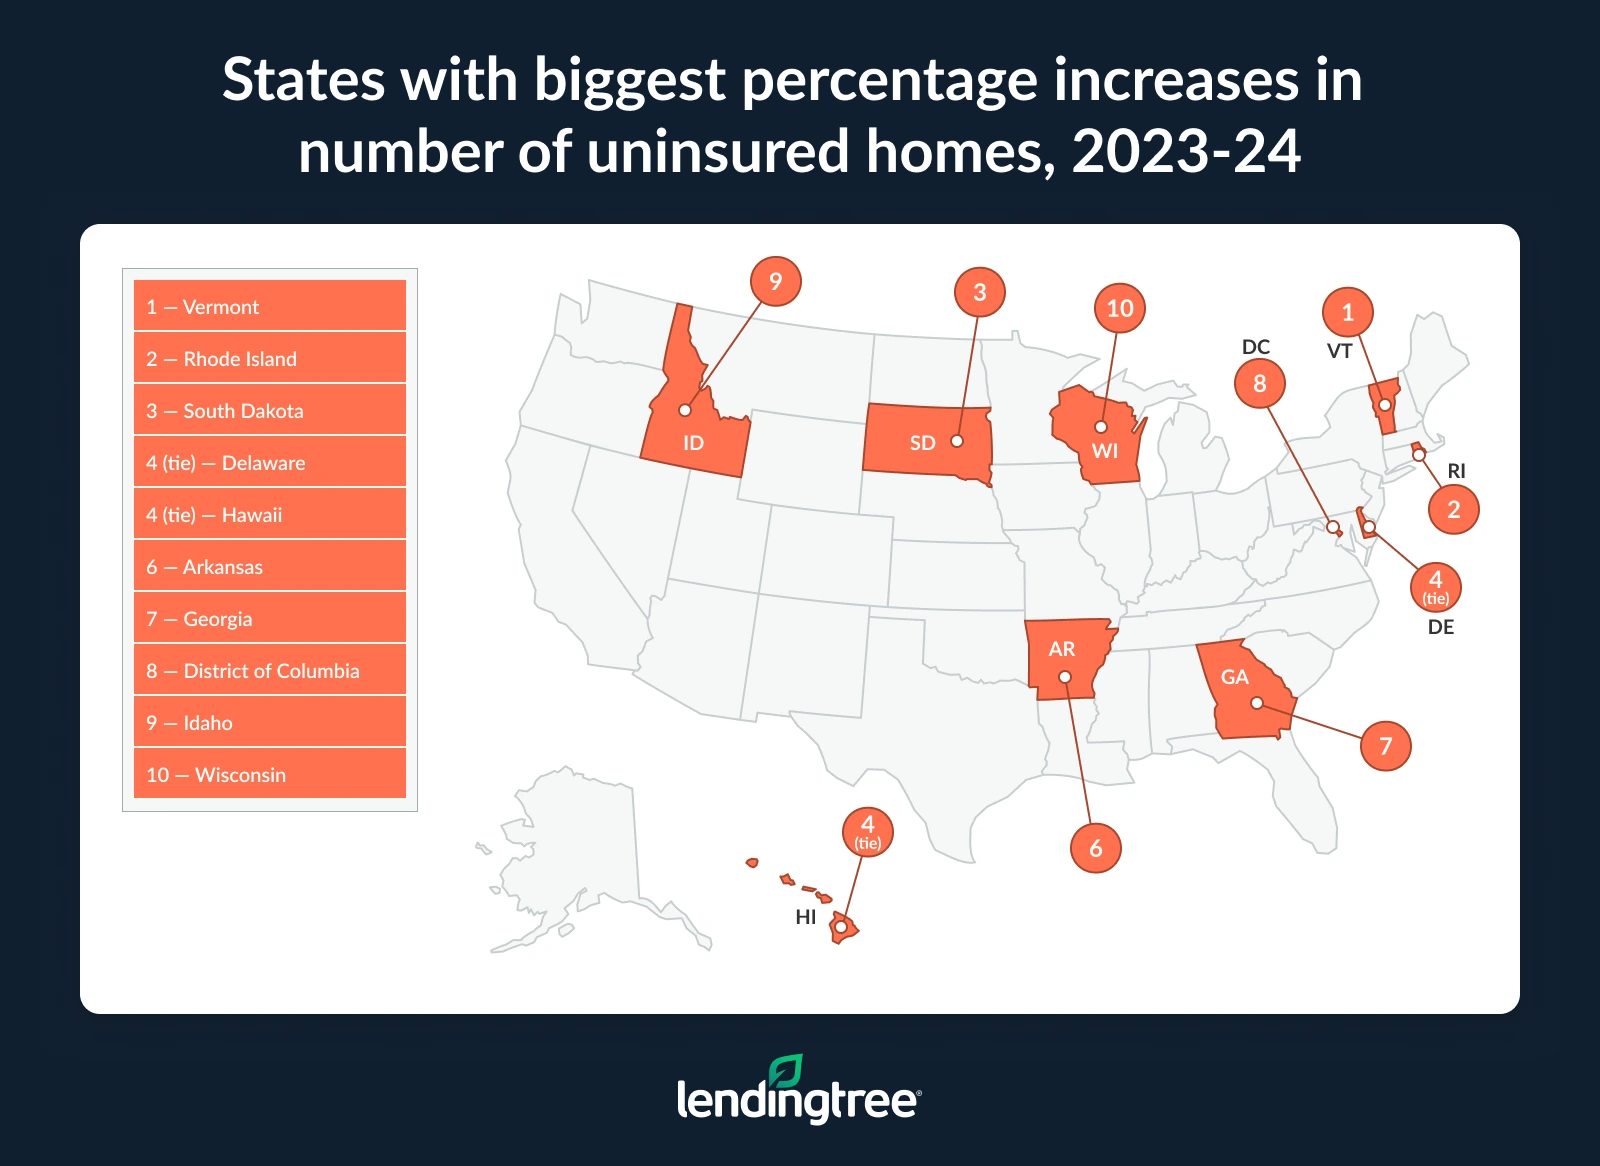
- The number of uninsured homes rose 6.6% nationwide from 2023 to 2024, with increases in all but five states. Vermont had the largest year-over-year increase at 21.5%, followed by Rhode Island (19.4%) and South Dakota (16.3%).
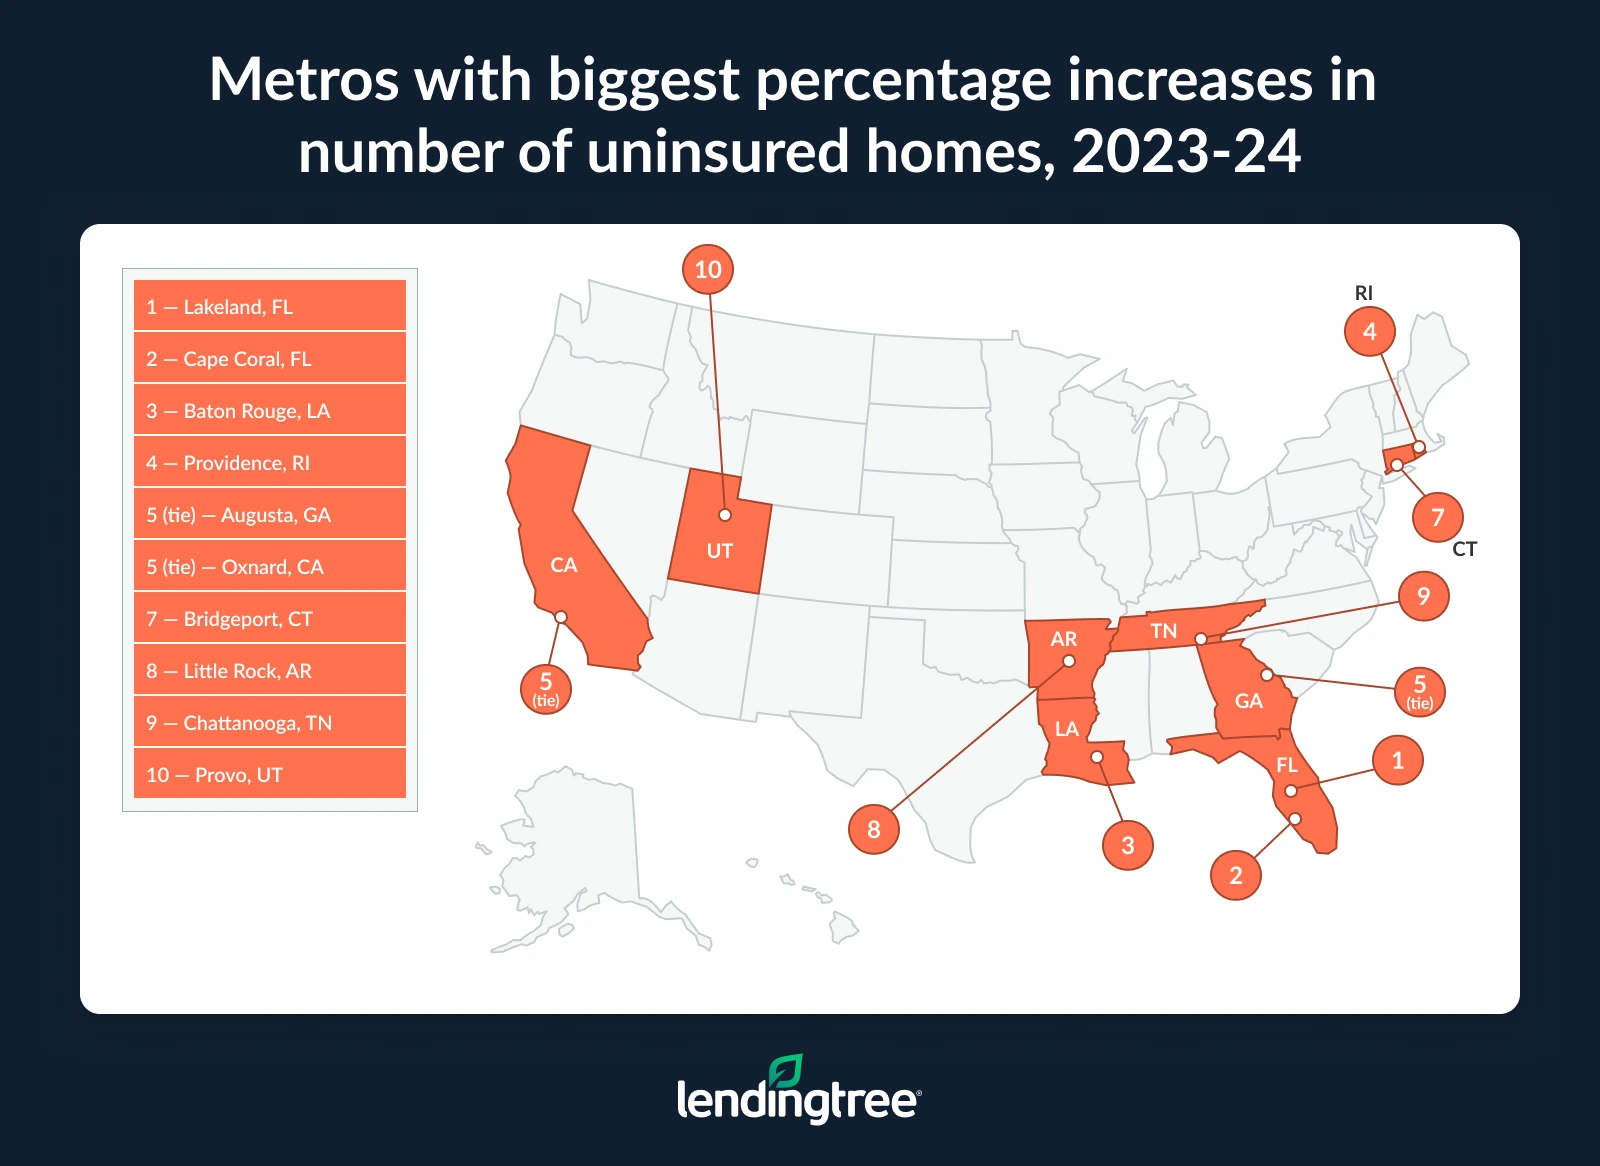
- Uninsured homes increased sharply across many U.S. metros from 2023 to 2024, with several seeing growth of 20.0% or more. Lakeland, Fla., had the largest increase at 45.7%, followed by Cape Coral, Fla. (29.6%), and Baton Rouge, La. (23.9%). Providence, R.I., Augusta, Ga., and Oxnard, Calif., also saw increases of more than 20.0%.
14.1% of homes are uninsured
Of the 86.6 million owner-occupied homes in the U.S., 12.2 million are uninsured. That’s 14.1% of homes, or about 1 in 7.
According to LendingTree home insurance expert Lindsay Bishop, homeowners may be going without insurance out of necessity. “Many people who go without home insurance aren’t ignoring the risks — they’re making a trade-off they feel they can’t avoid,” she says. “Rising home insurance rates are making home insurance harder to afford, especially for people on fixed incomes.”
Additionally, people who pay off their mortgage and are no longer required to have home insurance may see it as an ongoing cost that doesn’t deliver an immediate value. “This is especially true in areas where disasters feel less likely, like Midwestern states, which don’t experience hurricanes or frequent wildfires,” Bishop says.
23.9% of homes in West Virginia are uninsured
By state, West Virginia has the highest rate of uninsured homes, with 23.9% not covered. New Mexico and Louisiana follow at 23.0% and 21.2%, respectively.
According to Bishop, affordability is an issue in all three states.
“In Louisiana, frequent natural disasters have made home insurance expensive,” she says. “Home insurance in West Virginia and New Mexico is typically much cheaper than in Louisiana, but insurance takes up a large share of household income in these states.”
Meanwhile, Oregon and Colorado tie for the lowest rate of uninsured homes at 9.7% for both. New Hampshire (10.0%) follows, with Vermont and Massachusetts tying at 10.7%.
Full rankings: States with the highest rate of uninsured homes
| Rank | State | Homes | Homes w/out insurance | % of homes w/out insurance |
|---|---|---|---|---|
| 1 | West Virginia | 559,415 | 133,773 | 23.9% |
| 2 | New Mexico | 608,986 | 140,285 | 23.0% |
| 3 | Louisiana | 1,258,598 | 267,270 | 21.2% |
| 4 | Alaska | 182,292 | 37,488 | 20.6% |
| 5 | Mississippi | 829,682 | 167,873 | 20.2% |
| 6 | Florida | 6,220,116 | 1,205,299 | 19.4% |
| 7 | Arkansas | 836,697 | 159,803 | 19.1% |
| 8 | Alabama | 1,461,271 | 276,614 | 18.9% |
| 9 | Oklahoma | 1,053,182 | 192,894 | 18.3% |
| 10 | Texas | 7,134,877 | 1,262,492 | 17.7% |
| 11 | South Dakota | 261,078 | 45,901 | 17.6% |
| 12 | Kentucky | 1,270,744 | 220,798 | 17.4% |
| 13 | North Dakota | 213,886 | 35,355 | 16.5% |
| 14 | South Carolina | 1,607,358 | 250,549 | 15.6% |
| 15 | Arizona | 2,020,822 | 305,673 | 15.1% |
| 16 | Michigan | 3,034,798 | 454,159 | 15.0% |
| 17 | Montana | 321,733 | 47,914 | 14.9% |
| 18 | Indiana | 1,962,896 | 277,321 | 14.1% |
| 18 | Tennessee | 1,957,004 | 275,550 | 14.1% |
| 20 | North Carolina | 3,004,713 | 416,882 | 13.9% |
| 20 | Wyoming | 183,683 | 25,581 | 13.9% |
| 22 | Kansas | 820,255 | 112,813 | 13.8% |
| 22 | Missouri | 1,757,433 | 242,051 | 13.8% |
| 24 | Georgia | 2,798,409 | 383,965 | 13.7% |
| 25 | Nevada | 744,844 | 101,508 | 13.6% |
| 26 | Iowa | 958,213 | 128,957 | 13.5% |
| 27 | Wisconsin | 1,723,526 | 231,579 | 13.4% |
| 28 | Maine | 451,090 | 59,593 | 13.2% |
| 29 | Delaware | 304,189 | 39,671 | 13.0% |
| 30 | Nebraska | 549,417 | 70,392 | 12.8% |
| 31 | Ohio | 3,351,814 | 424,463 | 12.7% |
| 32 | Idaho | 538,468 | 66,692 | 12.4% |
| 32 | Minnesota | 1,692,435 | 209,051 | 12.4% |
| 34 | Rhode Island | 284,679 | 34,992 | 12.3% |
| 35 | New York | 4,252,571 | 512,408 | 12.0% |
| 36 | Hawaii | 304,026 | 36,261 | 11.9% |
| 36 | Pennsylvania | 3,713,956 | 441,450 | 11.9% |
| 38 | Virginia | 2,315,258 | 272,337 | 11.8% |
| 39 | Connecticut | 970,236 | 111,015 | 11.4% |
| 39 | Illinois | 3,449,961 | 392,458 | 11.4% |
| 41 | California | 7,701,876 | 873,408 | 11.3% |
| 41 | Utah | 824,019 | 93,408 | 11.3% |
| 41 | Washington | 1,992,341 | 224,568 | 11.3% |
| 44 | New Jersey | 2,264,820 | 254,508 | 11.2% |
| 45 | Maryland | 1,628,167 | 178,525 | 11.0% |
| 46 | District of Columbia | 134,836 | 14,532 | 10.8% |
| 47 | Massachusetts | 1,765,324 | 188,857 | 10.7% |
| 47 | Vermont | 209,117 | 22,386 | 10.7% |
| 49 | New Hampshire | 414,145 | 41,331 | 10.0% |
| 50 | Colorado | 1,635,345 | 157,888 | 9.7% |
| 50 | Oregon | 1,100,905 | 106,308 | 9.7% |
McAllen, Texas, metro has the highest rate of uninsured homes
Among the 100 largest U.S. metros, McAllen, Texas, ranks highest with 41.5% of its homes uninsured. That’s nearly 14 percentage points higher than the second-ranking metro, Lakeland, Fla., at 27.8%. El Paso, Texas (24.0%), follows.
Conversely, just 8.4% of Portland, Ore., owner-occupied homes are uninsured. Poughkeepsie, N.Y. (8.7%), and Denver (9.1%) follow. In total, just six of the 100 largest U.S. metros have uninsured rates under 10.0%.
Full rankings: Metros with the highest rate of uninsured homes
| Rank | Metro | Homes | Homes w/out insurance | % of homes w/out insurance |
|---|---|---|---|---|
| 1 | McAllen, TX | 186,412 | 77,334 | 41.5% |
| 2 | Lakeland, FL | 226,987 | 63,067 | 27.8% |
| 3 | El Paso, TX | 194,929 | 46,868 | 24.0% |
| 4 | Miami, FL | 1,448,616 | 325,927 | 22.5% |
| 5 | Baton Rouge, LA | 239,192 | 52,191 | 21.8% |
| 6 | Tampa, FL | 936,518 | 178,766 | 19.1% |
| 7 | Cape Coral, FL | 257,997 | 47,933 | 18.6% |
| 8 | Jackson, MS | 167,239 | 30,510 | 18.2% |
| 9 | Augusta, GA | 168,792 | 30,135 | 17.9% |
| 10 | Birmingham, AL | 337,779 | 60,003 | 17.8% |
| 11 | Tucson, AZ | 300,895 | 51,214 | 17.0% |
| 12 | Columbia, SC | 242,667 | 41,017 | 16.9% |
| 13 | Palm Bay, FL | 205,135 | 33,622 | 16.4% |
| 14 | San Antonio, TX | 634,894 | 101,944 | 16.1% |
| 14 | Jacksonville, FL | 477,236 | 76,805 | 16.1% |
| 16 | North Port, FL | 321,769 | 51,234 | 15.9% |
| 16 | Deltona, FL | 236,868 | 37,778 | 15.9% |
| 18 | Tulsa, OK | 272,679 | 42,842 | 15.7% |
| 19 | Houston, TX | 1,682,182 | 262,389 | 15.6% |
| 19 | Little Rock, AR | 205,964 | 32,134 | 15.6% |
| 21 | Albuquerque, NM | 264,697 | 40,379 | 15.3% |
| 21 | Chattanooga, TN | 159,336 | 24,343 | 15.3% |
| 23 | Winston-Salem, NC | 211,305 | 31,841 | 15.1% |
| 24 | Detroit, MI | 1,267,519 | 188,112 | 14.8% |
| 24 | Grand Rapids, MI | 334,745 | 49,696 | 14.8% |
| 26 | Bakersfield, CA | 179,338 | 26,325 | 14.7% |
| 27 | Orlando, FL | 675,660 | 97,451 | 14.4% |
| 28 | Greenville, SC | 280,848 | 39,223 | 14.0% |
| 29 | Greensboro, NC | 205,927 | 28,473 | 13.8% |
| 30 | Fresno, CA | 219,169 | 30,115 | 13.7% |
| 31 | Las Vegas, NV | 514,880 | 69,844 | 13.6% |
| 31 | Louisville, KY | 392,880 | 53,440 | 13.6% |
| 33 | Fayetteville, AR | 142,105 | 19,067 | 13.4% |
| 33 | Oklahoma City, OK | 372,314 | 49,811 | 13.4% |
| 35 | Toledo, OH | 164,082 | 21,304 | 13.0% |
| 35 | Stockton, CA | 156,705 | 20,298 | 13.0% |
| 37 | New Orleans, LA | 249,089 | 32,177 | 12.9% |
| 38 | Memphis, TN | 314,455 | 40,198 | 12.8% |
| 38 | Indianapolis, IN | 580,219 | 74,433 | 12.8% |
| 40 | Syracuse, NY | 189,532 | 24,116 | 12.7% |
| 40 | Riverside, CA | 977,126 | 124,084 | 12.7% |
| 42 | Knoxville, TN | 279,246 | 34,925 | 12.5% |
| 43 | Virginia Beach, VA | 451,287 | 55,742 | 12.4% |
| 43 | Providence, RI | 433,989 | 53,945 | 12.4% |
| 45 | Wichita, KS | 173,780 | 21,451 | 12.3% |
| 45 | Provo, UT | 153,622 | 18,917 | 12.3% |
| 47 | Philadelphia, PA | 1,675,721 | 203,608 | 12.2% |
| 48 | Phoenix, AZ | 1,308,743 | 158,360 | 12.1% |
| 49 | Nashville, TN | 561,770 | 67,553 | 12.0% |
| 50 | Buffalo, NY | 347,297 | 41,233 | 11.9% |
| 51 | Spokane, WA | 163,644 | 19,344 | 11.8% |
| 52 | Charleston, SC | 246,587 | 28,919 | 11.7% |
| 52 | Harrisburg, PA | 170,090 | 19,948 | 11.7% |
| 52 | Hartford, CT | 314,730 | 36,816 | 11.7% |
| 55 | New York, NY | 3,833,182 | 445,807 | 11.6% |
| 56 | Charlotte, NC | 745,195 | 85,931 | 11.5% |
| 56 | Dallas, TX | 1,808,257 | 207,564 | 11.5% |
| 56 | Akron, OH | 206,847 | 23,790 | 11.5% |
| 56 | Durham, NC | 157,630 | 18,126 | 11.5% |
| 60 | Honolulu, HI | 196,497 | 22,399 | 11.4% |
| 60 | Bridgeport, CT | 239,048 | 27,203 | 11.4% |
| 62 | Cleveland, OH | 641,564 | 72,795 | 11.3% |
| 62 | Columbus, OH | 547,226 | 61,753 | 11.3% |
| 64 | Salt Lake City, UT | 307,450 | 34,472 | 11.2% |
| 64 | Pittsburgh, PA | 760,330 | 85,336 | 11.2% |
| 64 | Austin, TX | 603,726 | 67,653 | 11.2% |
| 64 | Albany, NY | 254,905 | 28,508 | 11.2% |
| 68 | Raleigh, NC | 405,187 | 44,779 | 11.1% |
| 68 | Minneapolis, MN | 1,053,794 | 117,488 | 11.1% |
| 70 | Baltimore, MD | 760,877 | 83,732 | 11.0% |
| 70 | Los Angeles, CA | 2,210,637 | 243,806 | 11.0% |
| 70 | Boise, ID | 233,106 | 25,720 | 11.0% |
| 73 | Cincinnati, OH | 632,606 | 69,045 | 10.9% |
| 73 | Omaha, NE | 262,658 | 28,564 | 10.9% |
| 73 | Richmond, VA | 367,720 | 40,127 | 10.9% |
| 76 | Kansas City, MO | 610,583 | 65,896 | 10.8% |
| 76 | St. Louis, MO | 834,312 | 89,799 | 10.8% |
| 76 | Des Moines, IA | 210,177 | 22,691 | 10.8% |
| 76 | Milwaukee, WI | 403,216 | 43,461 | 10.8% |
| 76 | Oxnard, CA | 186,668 | 20,126 | 10.8% |
| 81 | New Haven, CT | 142,939 | 15,333 | 10.7% |
| 81 | Dayton, OH | 229,064 | 24,438 | 10.7% |
| 83 | Boston, MA | 1,202,110 | 127,979 | 10.6% |
| 84 | Sacramento, CA | 572,830 | 59,952 | 10.5% |
| 84 | Chicago, IL | 2,430,198 | 255,328 | 10.5% |
| 86 | Rochester, NY | 297,700 | 31,027 | 10.4% |
| 86 | Atlanta, GA | 1,597,409 | 166,129 | 10.4% |
| 86 | Madison, WI | 180,161 | 18,715 | 10.4% |
| 89 | Worcester, MA | 223,324 | 23,089 | 10.3% |
| 89 | Seattle, WA | 968,154 | 99,988 | 10.3% |
| 89 | Allentown, PA | 238,059 | 24,484 | 10.3% |
| 92 | Washington, DC | 1,531,201 | 155,572 | 10.2% |
| 93 | San Jose, CA | 378,086 | 38,095 | 10.1% |
| 94 | San Diego, CA | 645,184 | 64,580 | 10.0% |
| 95 | Ogden, UT | 163,381 | 15,978 | 9.8% |
| 96 | San Francisco, CA | 974,747 | 94,877 | 9.7% |
| 97 | Colorado Springs, CO | 203,735 | 19,299 | 9.5% |
| 98 | Denver, CO | 808,179 | 73,734 | 9.1% |
| 99 | Poughkeepsie, NY | 172,410 | 14,982 | 8.7% |
| 100 | Portland, OR | 627,394 | 52,634 | 8.4% |
The number of uninsured homes rose from 2023 to 2024
From 2023 to 2024, the number of uninsured homes rose 6.6% nationally.
Rising premiums certainly play a role — but Bishop says that’s only part of the equation. “When you pair those higher costs with insurance taking up a larger share of household income, it helps explain the rise in uninsured homes from 2023 to 2024 more clearly than 2024 rate changes alone,” she says.
By state, Vermont (21.5%) leads here — it was the only state with an increase above 20.0%. Rhode Island (19.4%) and South Dakota (16.3%) follow.
Meanwhile, Wyoming had the largest decrease in uninsured homes, with a decline of 8.7%. Oregon (4.9%) and North Dakota (4.4%) rank second and third, with Alaska (2.1%) and Montana (1.5%) being the only other states with decreases.
Full rankings: Percentage change in uninsured homes by state
| Rank | State | Homes w/out insurance, 2023 | Homes w/out insurance, 2024 | Change in # of homes | % change |
|---|---|---|---|---|---|
| 1 | Vermont | 18,422 | 22,386 | 3,964 | 21.5% |
| 2 | Rhode Island | 29,312 | 34,992 | 5,680 | 19.4% |
| 3 | South Dakota | 39,481 | 45,901 | 6,420 | 16.3% |
| 4 | Delaware | 34,685 | 39,671 | 4,986 | 14.4% |
| 4 | Hawaii | 31,703 | 36,261 | 4,558 | 14.4% |
| 6 | Arkansas | 142,348 | 159,803 | 17,455 | 12.3% |
| 7 | Georgia | 342,297 | 383,965 | 41,668 | 12.2% |
| 8 | District of Columbia | 13,023 | 14,532 | 1,509 | 11.6% |
| 9 | Idaho | 59,984 | 66,692 | 6,708 | 11.2% |
| 10 | Wisconsin | 209,628 | 231,579 | 21,951 | 10.5% |
| 11 | Alabama | 253,004 | 276,614 | 23,610 | 9.3% |
| 12 | Washington | 206,174 | 224,568 | 18,394 | 8.9% |
| 13 | Louisiana | 245,885 | 267,270 | 21,385 | 8.7% |
| 14 | California | 806,651 | 873,408 | 66,757 | 8.3% |
| 15 | Florida | 1,113,836 | 1,205,299 | 91,463 | 8.2% |
| 15 | Arizona | 282,484 | 305,673 | 23,189 | 8.2% |
| 17 | Minnesota | 193,724 | 209,051 | 15,327 | 7.9% |
| 18 | Massachusetts | 175,421 | 188,857 | 13,436 | 7.7% |
| 19 | Indiana | 257,625 | 277,321 | 19,696 | 7.6% |
| 20 | Tennessee | 256,489 | 275,550 | 19,061 | 7.4% |
| 20 | New York | 477,023 | 512,408 | 35,385 | 7.4% |
| 22 | Pennsylvania | 411,261 | 441,450 | 30,189 | 7.3% |
| 22 | Illinois | 365,642 | 392,458 | 26,816 | 7.3% |
| 24 | Texas | 1,179,346 | 1,262,492 | 83,146 | 7.1% |
| 25 | North Carolina | 391,836 | 416,882 | 25,046 | 6.4% |
| 26 | Iowa | 121,510 | 128,957 | 7,447 | 6.1% |
| 27 | Connecticut | 104,789 | 111,015 | 6,226 | 5.9% |
| 28 | Virginia | 257,334 | 272,337 | 15,003 | 5.8% |
| 29 | New Mexico | 133,250 | 140,285 | 7,035 | 5.3% |
| 30 | Michigan | 432,349 | 454,159 | 21,810 | 5.0% |
| 31 | Oklahoma | 184,060 | 192,894 | 8,834 | 4.8% |
| 31 | New Jersey | 242,856 | 254,508 | 11,652 | 4.8% |
| 33 | West Virginia | 128,184 | 133,773 | 5,589 | 4.4% |
| 33 | Colorado | 151,292 | 157,888 | 6,596 | 4.4% |
| 35 | New Hampshire | 39,756 | 41,331 | 1,575 | 4.0% |
| 36 | Maryland | 172,099 | 178,525 | 6,426 | 3.7% |
| 37 | Kentucky | 213,687 | 220,798 | 7,111 | 3.3% |
| 37 | South Carolina | 242,464 | 250,549 | 8,085 | 3.3% |
| 39 | Ohio | 412,687 | 424,463 | 11,776 | 2.9% |
| 40 | Missouri | 237,183 | 242,051 | 4,868 | 2.1% |
| 40 | Utah | 91,461 | 93,408 | 1,947 | 2.1% |
| 42 | Nevada | 99,803 | 101,508 | 1,705 | 1.7% |
| 43 | Maine | 58,652 | 59,593 | 941 | 1.6% |
| 43 | Kansas | 111,013 | 112,813 | 1,800 | 1.6% |
| 45 | Nebraska | 69,673 | 70,392 | 719 | 1.0% |
| 46 | Mississippi | 167,584 | 167,873 | 289 | 0.2% |
| 47 | Montana | 48,635 | 47,914 | -721 | -1.5% |
| 48 | Alaska | 38,285 | 37,488 | -797 | -2.1% |
| 49 | North Dakota | 36,988 | 35,355 | -1,633 | -4.4% |
| 50 | Oregon | 111,753 | 106,308 | -5,445 | -4.9% |
| 51 | Wyoming | 28,018 | 25,581 | -2,437 | -8.7% |
The number of uninsured homes grew by 20.0% or more in many metros
By metro, the number of uninsured homes increased significantly from 2023 to 2024 in many areas. Lakeland, Fla., led here, with the number of uninsured homes jumping by 45.7%. That’s significantly higher than the next metro, Cape Coral, Fla., which saw uninsured homes rise by 29.6%. Baton Rouge, La. (23.9%), rounds out the top three.
The number of uninsured homes also rose by more than 20.0% in Providence, R.I. (21.8%), Augusta, Ga. (20.6%), and Oxnard, Calif. (20.6%).
Conversely, 15 metros saw a decrease in the number of uninsured homes. Leading with the largest decrease was Toledo, Ohio (9.5%), followed by Memphis, Tenn. (9.0%), and Charleston, S.C. (8.3%).
Full rankings: Percentage change in uninsured homes by metro
| Rank | Metro | Homes w/out insurance, 2023 | Homes w/out insurance, 2024 | Change in # of homes | % change |
|---|---|---|---|---|---|
| 1 | Lakeland, FL | 43,283 | 63,067 | 19,784 | 45.7% |
| 2 | Cape Coral, FL | 36,990 | 47,933 | 10,943 | 29.6% |
| 3 | Baton Rouge, LA | 42,131 | 52,191 | 10,060 | 23.9% |
| 4 | Providence, RI | 44,278 | 53,945 | 9,667 | 21.8% |
| 5 | Augusta, GA | 24,989 | 30,135 | 5,146 | 20.6% |
| 5 | Oxnard, CA | 16,683 | 20,126 | 3,443 | 20.6% |
| 7 | Bridgeport, CT | 22,733 | 27,203 | 4,470 | 19.7% |
| 8 | Little Rock, AR | 27,009 | 32,134 | 5,125 | 19.0% |
| 9 | Chattanooga, TN | 20,525 | 24,343 | 3,818 | 18.6% |
| 10 | Provo, UT | 15,997 | 18,917 | 2,920 | 18.3% |
| 11 | Riverside, CA | 104,966 | 124,084 | 19,118 | 18.2% |
| 12 | Nashville, TN | 57,658 | 67,553 | 9,895 | 17.2% |
| 13 | Columbia, SC | 35,308 | 41,017 | 5,709 | 16.2% |
| 14 | Winston-Salem, NC | 27,505 | 31,841 | 4,336 | 15.8% |
| 15 | Stockton, CA | 17,553 | 20,298 | 2,745 | 15.6% |
| 16 | Grand Rapids, MI | 43,529 | 49,696 | 6,167 | 14.2% |
| 17 | Spokane, WA | 16,956 | 19,344 | 2,388 | 14.1% |
| 18 | Virginia Beach, VA | 48,983 | 55,742 | 6,759 | 13.8% |
| 19 | Akron, OH | 21,005 | 23,790 | 2,785 | 13.3% |
| 19 | Boise, ID | 22,708 | 25,720 | 3,012 | 13.3% |
| 21 | Durham, NC | 16,130 | 18,126 | 1,996 | 12.4% |
| 22 | Deltona, FL | 33,636 | 37,778 | 4,142 | 12.3% |
| 23 | Tucson, AZ | 45,633 | 51,214 | 5,581 | 12.2% |
| 23 | Chicago, IL | 227,506 | 255,328 | 27,822 | 12.2% |
| 25 | Allentown, PA | 21,872 | 24,484 | 2,612 | 11.9% |
| 26 | Honolulu, HI | 20,057 | 22,399 | 2,342 | 11.7% |
| 26 | Columbus, OH | 55,304 | 61,753 | 6,449 | 11.7% |
| 28 | Indianapolis, IN | 66,678 | 74,433 | 7,755 | 11.6% |
| 29 | Los Angeles, CA | 219,325 | 243,806 | 24,481 | 11.2% |
| 29 | Albany, NY | 25,630 | 28,508 | 2,878 | 11.2% |
| 31 | Dallas, TX | 186,855 | 207,564 | 20,709 | 11.1% |
| 32 | Richmond, VA | 36,160 | 40,127 | 3,967 | 11.0% |
| 33 | Bakersfield, CA | 23,870 | 26,325 | 2,455 | 10.3% |
| 34 | El Paso, TX | 42,512 | 46,868 | 4,356 | 10.2% |
| 34 | Philadelphia, PA | 184,747 | 203,608 | 18,861 | 10.2% |
| 36 | Louisville, KY | 48,657 | 53,440 | 4,783 | 9.8% |
| 37 | Syracuse, NY | 21,991 | 24,116 | 2,125 | 9.7% |
| 38 | Poughkeepsie, NY | 13,704 | 14,982 | 1,278 | 9.3% |
| 39 | Hartford, CT | 33,699 | 36,816 | 3,117 | 9.2% |
| 40 | Jacksonville, FL | 70,391 | 76,805 | 6,414 | 9.1% |
| 40 | Seattle, WA | 91,625 | 99,988 | 8,363 | 9.1% |
| 42 | Minneapolis, MN | 107,938 | 117,488 | 9,550 | 8.8% |
| 43 | Boston, MA | 118,139 | 127,979 | 9,840 | 8.3% |
| 44 | Milwaukee, WI | 40,181 | 43,461 | 3,280 | 8.2% |
| 45 | Miami, FL | 301,973 | 325,927 | 23,954 | 7.9% |
| 46 | Madison, WI | 17,401 | 18,715 | 1,314 | 7.6% |
| 47 | Austin, TX | 62,937 | 67,653 | 4,716 | 7.5% |
| 48 | Oklahoma City, OK | 46,365 | 49,811 | 3,446 | 7.4% |
| 49 | Washington, DC | 145,171 | 155,572 | 10,401 | 7.2% |
| 50 | Tampa, FL | 167,256 | 178,766 | 11,510 | 6.9% |
| 50 | Atlanta, GA | 155,358 | 166,129 | 10,771 | 6.9% |
| 50 | Fayetteville, AR | 17,834 | 19,067 | 1,233 | 6.9% |
| 53 | New York, NY | 417,829 | 445,807 | 27,978 | 6.7% |
| 53 | Des Moines, IA | 21,268 | 22,691 | 1,423 | 6.7% |
| 55 | Detroit, MI | 176,945 | 188,112 | 11,167 | 6.3% |
| 55 | Tulsa, OK | 40,301 | 42,842 | 2,541 | 6.3% |
| 57 | Las Vegas, NV | 65,794 | 69,844 | 4,050 | 6.2% |
| 58 | Pittsburgh, PA | 80,657 | 85,336 | 4,679 | 5.8% |
| 59 | Denver, CO | 69,731 | 73,734 | 4,003 | 5.7% |
| 60 | Houston, TX | 249,540 | 262,389 | 12,849 | 5.1% |
| 61 | Albuquerque, NM | 38,449 | 40,379 | 1,930 | 5.0% |
| 61 | North Port, FL | 48,800 | 51,234 | 2,434 | 5.0% |
| 63 | Phoenix, AZ | 150,990 | 158,360 | 7,370 | 4.9% |
| 64 | Buffalo, NY | 39,341 | 41,233 | 1,892 | 4.8% |
| 65 | Worcester, MA | 22,050 | 23,089 | 1,039 | 4.7% |
| 66 | Cleveland, OH | 69,608 | 72,795 | 3,187 | 4.6% |
| 67 | San Jose, CA | 36,477 | 38,095 | 1,618 | 4.4% |
| 68 | New Orleans, LA | 30,900 | 32,177 | 1,277 | 4.1% |
| 69 | Jackson, MS | 29,428 | 30,510 | 1,082 | 3.7% |
| 70 | Birmingham, AL | 57,937 | 60,003 | 2,066 | 3.6% |
| 71 | Omaha, NE | 27,602 | 28,564 | 962 | 3.5% |
| 72 | Colorado Springs, CO | 18,662 | 19,299 | 637 | 3.4% |
| 73 | Palm Bay, FL | 32,658 | 33,622 | 964 | 3.0% |
| 74 | Greenville, SC | 38,238 | 39,223 | 985 | 2.6% |
| 74 | San Diego, CA | 62,932 | 64,580 | 1,648 | 2.6% |
| 74 | San Francisco, CA | 92,428 | 94,877 | 2,449 | 2.6% |
| 77 | San Antonio, TX | 100,111 | 101,944 | 1,833 | 1.8% |
| 78 | McAllen, TX | 76,164 | 77,334 | 1,170 | 1.5% |
| 79 | Raleigh, NC | 44,213 | 44,779 | 566 | 1.3% |
| 80 | Dayton, OH | 24,145 | 24,438 | 293 | 1.2% |
| 81 | Greensboro, NC | 28,153 | 28,473 | 320 | 1.1% |
| 82 | St. Louis, MO | 88,972 | 89,799 | 827 | 0.9% |
| 83 | Baltimore, MD | 83,220 | 83,732 | 512 | 0.6% |
| 83 | Sacramento, CA | 59,610 | 59,952 | 342 | 0.6% |
| 85 | Cincinnati, OH | 68,995 | 69,045 | 50 | 0.1% |
| 86 | Fresno, CA | 30,257 | 30,115 | -142 | -0.5% |
| 87 | Portland, OR | 53,159 | 52,634 | -525 | -1.0% |
| 88 | Charlotte, NC | 87,699 | 85,931 | -1,768 | -2.0% |
| 89 | Orlando, FL | 99,763 | 97,451 | -2,312 | -2.3% |
| 90 | Wichita, KS | 22,067 | 21,451 | -616 | -2.8% |
| 91 | Ogden, UT | 16,691 | 15,978 | -713 | -4.3% |
| 92 | Rochester, NY | 32,441 | 31,027 | -1,414 | -4.4% |
| 93 | Salt Lake City, UT | 36,110 | 34,472 | -1,638 | -4.5% |
| 94 | Knoxville, TN | 37,215 | 34,925 | -2,290 | -6.2% |
| 95 | Harrisburg, PA | 21,310 | 19,948 | -1,362 | -6.4% |
| 96 | Kansas City, MO | 70,998 | 65,896 | -5,102 | -7.2% |
| 97 | New Haven, CT | 16,660 | 15,333 | -1,327 | -8.0% |
| 98 | Charleston, SC | 31,541 | 28,919 | -2,622 | -8.3% |
| 99 | Memphis, TN | 44,188 | 40,198 | -3,990 | -9.0% |
| 100 | Toledo, OH | 23,536 | 21,304 | -2,232 | -9.5% |
Understanding home insurance: Top expert tips
Disaster can strike at any time, and it pays to be prepared. For those uninsured but considering coverage, here’s some advice:
- Understand the risk of going uninsured. “Even if you could easily cover the cost to fix your home after minor damage, most people can’t afford to fully replace their home after a major disaster,” Bishop says. “While home insurance usually costs a few thousand dollars per year, fully rebuilding a home will easily cost six figures.”
- Choose a high-deductible plan. “If you’re concerned about the cost of home insurance, one way to lower your bill is by choosing a higher deductible,” she says. “A higher deductible means you’ll have to pay more money for home repairs before your insurance policy kicks in. But it can also significantly decrease the amount you pay for home insurance.”
- Consider a home insurance policy with less coverage. “Most homeowners have what’s known as an HO-3 policy, which protects against lots of different types of damage,” she says. “However, you could ask about an HO-2 policy, which limits your coverage to some of the more major types of damage, such as fire and lightning, windstorms and falling objects, like a tree.”
Methodology
LendingTree researchers analyzed the U.S. Census Bureau 2023 and 2024 American Community Surveys (ACS) with one-year estimates to gather home insurance cost data.
Owner-occupied homes with annual home insurance costs of less than $100 were classified as uninsured. The number of owner-occupied homes that paid less than $100 in annual home insurance costs in 2023 and 2024, respectively, was divided by the total number of owner-occupied homes to calculate the percentage of uninsured homes. This was done nationally and by state and metro.
We also calculated the percentage change in the number of uninsured homes between 2023 and 2024 by state and metro.
The U.S. Census Bureau 2024 ACS with one-year estimates was used to find the 100 largest metros by population to be included in the analysis.