Mompreneurs Thriving in Hawaii, District of Columbia and Oregon


Being a mother is difficult. Being a working mother is even more so.
Thankfully, self-employment can help bridge the gap between working and having time to care for your children without breaking the bank or relying on others for child care. But where you’re starting your business matters: According to a LendingTree study on mompreneurs, Hawaii is the best state for self-employed moms, while West Virginia is the worst.
Here’s a closer look.
- Hawaii is the hottest state for mompreneurs — by a lot. The Aloha State earned a Mompreneur Score of 87.6 out of 100, far above the District of Columbia’s second-place score of 53.6. In fact, Hawaii ranked first or second in every metric we considered. D.C. earned its spot thanks to significantly higher self-employment earnings among moms than in every other state. Oregon rounded out the top three with a score of 52.7.
- West Virginia, North Dakota and Missouri scored worst for mompreneurs. West Virginia ranked lowest in three metrics, with the lowest rate of moms who are self-employed and the lowest self-employment income among moms. North Dakota mompreneurs earned less than a quarter of what self-employed people did, while Missouri ranked in the bottom five in three metrics.
- Moms are most likely to be self-employed in Wyoming. 13.9% of Wyoming moms identified as self-employed — ahead of the average across the 50 states and D.C. of 8.2%. Hawaii (13.3%) and Montana (13.2%) followed. Conversely, self-employed people are most likely to be moms in Utah (33.6%), Hawaii (31.0%) and Wyoming (29.7%).
- Mompreneurs face earnings disparities compared to other working moms and entrepreneurs. In D.C., moms have the highest average self-employment income ($46,275), followed by Hawaii ($36,187) and Alaska ($35,276). However, when comparing self-employed moms’ earnings to moms’ earnings in general, D.C. sinks to 26th.
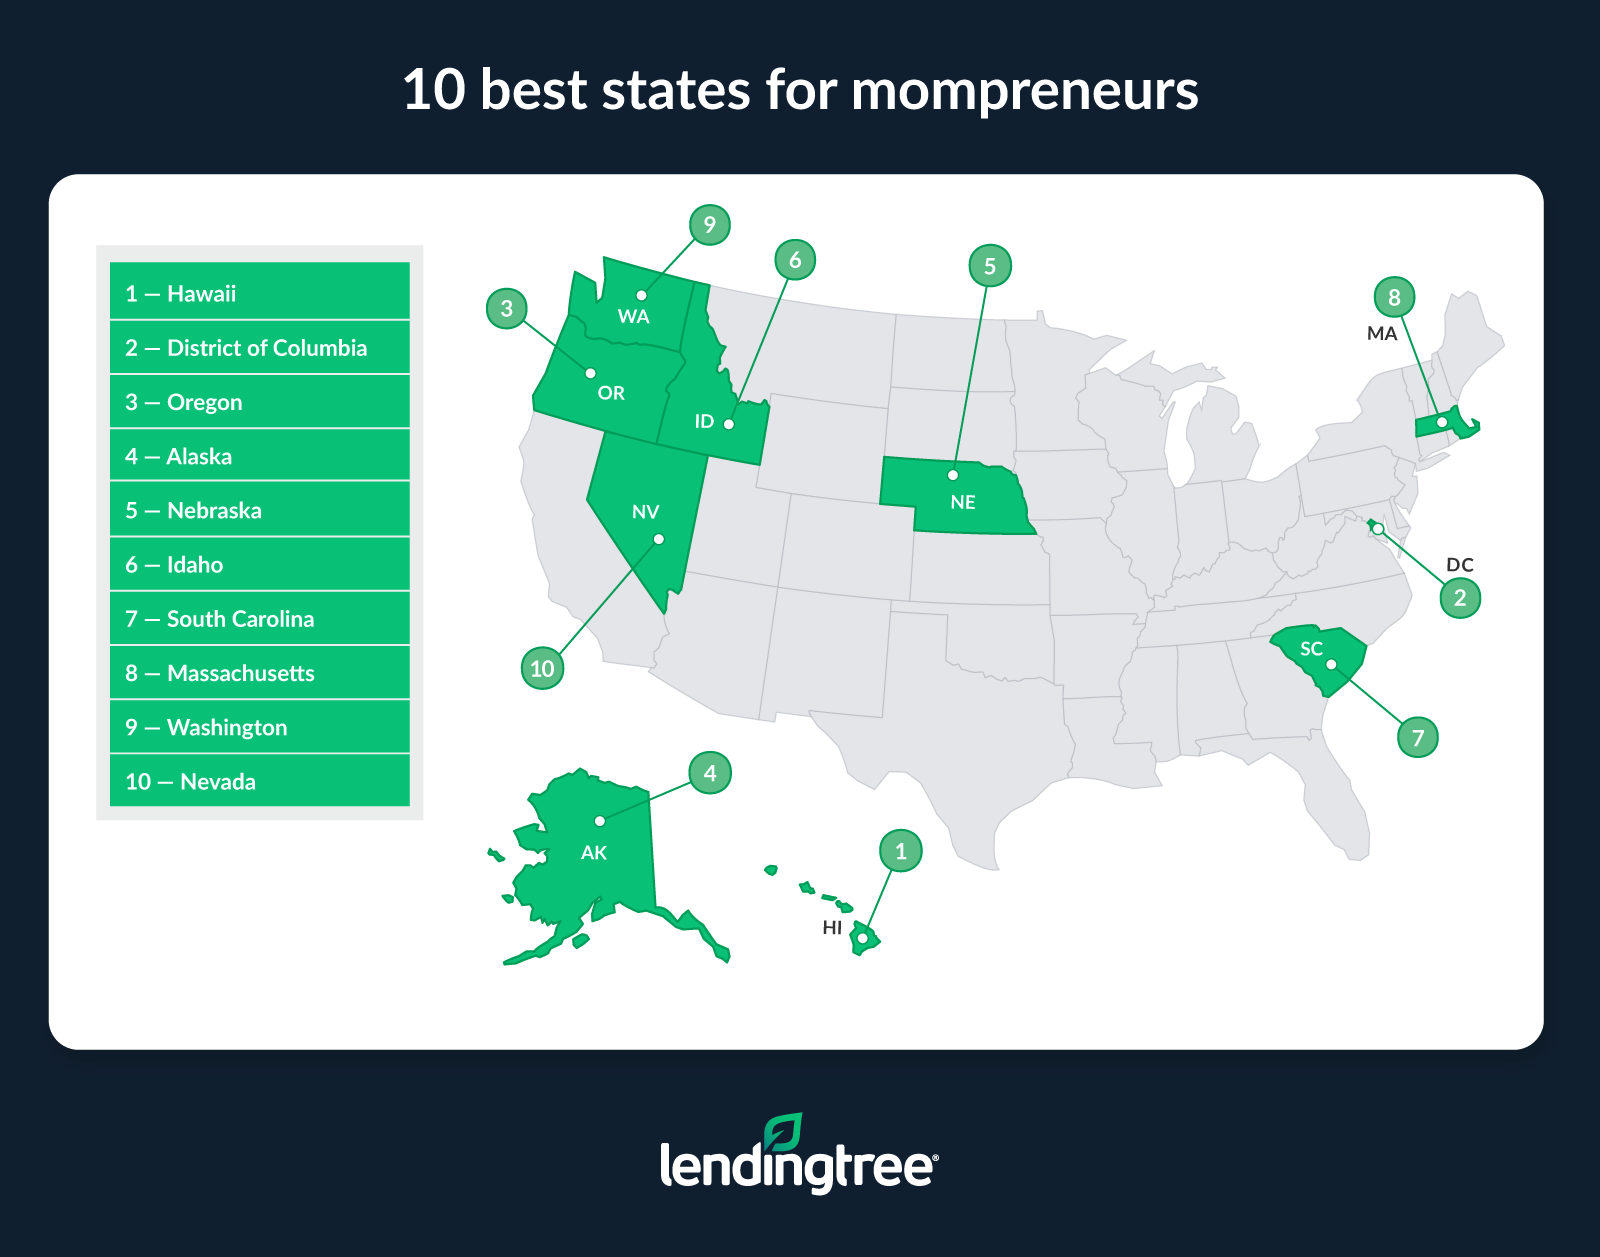
Hawaii is the best state for mompreneurs
For mompreneurs trying to make it work, those in Hawaii may have the biggest advantage. Based on our scoring system, Hawaii received an 87.6 out of 100.0. That’s significantly higher than the second-ranking state, the District of Columbia, which received a score of 53.6.
Hawaii received high scores across all our rankings. It ranked first for average self-employment income for moms compared to wages for all working moms in the state (66.2%) and second in every other metric we considered. More specifically:
- Self-employed moms earned 69.1% of the average income of all self-employed residents.
- The average self-employment income was $36,187.
- 31.0% of self-employed residents were moms.
- 13.3% of moms were self-employed.
Matt Schulz — LendingTree chief consumer finance analyst and author of “Ask Questions, Save Money, Make More: How to Take Control of Your Financial Life” — says Hawaii’s high cost of living is surely driving some mompreneurs’ efforts.
“It’s one of the most expensive places in the nation to live, meaning that second incomes may be even more important there than in other parts of the country,” he says. “However, Hawaii’s location can cause a real issue for mompreneurs. For example, something as simple as shipping purchased items around the country may be far pricier and take longer for Hawaii residents.”
Mompreneurs in D.C. had significantly higher self-employment earnings than in every other state. The average self-employment income for moms was $46,275 — 27.9% higher than the average mompreneur income in Hawaii and more than double the national average of $22,880.
D.C. made the top 10 list in one other metric: It ranked eighth for the percentage of self-employed residents who are moms, at 26.3%.
Oregon rounded out the top three with a score of 52.7. Most notably, Oregon had:
- The third-highest average self-employment income for moms compared to all self-employment income (63.1%)
- The sixth-highest average self-employment income for moms compared to wages for all working moms in the state (49.8%)
- The sixth-highest average self-employment income for moms ($29,181)
- The ninth-highest percentage of moms who are self-employed (9.3%)
Western mompreneurs may be in a better position than those in other regions. Among the 10 states with the highest scores, six are in the West. Meanwhile, two are in the South, one is in the Midwest and one is in the Northeast.
West Virginia mompreneurs struggle the most
West Virginia got the lowest scores, receiving an 11.9 out of 100.0, and making it the worst state for mompreneurs. Most notably, it was last in three metrics: It had the lowest rate of moms who are self-employed (4.8%), the lowest self-employment income among moms ($13,539) and the lowest self-employment income among moms compared to wages for all moms in the state (29.0%).
Schulz believes some of these rankings may have a domino effect. “Given the low income among mompreneurs here, it’s possible that many moms may simply see that much money as not enough of a return on investment to make it worth their time,” he says. “That’s probably why we see such a stunningly low percentage of moms who are self-employed.”
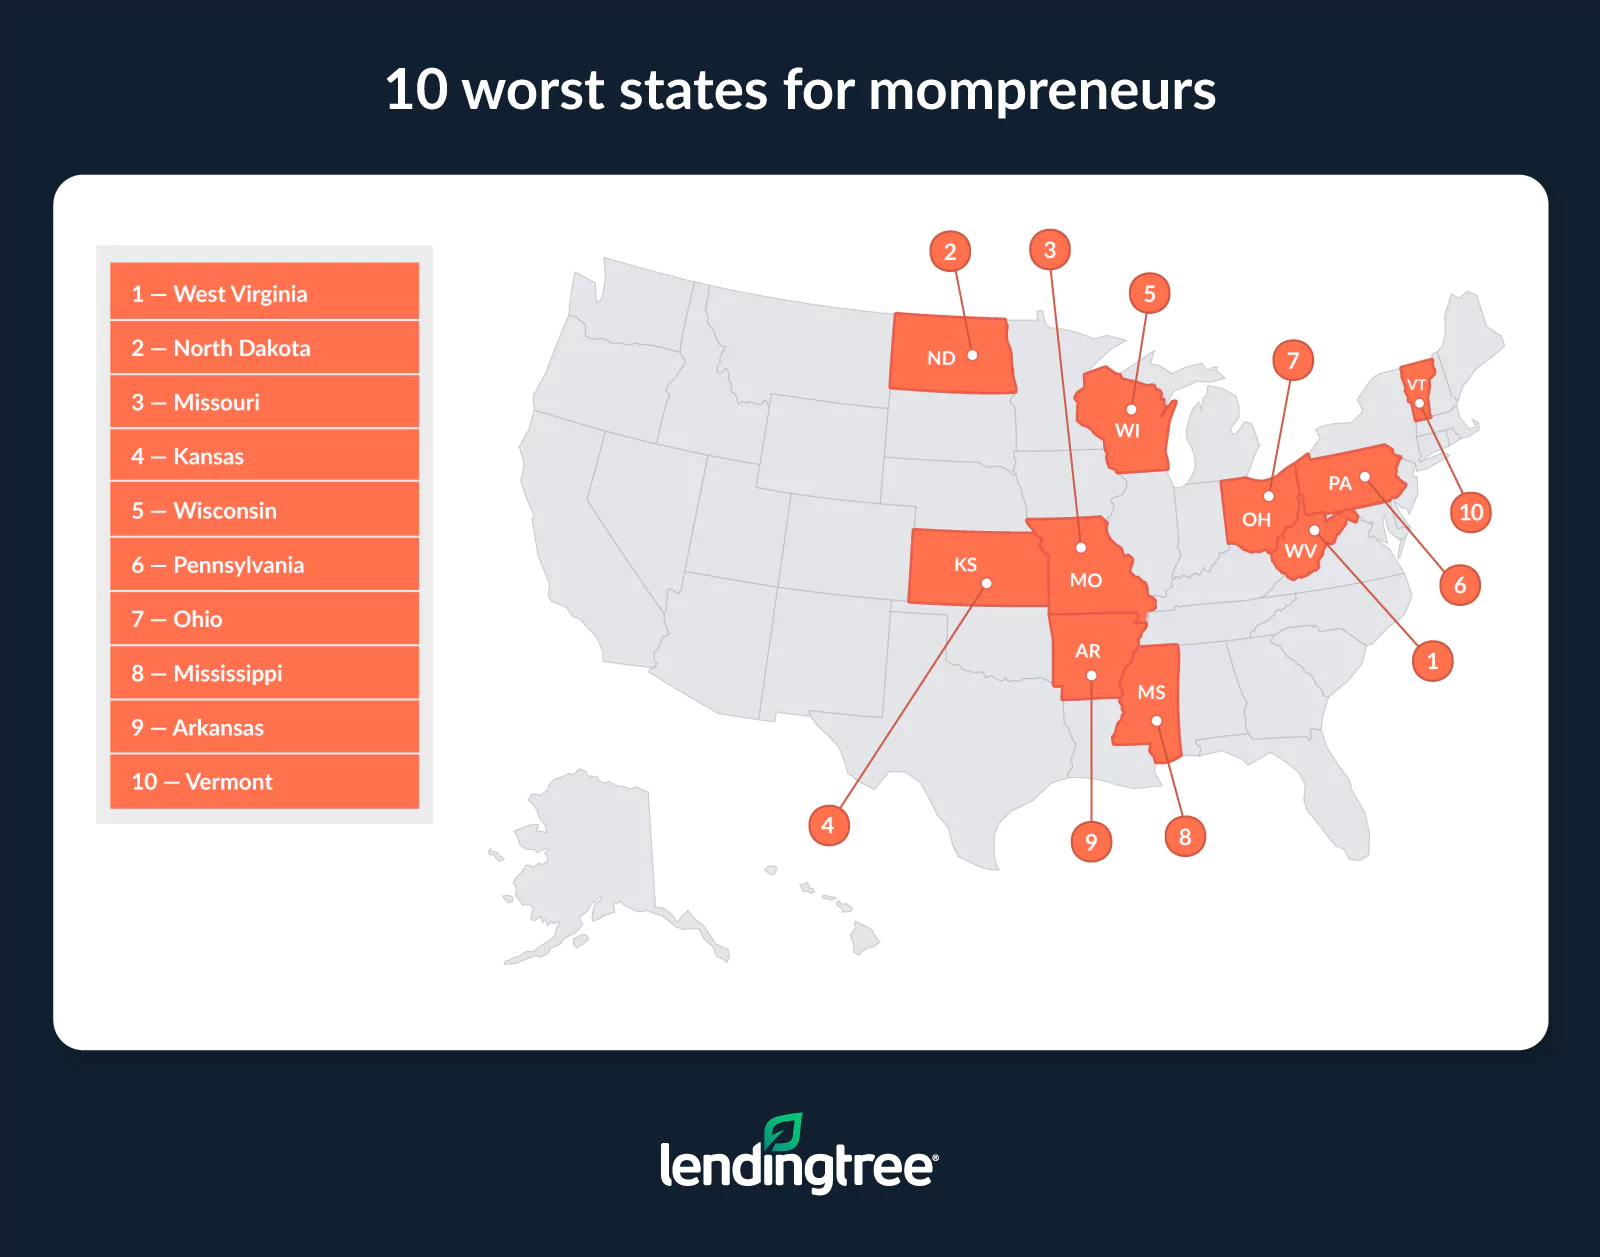
North Dakota ranked second from the bottom, with a score of 14.2. Most notably, mompreneurs earned less than a quarter (23.6%) of what all self-employed people in the state did — the lowest by state. It also had the second-lowest average self-employment income for moms compared to wages for all working moms (30.3%).
Missouri ranked third worst, at 19.2. It ranked in the bottom five in three metrics. More specifically, it had:
- The third-lowest average self-employment income for moms compared to wages for moms (30.6%)
- The fifth-lowest average self-employment income for moms ($15,954)
- The fifth-lowest average self-employment income for moms compared to all self-employed residents (33.5%)
Midwest mompreneurs may struggle the most. Among the 10 states with the lowest scores, five are in the Midwest, three are in the South and two are in the Northeast.
Full rankings: Best/worst states for mompreneurs
| Rank | State | Score | % of moms who are self-employed | % of self-employed people who are moms | Avg. self-employment income among moms | Moms’ self-employment income as % of moms’ income | Moms’ self-employment income as % of self-employment income |
|---|---|---|---|---|---|---|---|
| 1 | Hawaii | 87.6 | 13.3% | 31.0% | $36,187 | 66.2% | 69.1% |
| 2 | District of Columbia | 53.6 | 8.8% | 26.3% | $46,275 | 38.0% | 43.1% |
| 3 | Oregon | 52.7 | 9.3% | 20.9% | $29,181 | 49.8% | 63.1% |
| 4 | Alaska | 51.7 | 6.0% | 14.8% | $35,276 | 58.1% | 74.5% |
| 5 | Nebraska | 49.1 | 8.8% | 23.3% | $26,665 | 50.0% | 53.9% |
| 6 | Idaho | 48.5 | 10.8% | 25.8% | $21,809 | 48.3% | 44.3% |
| 7 | South Carolina | 47.5 | 8.8% | 26.5% | $23,236 | 47.2% | 50.4% |
| 8 | Massachusetts | 47.1 | 7.5% | 19.8% | $35,226 | 45.9% | 57.9% |
| 9 | Washington | 46.9 | 9.4% | 26.8% | $28,006 | 39.3% | 48.2% |
| 10 | Nevada | 46.6 | 8.2% | 22.1% | $26,528 | 51.5% | 52.2% |
| 11 | New Jersey | 46.1 | 6.7% | 21.4% | $34,085 | 45.4% | 57.8% |
| 12 | New Mexico | 44.8 | 8.1% | 23.4% | $21,368 | 49.7% | 55.2% |
| 13 | Montana | 44.5 | 13.2% | 24.4% | $19,811 | 39.6% | 39.6% |
| 14 | Colorado | 43.6 | 9.0% | 21.5% | $27,112 | 41.9% | 53.9% |
| 15 | Arizona | 43.4 | 8.5% | 22.2% | $25,538 | 46.3% | 50.9% |
| 16 | Tennessee | 41.1 | 8.4% | 22.4% | $23,515 | 47.2% | 46.9% |
| 17 | North Carolina | 40.8 | 7.6% | 22.4% | $24,815 | 44.6% | 52.1% |
| 18 | Utah | 40.5 | 9.4% | 33.6% | $16,744 | 37.3% | 33.8% |
| 19 | Minnesota | 39.4 | 7.6% | 21.8% | $27,029 | 40.8% | 51.9% |
| 20 | Indiana | 38.1 | 6.3% | 22.0% | $23,648 | 48.9% | 49.5% |
| 21 | Wyoming | 38.0 | 13.9% | 29.7% | $13,969 | 32.2% | 23.9% |
| 22 | Texas | 37.7 | 8.4% | 23.6% | $22,522 | 41.2% | 44.9% |
| 23 | South Dakota | 37.2 | 8.7% | 17.5% | $23,472 | 52.8% | 41.0% |
| 24 | California | 36.0 | 8.6% | 19.8% | $26,051 | 36.6% | 50.4% |
| 25 | Louisiana | 35.4 | 8.2% | 24.5% | $19,434 | 41.6% | 41.8% |
| 26 | Virginia | 34.8 | 7.4% | 24.7% | $24,195 | 35.6% | 45.2% |
| 27 | New Hampshire | 31.9 | 6.3% | 14.7% | $28,903 | 47.1% | 47.7% |
| 28 | Rhode Island | 31.5 | 7.9% | 20.7% | $21,548 | 33.3% | 51.8% |
| 29 | New York | 31.2 | 7.5% | 21.0% | $24,541 | 34.2% | 46.8% |
| 30 | Kentucky | 31.0 | 7.1% | 24.1% | $18,280 | 37.5% | 45.3% |
| 31 | Florida | 30.3 | 9.8% | 23.5% | $17,685 | 32.7% | 37.6% |
| 32 | Michigan | 29.5 | 6.9% | 21.7% | $20,770 | 39.1% | 43.1% |
| 33 | Georgia | 29.4 | 7.9% | 23.9% | $19,096 | 34.3% | 40.3% |
| 34 | Alabama | 28.8 | 7.1% | 22.9% | $18,399 | 39.6% | 39.9% |
| 35 | Illinois | 28.7 | 6.8% | 22.6% | $21,879 | 34.8% | 43.3% |
| 36 | Maryland | 28.6 | 6.5% | 21.0% | $24,947 | 33.0% | 46.8% |
| 37 | Iowa | 28.0 | 7.8% | 19.6% | $20,265 | 39.2% | 40.6% |
| 38 | Oklahoma | 27.8 | 8.6% | 24.8% | $15,183 | 34.3% | 36.2% |
| 39 | Delaware | 27.5 | 7.1% | 27.5% | $19,568 | 33.0% | 31.3% |
| 40 | Connecticut | 27.4 | 8.4% | 21.8% | $22,011 | 31.3% | 37.7% |
| 40 | Maine | 27.4 | 10.1% | 17.7% | $18,267 | 35.7% | 39.2% |
| 42 | Vermont | 25.9 | 9.0% | 15.6% | $20,386 | 33.2% | 47.1% |
| 43 | Arkansas | 25.0 | 6.9% | 20.6% | $17,504 | 37.7% | 41.5% |
| 44 | Mississippi | 24.2 | 7.6% | 27.0% | $13,565 | 33.9% | 29.5% |
| 45 | Ohio | 22.4 | 6.4% | 21.1% | $18,432 | 33.0% | 41.2% |
| 46 | Pennsylvania | 21.8 | 6.4% | 19.6% | $20,384 | 33.6% | 40.1% |
| 47 | Wisconsin | 21.1 | 5.6% | 17.5% | $20,709 | 36.6% | 43.8% |
| 48 | Kansas | 19.5 | 7.2% | 21.0% | $16,592 | 31.7% | 34.3% |
| 49 | Missouri | 19.2 | 7.2% | 22.0% | $15,954 | 30.6% | 33.5% |
| 50 | North Dakota | 14.2 | 8.2% | 18.5% | $16,765 | 30.3% | 23.6% |
| 51 | West Virginia | 11.9 | 4.8% | 20.4% | $13,539 | 29.0% | 38.6% |
Self-employed moms are most common in Wyoming
Turning to where mompreneurs are most common, moms were most likely to be self-employed in Wyoming. Here, 13.9% of Wyoming moms identified as self-employed. That compares to a national average of 8.2%.
Hawaii (13.3%) and Montana (13.2%) ranked second and third, respectively.
States with highest percentage of moms who are self-employed
| Rank | State | % of moms who are self-employed |
|---|---|---|
| 1 | Wyoming | 13.9% |
| 2 | Hawaii | 13.3% |
| 3 | Montana | 13.2% |
| 4 | Idaho | 10.8% |
| 5 | Maine | 10.1% |
| 6 | Florida | 9.8% |
| 7 | Utah | 9.4% |
| 7 | Washington | 9.4% |
| 9 | Oregon | 9.3% |
| 10 | Colorado | 9.0% |
Meanwhile, self-employed residents are most likely to be moms in Utah, at 33.6%. Hawaii (31.0%) and Wyoming (29.7%) follow.
“Many parents would choose self-employment because of the freedom and flexibility it can bring,” Schulz says. “Of course, running your own business is often risky, stressful, exhausting work, but not having to answer to a boss or commute to an office or clock into a 9-to-5 workday is a big deal. Many people are willing to trade the safety and security of a steady paycheck from a regular employer to enjoy that flexibility, even knowing the risks that come along with it.”
States with highest percentage of self-employed people who are moms
| Rank | State | % of self-employed people who are moms |
|---|---|---|
| 1 | Utah | 33.6% |
| 2 | Hawaii | 31.0% |
| 3 | Wyoming | 29.7% |
| 4 | Delaware | 27.5% |
| 5 | Mississippi | 27.0% |
| 6 | Washington | 26.8% |
| 7 | South Carolina | 26.5% |
| 8 | District of Columbia | 26.3% |
| 9 | Idaho | 25.8% |
| 10 | Oklahoma | 24.8% |
Mompreneurs struggle to close the wage gap
While being a mompreneur may provide many lifestyle benefits, mompreneurs face earnings disparities compared to other working moms and entrepreneurs.
In D.C., moms have the highest average self-employment income ($46,275). However, when comparing self-employed moms’ earnings to moms’ earnings in general, D.C. sinks to 26th, with mompreneurs earning just 38.0% of all working moms’ income.
Hawaii ($36,187) and Alaska ($35,276) have the next-highest average income among mompreneurs, with Hawaii mompreneurs making 66.2% of all working moms’ incomes and Alaska mompreneurs making 58.1%.
States with highest average self-employment income among moms who are self-employed
| Rank | State | Avg. income |
|---|---|---|
| 1 | District of Columbia | $46,275 |
| 2 | Hawaii | $36,187 |
| 3 | Alaska | $35,276 |
| 4 | Massachusetts | $35,226 |
| 5 | New Jersey | $34,085 |
| 6 | Oregon | $29,181 |
| 7 | New Hampshire | $28,903 |
| 8 | Washington | $28,006 |
| 9 | Colorado | $27,112 |
| 10 | Minnesota | $27,029 |
A salary isn’t the only area where mompreneurs may fall short.
“Health insurance is an enormously important benefit employed moms may have,” Schulz says. “Vacation and sick days are a big deal, allowing moms to still get paid even if they’re not able to work. Retirement benefits such as a 401(k) match make a big difference, too. Plus, having a predictable, constant paycheck is a tremendous luxury. It allows you to budget more effectively, which can help make it easier to work toward financial goals.”
Hawaii (66.2%), Alaska (58.1%) and South Dakota (52.8%) top the list for moms’ self-employment earnings as a percentage of wage-earning moms’ income. For self-employed moms compared to self-employed individuals, Alaska (74.5%), Hawaii (69.1%) and Oregon (63.1%) lead.
States with highest self-employment income among moms as percentage of self-employment income
| Rank | State | % of self-employment income |
|---|---|---|
| 1 | Alaska | 74.5% |
| 2 | Hawaii | 69.1% |
| 3 | Oregon | 63.1% |
| 4 | Massachusetts | 57.9% |
| 5 | New Jersey | 57.8% |
| 6 | New Mexico | 55.2% |
| 7 | Colorado | 53.9% |
| 7 | Nebraska | 53.9% |
| 9 | Nevada | 52.2% |
| 10 | North Carolina | 52.1% |
Making it as a mompreneur: Top expert tips
It’s not easy to start your own business, especially if you’re juggling motherhood alongside it. If you’re trying to make it as a mompreneur, Schulz offers the following advice.
- Take advantage of resources. “There are many, many organizations to help small businesses get rolling and stay afloat,” he says. “Whether you’re looking for help with training, funding, networking or any other aspect of business, there are resources out there. Googling ‘small business resources near me’ can be a great place to start.”
- Make a plan. “It has never been easier to start a small business, but that doesn’t mean that you should rush into it,” he says. “Taking the time to devise a plan, even a rudimentary one, is a must. As the saying goes, failing to plan is planning to fail, which is certainly true when it comes to starting a small business.”
- Build a support system. You don’t have to do it all alone. Whether it’s leaning on family for child care, connecting with other mompreneurs or hiring help when you can afford it, having a solid support system can make all the difference. Entrepreneurship is tough, but having people in your corner makes it a little easier.
Methodology
LendingTree researchers analyzed microdata from the U.S. Census Bureau 2023 American Community Survey with one-year estimates to rank the best states for “mompreneurs,” or self-employed mothers with minor children at home.
Moms are defined as women caring for their own minor children, including adopted children and stepchildren in the household. We scored based on the following five metrics that focused on the popularity and financial success of mompreneurship:
- The percentage of moms who are self-employed (both incorporated and not incorporated)
- The percentage of self-employed people who are moms
- The average self-employment income among moms who are self-employed (excludes incomes of less than $4 annually)
- The percentage or ratio of average self-employment income among moms compared to the average earned wages among moms
- The percentage or ratio of average self-employed income among moms compared to the average self-employment income among all self-employed people
Each of these was scored according to where it fell in the scale from greatest to smallest value, with the greatest value always equaling 100 and the lowest always equaling zero. These five scores were then averaged (equally weighted) to create a score between 100 and zero. The states were ranked from high to low according to this score.
Compare business loan offers