For 4th Year in Row, Atlanta Has Highest Share of Black-Owned Businesses
February is Black History Month, which raises awareness of the contributions of Black Americans and the inequalities they face. Those disparities extend into the business world, where Black entrepreneurs encounter significant barriers, including underrepresentation. As of 2023 — the latest available data — only 3.4% of U.S. businesses are Black-owned.
This study examines where Black-owned businesses are most and least represented across major U.S. metros and how those patterns are changing.
- 3.4% of U.S. businesses are Black-owned, according to 2023 data — the latest available. Meanwhile, 80.6% are white-owned, and 11.5% are Asian-owned. The share of Black-owned businesses is nearly identical to where it was in 2022, at 3.3%.
- For the fourth year in a row, Atlanta remains the hub for Black-owned businesses. In Atlanta, 10.7% of businesses are Black-owned. Fayetteville, N.C. (9.9%), and Washington, D.C. (9.4%), rank second and third, respectively.
- For the second year in a row, Salt Lake City has the lowest share of Black-owned businesses. Here, just 0.5% of businesses are Black-owned. Honolulu (0.7%) is the only other metro under 1.0%, with Boulder, Colo. (1.0%), ranking next closest.
- About 1 in 4 Black-owned businesses are in the health care and social assistance industry. 26.2% of Black-owned businesses were in this industry in 2023, up from 25.6% in 2022. Professional, scientific and technical services (14.0%) and administrative and support and waste management and remediation services (8.1%) follow.
- Women maintain a significant share of Black-owned businesses, but their businesses are more likely to be young. 39.3% of Black-owned businesses are owned by women. However, women are slightly more likely to have young businesses. While 24.9% of Black-owned businesses are less than 2 years old, that figure rises to 26.8% among Black women-owned businesses.
3.4% of U.S. businesses are Black-owned
Only 3.4% of businesses in the U.S. are Black-owned, according to 2023 data, which is the latest available. This rate stands in stark contrast to the portion of companies owned by white and Asian Americans — 80.6% and 11.5%, respectively. It’s also disproportionate to the share of the U.S. Black population, which is 14.4%.
Despite the low representation, the percentage of Black-owned businesses in the country has increased in recent years. In 2020, only 2.4% of the country’s companies were Black-owned, with that percentage rising to 2.7% in 2021 and 3.3% in 2022.
The persistent low share of Black-owned businesses partly reflects ongoing structural barriers that many entrepreneurs of color face. Research indicates that access to funding remains a central challenge: Black founders are more likely to rely on personal savings or high-interest credit because of loan-denial disparities and lower intergenerational wealth than their white counterparts. This can limit both startup activity and long-term growth.
Percentage of businesses by race
| Race | # of businesses | % of businesses |
|---|---|---|
| White | 4,781,975 | 80.6% |
| Asian | 684,916 | 11.5% |
| Black or African American | 200,885 | 3.4% |
| American Indian and Alaska Native | 55,118 | 0.9% |
| Native Hawaiian and other Pacific Islander | 9,413 | 0.2% |
The minimal growth in Black-owned businesses between 2022 and 2023 (0.1 percentage point) is also likely a reflection of post-pandemic economic shifts.
“High prices and high interest rates don’t just cause challenges for consumers. They’re tough on businesses and can scare aspiring entrepreneurs away from taking that next step,” says Matt Schulz, LendingTree chief consumer finance analyst and author of “Ask Questions, Save Money, Make More: How to Take Control of Your Financial Life.”
“The growth that we saw in 2020 and the years immediately following happened, at least to some degree, because Americans had a lot more money in their pockets during that time,” Schulz says.
“They spent less because of lockdowns and other restrictions. They also received government stimulus checks, which, along with the reduced spending, made it possible for them to pay down their debts, save more money and have more expendable income for things like starting a small business.
“Today, that’s all faded into memory, and stubborn inflation and high interest rates are making things tough on most anyone. As much as people would love to start a small business or inject more funds into their current business, it just may not be possible.”
Atlanta continues to have highest rate of Black-owned businesses
Atlanta has the highest share of Black-owned companies among the 100 metros analyzed. In the Georgia capital, 10.7% of companies are Black-owned — 13,091 of the metro’s 122,550 businesses — placing it first in this study for the fourth consecutive year.
Atlanta’s continued high ranking is likely tied to several structural and demographic factors. Roughly one-third (33.5%) of the metro’s population is Black, creating a larger base of potential business owners. The area also has a long history of Black economic activity, supported by strong community networks, local entrepreneurship programs and a high concentration of historically Black colleges and universities (HBCUs), all of which help foster business formation and growth.
Although Atlanta continues to rank first, the share of Black-owned businesses there did dip slightly from the previous year’s study. Though the metro’s portion of Black-owned businesses rose steadily from 7.4% in 2020 to 8.8% in 2021, peaking at 11.3% in 2022, it declined to 10.7% in 2023 — reflecting the national slowdown in growth among Black-owned businesses.
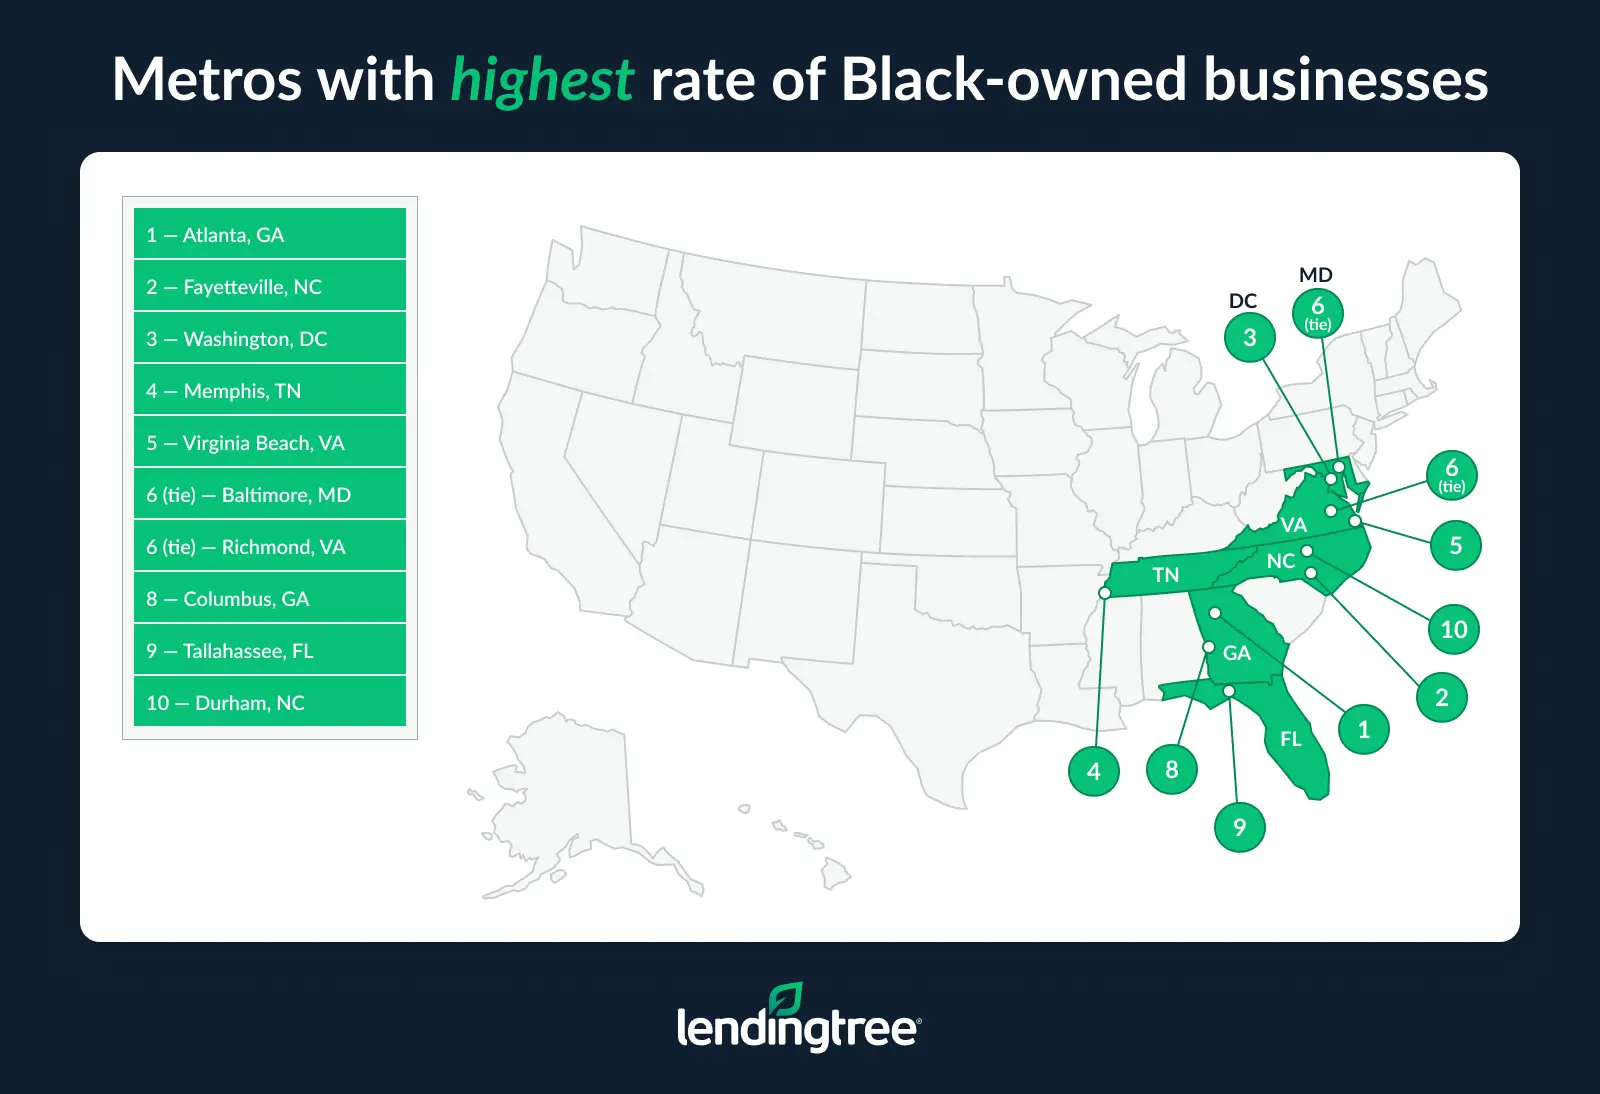
After Atlanta, Fayetteville, N.C., ranks second with 9.9% of its businesses Black-owned. The metro has placed second for two consecutive years, although its share of Black-owned businesses dipped slightly from 10.1% in 2022.
Washington, D.C., ranks third at 9.4%. The metro climbed from fifth place in our analysis last year, although its share of Black-owned businesses increased only modestly from 9.2%.
By contrast, Virginia Beach, Va., which ranked third last year with 9.4% of its businesses Black-owned, fell in both share and rank. The metro now ranks fifth at 8.8%.
Salt Lake City has lowest rate of Black-owned businesses
Salt Lake City ranks last among the 100 metros analyzed, with just 0.5% of its companies Black-owned. Honolulu ranks second-lowest, at 0.7%, making it the only other metro — besides Salt Lake City — with a share below 1.0%. Boulder, Colo., follows closely behind, ranking third-lowest at 1.0%.
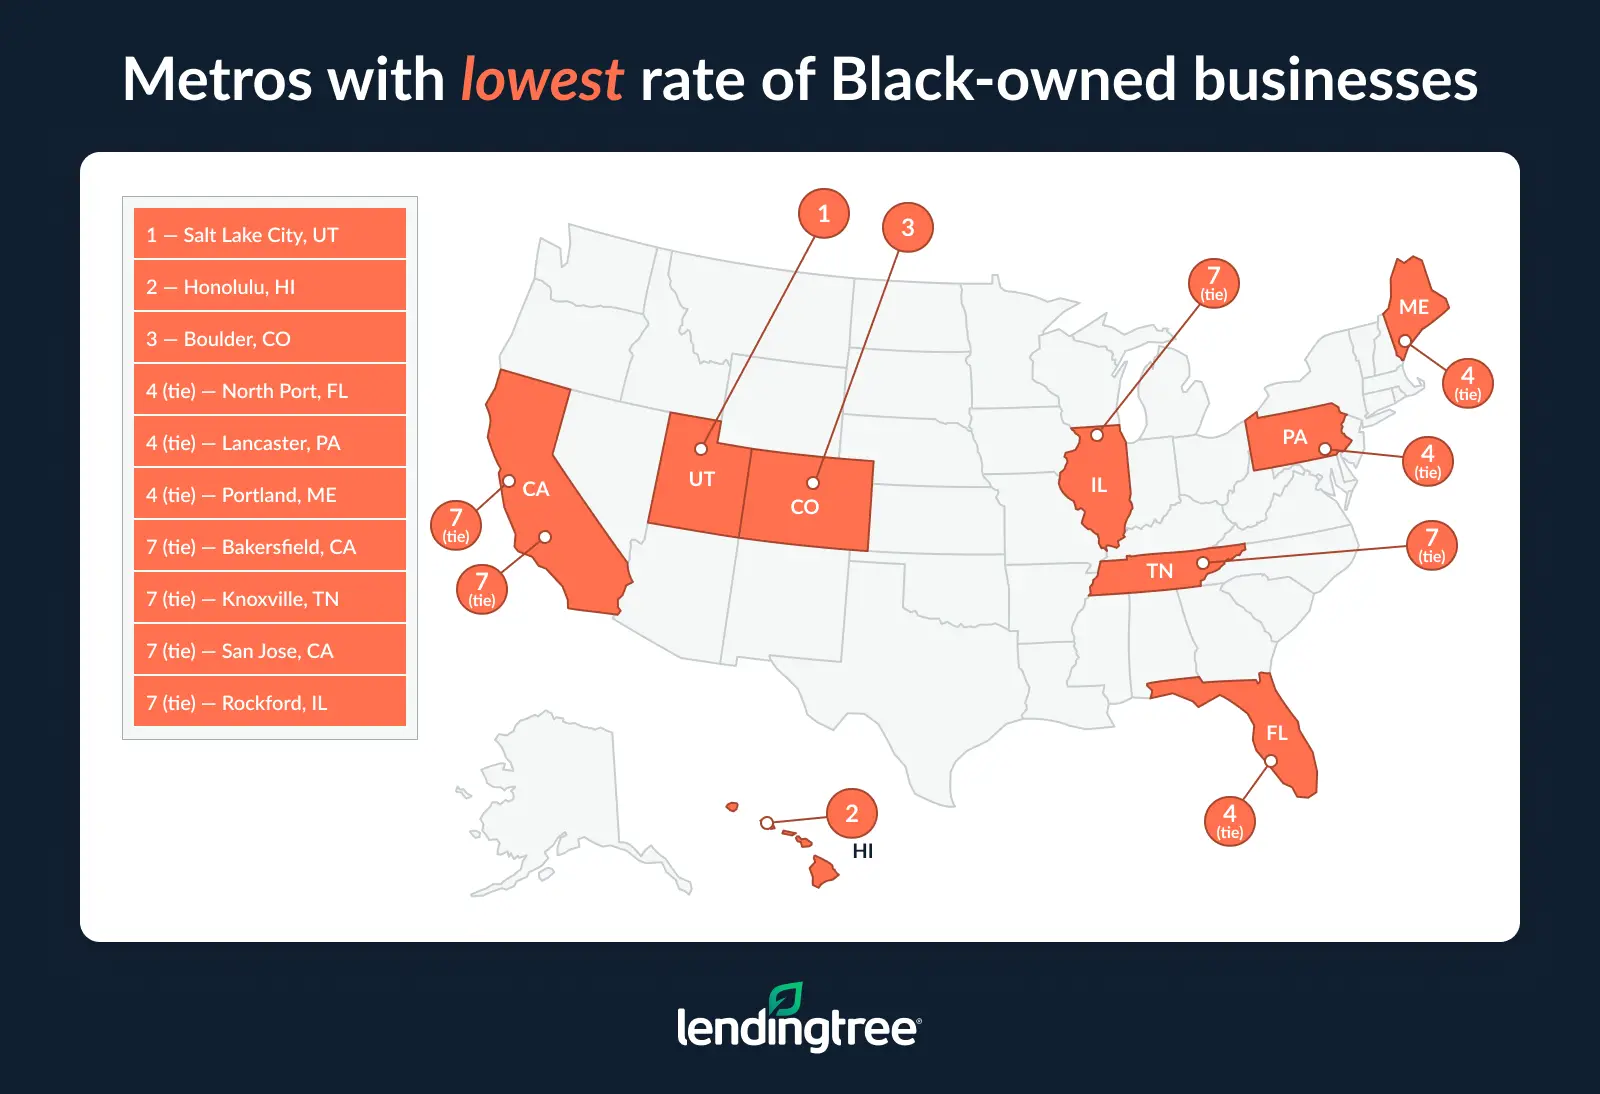
Last year’s lowest-ranked metros differed slightly. This is the second consecutive year that Salt Lake City placed last, with a 0.8% share of Black-owned businesses in the previous analysis. However, Honolulu and Boulder didn’t appear among the 100 metros with the most Black-owned businesses in last year’s study.
San Jose, Calif., had the second-lowest share of Black business owners (1.0%) in last year’s analysis, but it jumped to 91st place this year, with an increased 1.5% share of Black-owned businesses. Meanwhile, North Port, Fla., slightly improved its standing, moving from the third-lowest last year, with a 1.3% share of Black-owned businesses, to the fourth-lowest, although its share decreased slightly to 1.1%.
Full rankings: Percentage of Black-owned businesses by metro
| Rank | Metro | # of businesses | # of Black-owned businesses | % of businesses that are Black-owned | % of population that’s Black |
|---|---|---|---|---|---|
| 1 | Atlanta, GA | 122,550 | 13,091 | 10.7% | 33.5% |
| 2 | Fayetteville, NC | 4,789 | 472 | 9.9% | 37.3% |
| 3 | Washington, DC | 112,724 | 10,627 | 9.4% | 24.4% |
| 4 | Memphis, TN | 16,251 | 1,477 | 9.1% | 46.6% |
| 5 | Virginia Beach, VA | 26,640 | 2,357 | 8.8% | 29.3% |
| 6 | Baltimore, MD | 52,245 | 4,201 | 8.0% | 28.6% |
| 6 | Richmond, VA | 25,043 | 2,011 | 8.0% | 27.3% |
| 8 | Columbus, GA | 4,889 | 379 | 7.8% | 42.0% |
| 9 | Tallahassee, FL | 7,440 | 563 | 7.6% | 30.4% |
| 10 | Durham, NC | 11,145 | 837 | 7.5% | 22.2% |
| 11 | Burlington, NC | 2,950 | 206 | 7.0% | 19.2% |
| 12 | Columbia, SC | 13,954 | 963 | 6.9% | 32.8% |
| 12 | Greensboro, NC | 14,936 | 1,028 | 6.9% | 26.3% |
| 14 | Augusta, GA | 8,306 | 565 | 6.8% | 34.2% |
| 14 | Baton Rouge, LA | 14,755 | 1,003 | 6.8% | 33.9% |
| 16 | Charlotte, NC | 51,955 | 3,394 | 6.5% | 21.5% |
| 16 | Montgomery, AL | 5,849 | 378 | 6.5% | 43.8% |
| 18 | Huntsville, AL | 7,547 | 482 | 6.4% | 21.6% |
| 19 | Shreveport, LA | 6,865 | 412 | 6.0% | 38.9% |
| 19 | Lakeland, FL | 11,317 | 678 | 6.0% | 15.1% |
| 19 | Flint, MI | 5,605 | 334 | 6.0% | 18.4% |
| 22 | Houston, TX | 120,160 | 7,101 | 5.9% | 17.5% |
| 23 | New Orleans, LA | 18,120 | 1,058 | 5.8% | 37.4% |
| 24 | Miami, FL | 184,959 | 9,897 | 5.4% | 19.3% |
| 25 | Indianapolis, IN | 35,587 | 1,822 | 5.1% | 15.1% |
| 26 | Jacksonville, FL | 35,398 | 1,774 | 5.0% | 20.2% |
| 27 | Raleigh, NC | 29,030 | 1,428 | 4.9% | 18.7% |
| 28 | Philadelphia, PA | 116,015 | 5,435 | 4.7% | 20.2% |
| 29 | Milwaukee, WI | 27,733 | 1,260 | 4.5% | 15.6% |
| 29 | Dallas, TX | 137,875 | 6,251 | 4.5% | 16.5% |
| 29 | Savannah, GA | 8,193 | 365 | 4.5% | 30.7% |
| 32 | Albany, GA | 2,457 | 108 | 4.4% | 53.5% |
| 33 | Tampa, FL | 71,518 | 3,073 | 4.3% | 11.7% |
| 34 | Dover, DE | 4,068 | 168 | 4.1% | 25.4% |
| 34 | Port St. Lucie, FL | 11,509 | 475 | 4.1% | 16.2% |
| 36 | Cleveland, OH | 38,624 | 1,546 | 4.0% | 18.5% |
| 36 | Charleston, SC | 17,766 | 707 | 4.0% | 21.5% |
| 38 | Minneapolis, MN | 74,019 | 2,906 | 3.9% | 10.0% |
| 39 | New York, NY | 458,820 | 17,042 | 3.7% | 15.7% |
| 40 | Spartanburg, SC | 6,072 | 212 | 3.5% | 18.5% |
| 40 | Cincinnati, OH | 33,466 | 1,163 | 3.5% | 11.6% |
| 40 | Las Vegas, NV | 42,644 | 1,481 | 3.5% | 12.1% |
| 43 | Lexington Park, MD | 3,352 | 115 | 3.4% | 14.7% |
| 43 | Hartford, CT | 20,512 | 695 | 3.4% | 11.4% |
| 45 | Toledo, OH | 9,351 | 312 | 3.3% | 13.9% |
| 45 | Kansas City, MO | 40,183 | 1,312 | 3.3% | 11.4% |
| 45 | Bridgeport, CT | 20,734 | 675 | 3.3% | 10.5% |
| 48 | Nashville, TN | 34,135 | 1,055 | 3.1% | 13.6% |
| 48 | Providence, RI | 32,086 | 979 | 3.1% | 5.6% |
| 50 | Chicago, IL | 191,463 | 5,668 | 3.0% | 15.5% |
| 51 | Deltona, FL | 12,588 | 368 | 2.9% | 10.3% |
| 51 | Rochester, NY | 17,546 | 512 | 2.9% | 10.8% |
| 53 | Seattle, WA | 82,891 | 2,353 | 2.8% | 6.3% |
| 54 | Colorado Springs, CO | 15,326 | 413 | 2.7% | 5.5% |
| 54 | Boston, MA | 100,798 | 2,691 | 2.7% | 7.1% |
| 56 | Riverside, CA | 68,452 | 1,800 | 2.6% | 6.8% |
| 56 | Akron, OH | 11,296 | 295 | 2.6% | 12.3% |
| 56 | Louisville, KY | 22,270 | 571 | 2.6% | 12.3% |
| 56 | Los Angeles, CA | 336,814 | 8,632 | 2.6% | 6.2% |
| 60 | Vallejo, CA | 6,300 | 159 | 2.5% | 12.3% |
| 60 | San Antonio, TX | 36,579 | 897 | 2.5% | 7.3% |
| 62 | Allentown, PA | 13,162 | 316 | 2.4% | 6.2% |
| 62 | Oklahoma City, OK | 30,237 | 722 | 2.4% | 9.4% |
| 62 | Phoenix, AZ | 84,672 | 2,006 | 2.4% | 5.8% |
| 65 | Wichita, KS | 10,440 | 243 | 2.3% | 7.6% |
| 65 | Chattanooga, TN | 9,378 | 217 | 2.3% | 11.5% |
| 65 | New Haven, CT | 10,593 | 243 | 2.3% | 13.5% |
| 65 | Denver, CO | 70,391 | 1,611 | 2.3% | 6.0% |
| 65 | Austin, TX | 49,673 | 1,136 | 2.3% | 7.4% |
| 70 | San Francisco, CA | 100,859 | 2,232 | 2.2% | 6.6% |
| 70 | Dayton, OH | 11,037 | 242 | 2.2% | 14.3% |
| 70 | Omaha, NE | 19,490 | 424 | 2.2% | 7.7% |
| 73 | Portland, OR | 56,235 | 1,209 | 2.1% | 3.1% |
| 73 | Sacramento, CA | 43,985 | 936 | 2.1% | 6.6% |
| 73 | Pittsburgh, PA | 42,146 | 889 | 2.1% | 7.7% |
| 73 | Panama City, FL | 4,360 | 90 | 2.1% | 7.7% |
| 77 | Albuquerque, NM | 14,243 | 290 | 2.0% | 3.1% |
| 77 | Norwich, CT | 4,922 | 98 | 2.0% | 5.5% |
| 79 | Lynchburg, VA | 4,698 | 91 | 1.9% | 14.9% |
| 79 | Tulsa, OK | 18,528 | 351 | 1.9% | 7.1% |
| 79 | Manchester, NH | 8,718 | 165 | 1.9% | 2.6% |
| 79 | Worcester, MA | 15,427 | 288 | 1.9% | 5.4% |
| 83 | Daphne, AL | 4,968 | 89 | 1.8% | 8.3% |
| 83 | Tucson, AZ | 16,265 | 290 | 1.8% | 3.9% |
| 85 | Corpus Christi, TX | 7,775 | 135 | 1.7% | 3.6% |
| 85 | Myrtle Beach, SC | 8,498 | 145 | 1.7% | 11.3% |
| 87 | Lexington, KY | 9,905 | 162 | 1.6% | 9.9% |
| 87 | Midland, TX | 5,282 | 86 | 1.6% | 7.7% |
| 87 | Anchorage, AK | 9,165 | 146 | 1.6% | 3.1% |
| 87 | Fresno, CA | 16,142 | 251 | 1.6% | 4.2% |
| 91 | Rockford, IL | 6,112 | 93 | 1.5% | 9.2% |
| 91 | San Jose, CA | 41,139 | 618 | 1.5% | 2.2% |
| 91 | Knoxville, TN | 13,742 | 203 | 1.5% | 5.0% |
| 91 | Bakersfield, CA | 11,098 | 163 | 1.5% | 5.2% |
| 95 | Portland, ME | 15,784 | 174 | 1.1% | 2.4% |
| 95 | Lancaster, PA | 9,799 | 105 | 1.1% | 3.1% |
| 95 | North Port, FL | 21,818 | 230 | 1.1% | 5.4% |
| 98 | Boulder, CO | 11,211 | 114 | 1.0% | 1.0% |
| 99 | Honolulu, HI | 15,796 | 107 | 0.7% | 2.3% |
| 100 | Salt Lake City, UT | 28,143 | 127 | 0.5% | 2.0% |
Health care, social assistance is top industry for Black-owned businesses
In 2023, 26.2% of Black-owned businesses operated in the health care and social assistance industry, making it the most represented sector among Black business owners. This category — which includes medical and dental services, child care and community relief — has consistently ranked first in this study, accounting for 25.6% of Black-owned businesses in 2022 and 28.0% in 2021.
Professional, scientific and technical services was the second most common industry, representing 14.0% of Black-owned businesses in 2023, up slightly from 13.6% in 2022. This sector includes legal services, accounting, architecture and consulting. Administrative and support and waste management and remediation services followed at 8.1%, nearly unchanged from 8.3% in 2022. This industry includes administrative services, employment services and travel-related businesses.
At the other end of the spectrum, some industries remain minimally represented. The utilities sector had only 57 Black-owned businesses. Meanwhile, management of companies and enterprises had 176, accounting for just 0.1% of firms with Black owners, unchanged from the previous year.
Percentage of Black-owned businesses by industry
| Industry | # of Black-owned businesses | % of Black-owned businesses |
|---|---|---|
| Health care and social assistance | 52,561 | 26.2% |
| Professional, scientific and technical services | 28,185 | 14.0% |
| Administrative and support and waste management and remediation services | 16,371 | 8.1% |
| Construction | 14,355 | 7.1% |
| Other services (except public administration) | 13,779 | 6.9% |
| Accommodation and food services | 13,728 | 6.8% |
| Real estate and rental and leasing | 7,449 | 3.7% |
| Arts, entertainment and recreation | 6,539 | 3.3% |
| Finance and insurance | 6,470 | 3.2% |
| Educational services | 4,113 | 2.0% |
| Wholesale trade | 3,191 | 1.6% |
| Information | 2,303 | 1.1% |
| Industries not classified | 651 | 0.3% |
| Management of companies and enterprises | 176 | 0.1% |
| Utilities | 57 | 0.0% |
39.3% of Black-owned businesses are women-led
A substantial share of Black-owned businesses — 39.3% — are headed by women, an increase of 0.2 percentage points compared to the previous year (39.1%).
The rate of business ownership among Black women has increased rapidly over the past decade. From 2014 to 2019, the number of businesses owned by Black women grew by 50%, the highest growth rate of any female demographic, according to a J.P. Morgan report.
Despite the growth, Black women entrepreneurs face disproportionate challenges in both launching and growing their businesses. For instance, Black women are far more likely to self-fund their startups, and research from Brookings indicates that employer businesses (those with at least one employee) owned by Black women are more likely to serve as a secondary source of income, as opposed to their primary source, which limits potential business growth.
Percentage of Black-owned businesses by gender
| Gender | # of Black-owned businesses | % of Black-owned businesses |
|---|---|---|
| Female | 79,020 | 39.3% |
| Male | 109,123 | 54.3% |
| Equally male-/female-owned | 12,742 | 6.3% |
More than half (56.5%) of Black-owned businesses are under 6 years old, significantly higher than the 38.5% of all companies regardless of the owner’s race; 24.9% have been operating for less than two years, and another 19.9% are between 2 and 3 years old. For context, the six-year mark is widely considered the point of maturity for a new business.
Black women-owned businesses are even more likely to be young, with 26.8% operating for less than two years.
Percentage of Black-owned businesses by firm age
| Firm age | # of Black-owned businesses | # of women-run Black-owned businesses | % of Black-owned businesses | % of women-run Black-owned businesses |
|---|---|---|---|---|
| Less than 2 years | 50,068 | 21,161 | 24.9% | 26.8% |
| 2 to 3 years | 39,917 | 16,571 | 19.9% | 21.0% |
| 4 to 5 years | 23,481 | 9,196 | 11.7% | 11.6% |
| 6 to 10 years | 35,009 | 13,999 | 17.4% | 17.7% |
| 11 to 15 years | 19,925 | 7,051 | 9.9% | 8.9% |
| 16 or more years | 32,485 | 11,041 | 16.2% | 14.0% |
The most prevalent revenue level for Black-owned businesses is $100,000 to $249,999, accounting for 22.8% of companies. This share increases to 24.5% among women-run Black-owned businesses. Another 20.1% of Black-owned businesses generate $250,000 to $499,999, roughly the same share as among Black women-owned businesses (20.2%).
Percentage of Black-owned businesses by sales
| Firm sales | # of Black-owned businesses | # of women-run Black-owned businesses | % of Black-owned businesses | % of women-run Black-owned businesses |
|---|---|---|---|---|
| Sales/receipts of less than $5,000 | 2,509 | 1,228 | 1.2% | 1.6% |
| Sales/receipts of $5,000 to $9,999 | 3,300 | 1,722 | 1.6% | 2.2% |
| Sales/receipts of $10,000 to $24,999 | 7,383 | 3,409 | 3.7% | 4.3% |
| Sales/receipts of $25,000 to $49,999 | 11,594 | 5,370 | 5.8% | 6.8% |
| Sales/receipts of $50,000 to $99,999 | 21,321 | 9,358 | 10.6% | 11.8% |
| Sales/receipts of $100,000 to $249,999 | 45,783 | 19,398 | 22.8% | 24.5% |
| Sales/receipts of $250,000 to $499,999 | 40,390 | 15,996 | 20.1% | 20.2% |
| Sales/receipts of $500,000 to $999,999 | 31,138 | 11,295 | 15.5% | 14.3% |
| Sales/receipts of $1,000,000 to $2,499,999 | 22,595 | 7,391 | 11.2% | 9.4% |
| Sales/receipts of $2,500,000 to $4,999,999 | 8,238 | 2,310 | 4.1% | 2.9% |
| Sales/receipts of $5,000,000 or more | 6,633 | 1,544 | 3.3% | 2.0% |
Expert tips for new Black entrepreneurs
Starting and sustaining a business is challenging, but entrepreneurs can take steps to improve their odds of success. For aspiring Black business owners, experts recommend the following:
- Seek out targeted funding and support programs. “It’s tough to start a small business, but there are loads of organizations that want to help,” Schulz says. Small business grants, accelerators and loan programs designed for minority-owned businesses can provide both capital and mentorship, helping close access gaps. “Googling ‘small business resources near me’ can be a great place to start,” Schulz advises.
- Build community and professional connections. Actively joining networking groups, industry associations, local chambers of commerce and entrepreneur meetups can open doors to clients, partnerships and mentorship — a strategy shown to benefit founders who might otherwise be excluded from broader business networks.
- Build strong business credit early. Separating personal and business finances, opening a business bank account and paying vendors on time can help establish business credit, which is critical when applying for small business loans or lines of credit.
- Shop around for the best small business funding rates. “It’s simple advice, but it’s still good: Comparison shopping matters,” Schulz says. “If you’re looking for a small business credit card or a loan, make sure that you compare rates from multiple lenders. There can be significant differences among lenders, and when you’re starting a business, every penny matters.”
Additionally, Schulz encourages aspiring entrepreneurs to develop a business plan to guide their journey. “A business plan is an absolute must. Not only should it provide a North Star for you to follow, but it can also give potential small business lenders a better sense of what your company is all about,” Schulz says.
“Banks aren’t in the business of just giving money to anyone with a half-baked plan,” he cautions. “They want to see where you’re going and what your plans are. A well-thought-out business plan can give that lender more reason to believe in you, and that’s a big deal.”
Methodology
LendingTree researchers analyzed 2023 data from the 2024 U.S. Census Bureau Annual Business Survey to rank the metros with the highest percentage of Black-owned businesses.
Researchers first compiled the number of Black-owned businesses in the 100 metros with the most Black-owned businesses. Analysts then compared that number to the total number of businesses in each metro. The metros with the highest percentage of Black-owned businesses were ranked from highest to lowest.
Population data comes from the U.S. Census Bureau 2024 American Community Survey with one-year estimates.
Compare business loan offers