More Than 1 in 4 Cardholders in Largest US Metros Carry 5-Figure Credit Card Debt
After several years of economic volatility — now compounded by tariffs that are putting additional pressure on prices — the weight of consumer credit card debt has become increasingly burdensome.
An average of 26.5% of American credit cardholders across the 100 largest metros have balances of at least $10,000 — up from 22.6% in 2023, 17.0% in 2021 and 15.5% in 2019.
We utilized LendingTree data from the last quarter of 2025 to determine the percentage of consumers with credit card balances of at least $10,000 and $50,000. Here’s what we found.
- Five-figure credit card debt continues to climb. Across the 100 largest U.S. metros, an average of 26.5% of cardholders have balances of at least $10,000 — up from 22.6% in 2023, 17.0% in 2021 and 15.5% in 2019. That marks a 71.0% increase since 2019, and a 17.3% rise since 2023.
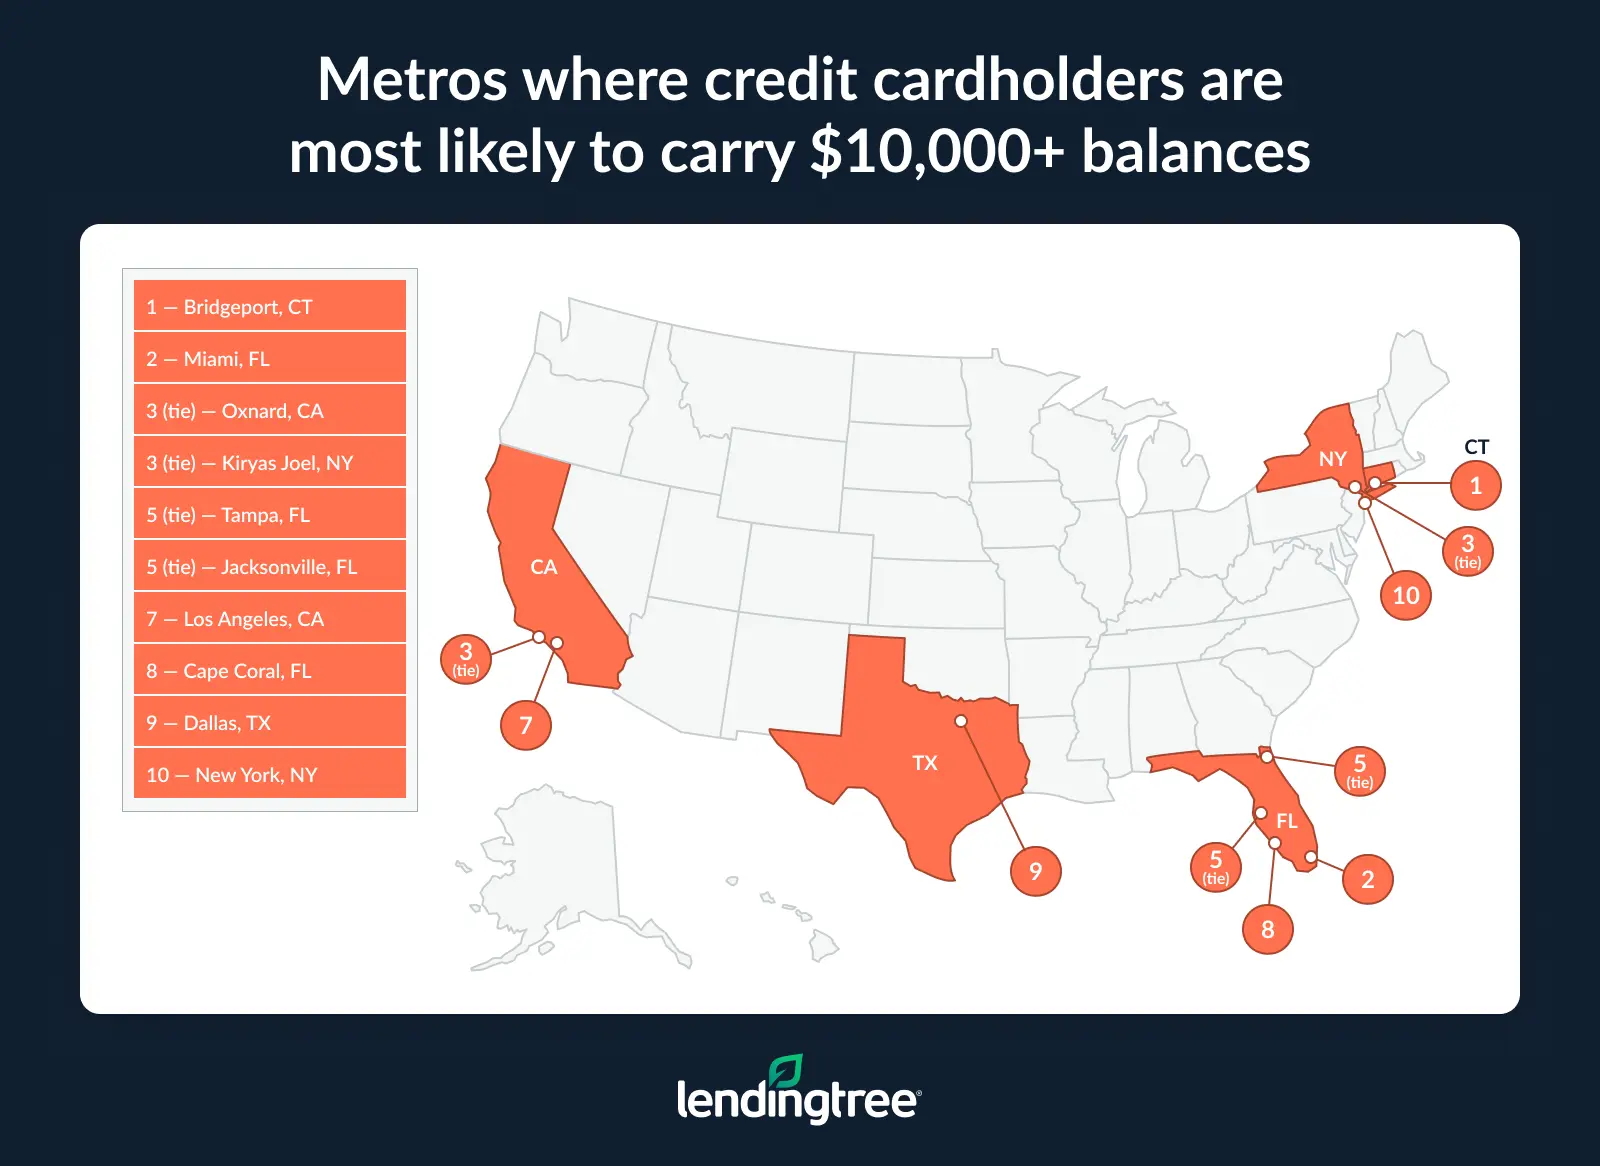
- Twenty of the 100 largest U.S. metros have 30.0% or more of credit cardholders carrying at least $10,000 in credit card debt. Bridgeport, Conn., leads, with 35.9% of cardholders owing at least $10,000. It’s followed by Miami (34.1%), and Oxnard, Calif., and Kiryas Joel, N.Y. (both at 32.7%).
- Only four of the 100 largest metros have fewer than 20.0% of cardholders carrying at least $10,000 in credit card debt. Grand Rapids, Mich., has the smallest percentage of cardholders carrying at least $10,000 at 19.0%, followed by Knoxville, Tenn. (19.4%), Harrisburg, Pa. (19.6%), and Madison, Wis. (19.7%).
- Across the 100 largest metros, 2.7% of cardholders carry at least $50,000 in credit card debt. Bridgeport more than doubles that rate at 5.6%, followed by Oxnard (5.0%) and Miami (4.6%). At the opposite end are Chattanooga, Tenn. (0.5%), Dayton, Ohio (0.9%), and Grand Rapids, Mich. (1.0%).
Percentage of cardholders with 5-figure debt continues to climb
Financial pressures continue to rise, and the share of credit cardholders carrying five-figure debt is growing alongside it. In fact, an average of 26.5% of cardholders across the 100 largest U.S. metros have balances of at least $10,000.
That figure has grown steadily over time, rising from 22.6% in 2023, 17.0% in 2021 and 15.5% in 2019.
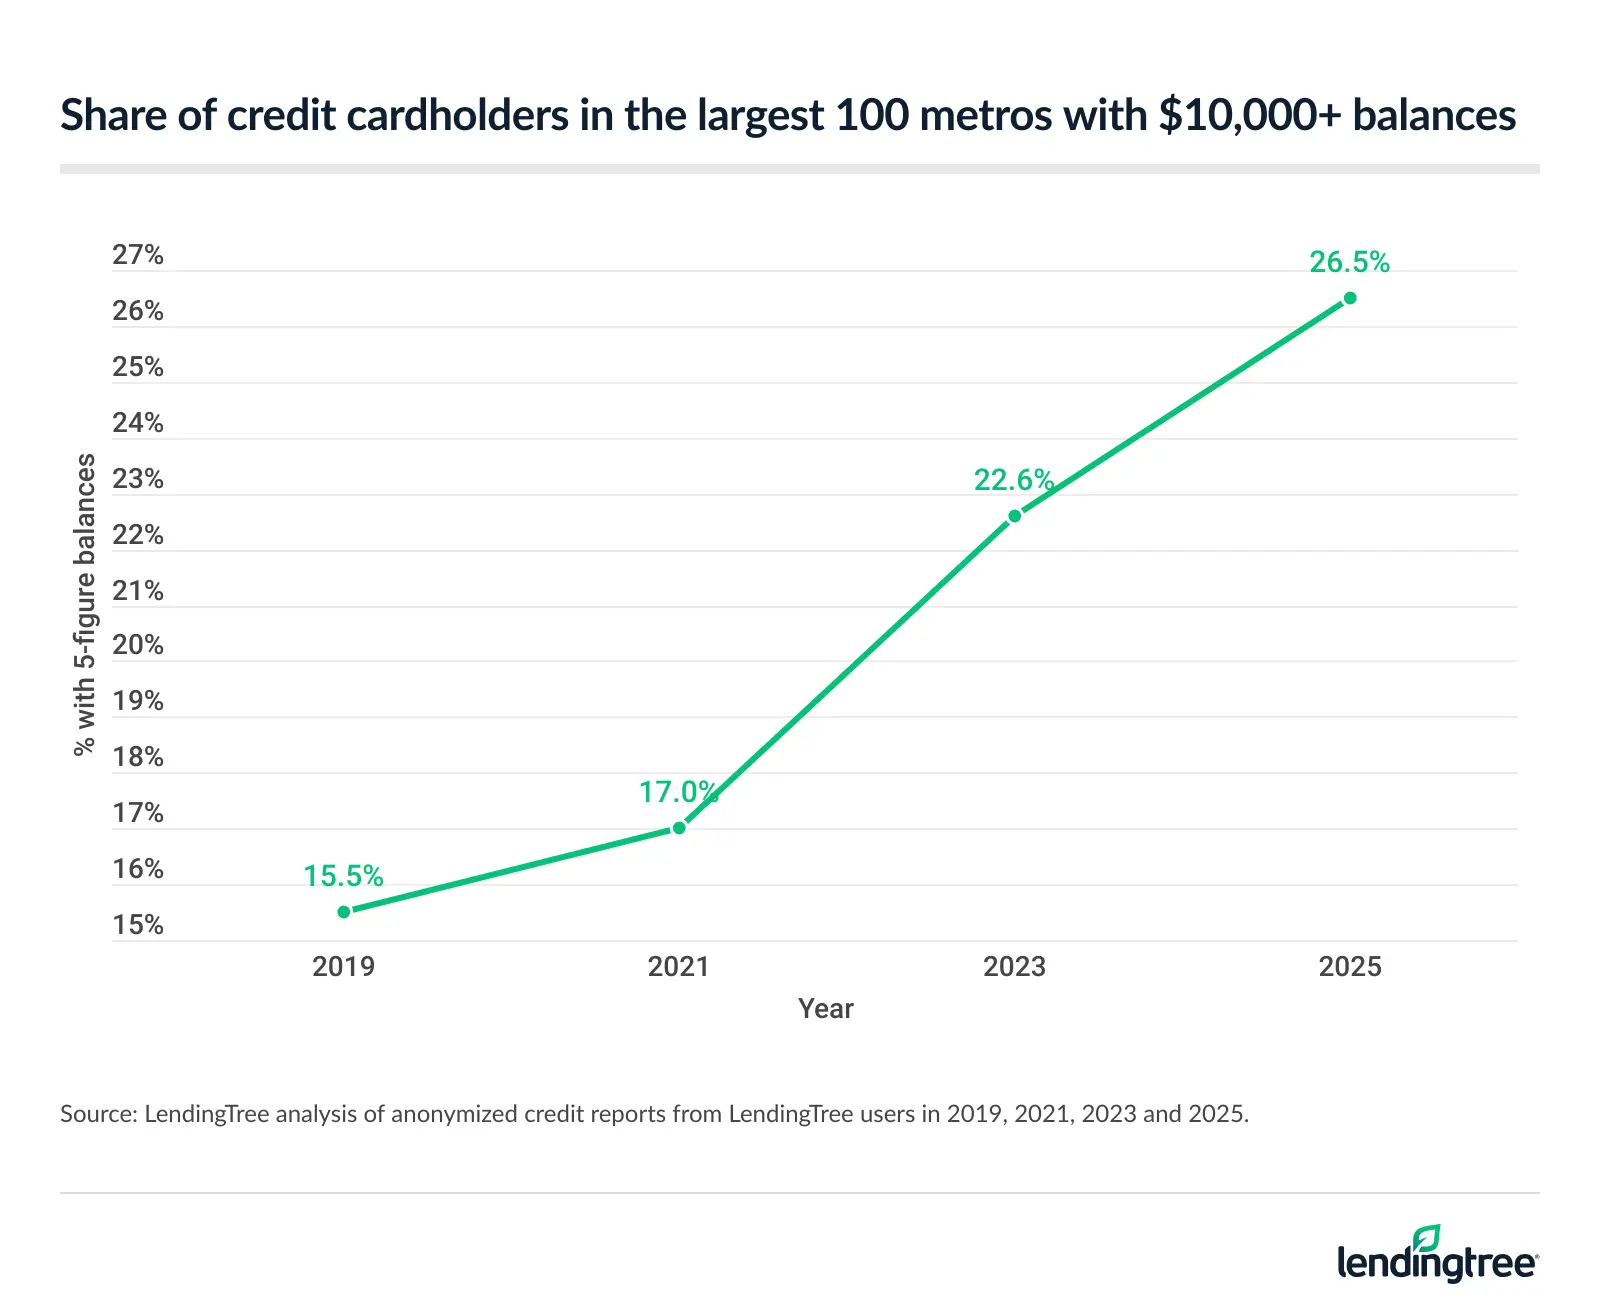
All in all, that means the rate of five-figure credit card debt has risen 71.0% since 2019, and 17.3% since 2023.
The U.S. economy has been tumultuous since the COVID-19 pandemic, with challenges like rising inflation and interest rates, tariffs and more. With that in mind, Matt Schulz, LendingTree chief consumer finance analyst and author of “Ask Questions, Save Money, Make More: How to Take Control of Your Financial Life,” says there’s never one reason for increasing credit card debt.
“Inflation certainly plays a role, as do higher interest rates,” he says. “However, some of this is also a function of the K-shaped economy we’re living in. Some Americans have more debt because they need to take it on to make ends meet. Others are taking on debt because they’re thriving, living their best lives and are completely unconcerned with paying some interest along the way.”
20 of the largest 100 metros have a significant percentage of consumers with 5-figure debt
In total, 20 of the 100 largest U.S. metros have 30.0% or more of credit cardholders carrying at least $10,000 in credit card debt. When we conducted this study in 2023, just four metros met or exceeded that threshold.
Bridgeport, Conn., leads our rankings this year, with 35.9% of cardholders owing at least $10,000. That’s up from 30.6% in 2023, and it marks the metro’s return to the No. 1 spot. Bridgeport previously ranked first in 2021 and 2019, before briefly dipping to No. 4 in 2023.
Miami (34.1%) ranks second, with Oxnard, Calif., and Kiryas Joel, N.Y., tying for third at 32.7%.
Schulz says those figures are concerning. However, he also notes that most Americans still seem to be managing their credit relatively well, even in the face of record credit card debt.
“Delinquencies are climbing, but they’re not spiking through the roof,” he says. “The problem is that this debt may not be a big deal now, but it could quickly become a major problem. In many cases, all it would take is a brief income reduction, job loss or medical emergency for people’s finances to go sideways in a big hurry.”
On the other end of the list, just four metros have fewer than 20.0% of cardholders carrying at least $10,000 in credit card debt. Grand Rapids, Mich., leads, with just 19.0% of credit cardholders carrying at least $10,000 balances. Knoxville, Tenn. (19.4%), ranks second, with Harrisburg, Pa. (19.6%), and Madison, Wis. (19.7%), rounding out the list.
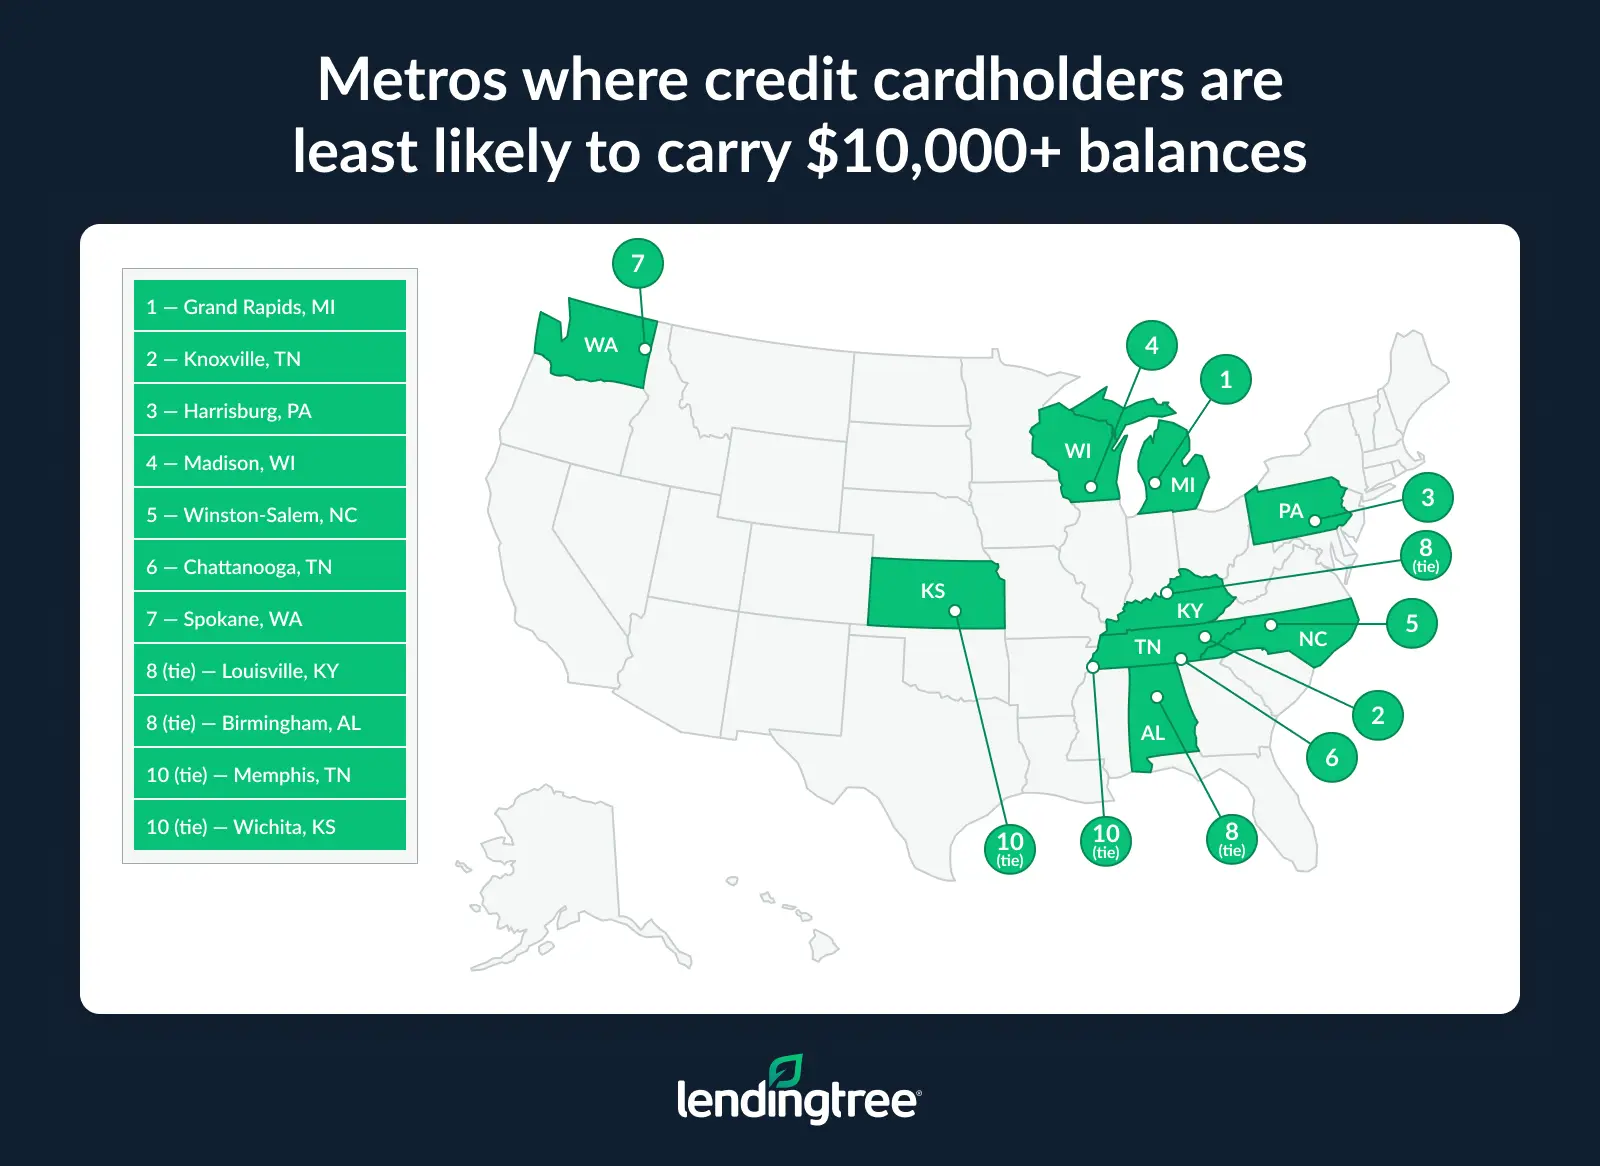
Notably, three of these four metros are in states with higher than average credit scores, with Tennessee as the lone exception.
Additionally, Schulz believes that cost of living plays a major role here. “It’s a whole lot easier to avoid credit card debt in a place that’s more affordable to live in, and that is likely playing a role in these four areas,” he says.
Full rankings: Metros where consumers are most likely to carry 5-figure credit card balances
| Rank | Metro | % of cardholders who owe at least $10,000 |
|---|---|---|
| 1 | Bridgeport, CT | 35.9% |
| 2 | Miami, FL | 34.1% |
| 3 | Oxnard, CA | 32.7% |
| 3 | Kiryas Joel, NY | 32.7% |
| 5 | Tampa, FL | 32.2% |
| 5 | Jacksonville, FL | 32.2% |
| 7 | Los Angeles, CA | 32.1% |
| 8 | Cape Coral, FL | 31.7% |
| 9 | Dallas, TX | 31.6% |
| 10 | New York, NY | 31.5% |
| 11 | San Diego, CA | 31.4% |
| 12 | Washington, DC | 31.2% |
| 13 | Denver, CO | 30.9% |
| 14 | San Francisco, CA | 30.8% |
| 15 | Atlanta, GA | 30.7% |
| 16 | Houston, TX | 30.6% |
| 17 | Boston, MA | 30.4% |
| 18 | Baltimore, MD | 30.2% |
| 18 | Riverside, CA | 30.2% |
| 20 | North Port, FL | 30.1% |
| 21 | Seattle, WA | 29.9% |
| 22 | Colorado Springs, CO | 29.7% |
| 23 | Albany, NY | 29.6% |
| 24 | Hartford, CT | 29.5% |
| 25 | Orlando, FL | 29.4% |
| 25 | Charleston, SC | 29.4% |
| 27 | Sacramento, CA | 29.2% |
| 27 | San Jose, CA | 29.2% |
| 29 | Austin, TX | 29.1% |
| 30 | Honolulu, HI | 28.7% |
| 31 | Fresno, CA | 28.6% |
| 31 | Provo, UT | 28.6% |
| 33 | Providence, RI | 28.5% |
| 34 | Worcester, MA | 28.4% |
| 35 | Palm Bay, FL | 28.3% |
| 36 | Charlotte, NC | 28.1% |
| 37 | El Paso, TX | 28.0% |
| 37 | Raleigh, NC | 28.0% |
| 37 | San Antonio, TX | 28.0% |
| 40 | Virginia Beach, VA | 27.9% |
| 41 | Portland, OR | 27.8% |
| 41 | Chicago, IL | 27.8% |
| 43 | Las Vegas, NV | 27.6% |
| 44 | Phoenix, AZ | 27.3% |
| 44 | New Haven, CT | 27.3% |
| 46 | Syracuse, NY | 27.1% |
| 47 | Tucson, AZ | 26.9% |
| 48 | Kansas City, MO | 26.7% |
| 49 | Ogden, UT | 26.6% |
| 49 | Deltona, FL | 26.6% |
| 49 | Salt Lake City, UT | 26.6% |
| 52 | Philadelphia, PA | 26.5% |
| 52 | Lakeland, FL | 26.5% |
| 54 | Columbia, SC | 26.2% |
| 55 | Richmond, VA | 26.0% |
| 56 | Buffalo, NY | 25.7% |
| 56 | Stockton, CA | 25.7% |
| 58 | Durham, NC | 25.5% |
| 58 | Minneapolis, MN | 25.5% |
| 60 | Greenville, SC | 25.3% |
| 61 | Akron, OH | 25.2% |
| 62 | Augusta, GA | 25.1% |
| 63 | Omaha, NE | 25.0% |
| 64 | Detroit, MI | 24.9% |
| 64 | Bakersfield, CA | 24.9% |
| 66 | Oklahoma City, OK | 24.7% |
| 66 | Columbus, OH | 24.7% |
| 68 | Cincinnati, OH | 24.4% |
| 68 | Nashville, TN | 24.4% |
| 68 | Des Moines, IA | 24.4% |
| 71 | Boise, ID | 24.3% |
| 72 | Pittsburgh, PA | 24.2% |
| 73 | Rochester, NY | 24.0% |
| 73 | New Orleans, LA | 24.0% |
| 75 | Allentown, PA | 23.6% |
| 76 | Greensboro, NC | 23.5% |
| 77 | Cleveland, OH | 23.3% |
| 77 | Fayetteville, AR | 23.3% |
| 79 | Tulsa, OK | 23.2% |
| 79 | St. Louis, MO | 23.2% |
| 81 | Indianapolis, IN | 22.8% |
| 82 | Jackson, MS | 22.7% |
| 82 | Dayton, OH | 22.7% |
| 84 | Albuquerque, NM | 22.5% |
| 85 | Little Rock, AR | 22.4% |
| 86 | Baton Rouge, LA | 22.2% |
| 86 | Milwaukee, WI | 22.2% |
| 86 | Toledo, OH | 22.2% |
| 89 | McAllen, TX | 21.9% |
| 90 | Wichita, KS | 21.8% |
| 90 | Memphis, TN | 21.8% |
| 92 | Birmingham, AL | 21.7% |
| 92 | Louisville, KY | 21.7% |
| 94 | Spokane, WA | 21.4% |
| 95 | Chattanooga, TN | 21.2% |
| 96 | Winston-Salem, NC | 21.0% |
| 97 | Madison, WI | 19.7% |
| 98 | Harrisburg, PA | 19.6% |
| 99 | Knoxville, TN | 19.4% |
| 100 | Grand Rapids, MI | 19.0% |
$50,000+ debt reaches 5.0% or more in 3 metros
Digging even deeper, 2.7% of cardholders across the largest 100 U.S. metros carry at least $50,000 in credit card debt. That’s led again by Bridgeport, with 5.6% of cardholders meeting or exceeding this balance — more than double the national average. Bridgeport ranked third in our 2023 study, when 2.8% of consumers carried $50,000 or more in credit card debt.
Oxnard (5.0%) and Miami (4.6%) follow for this year’s rankings.
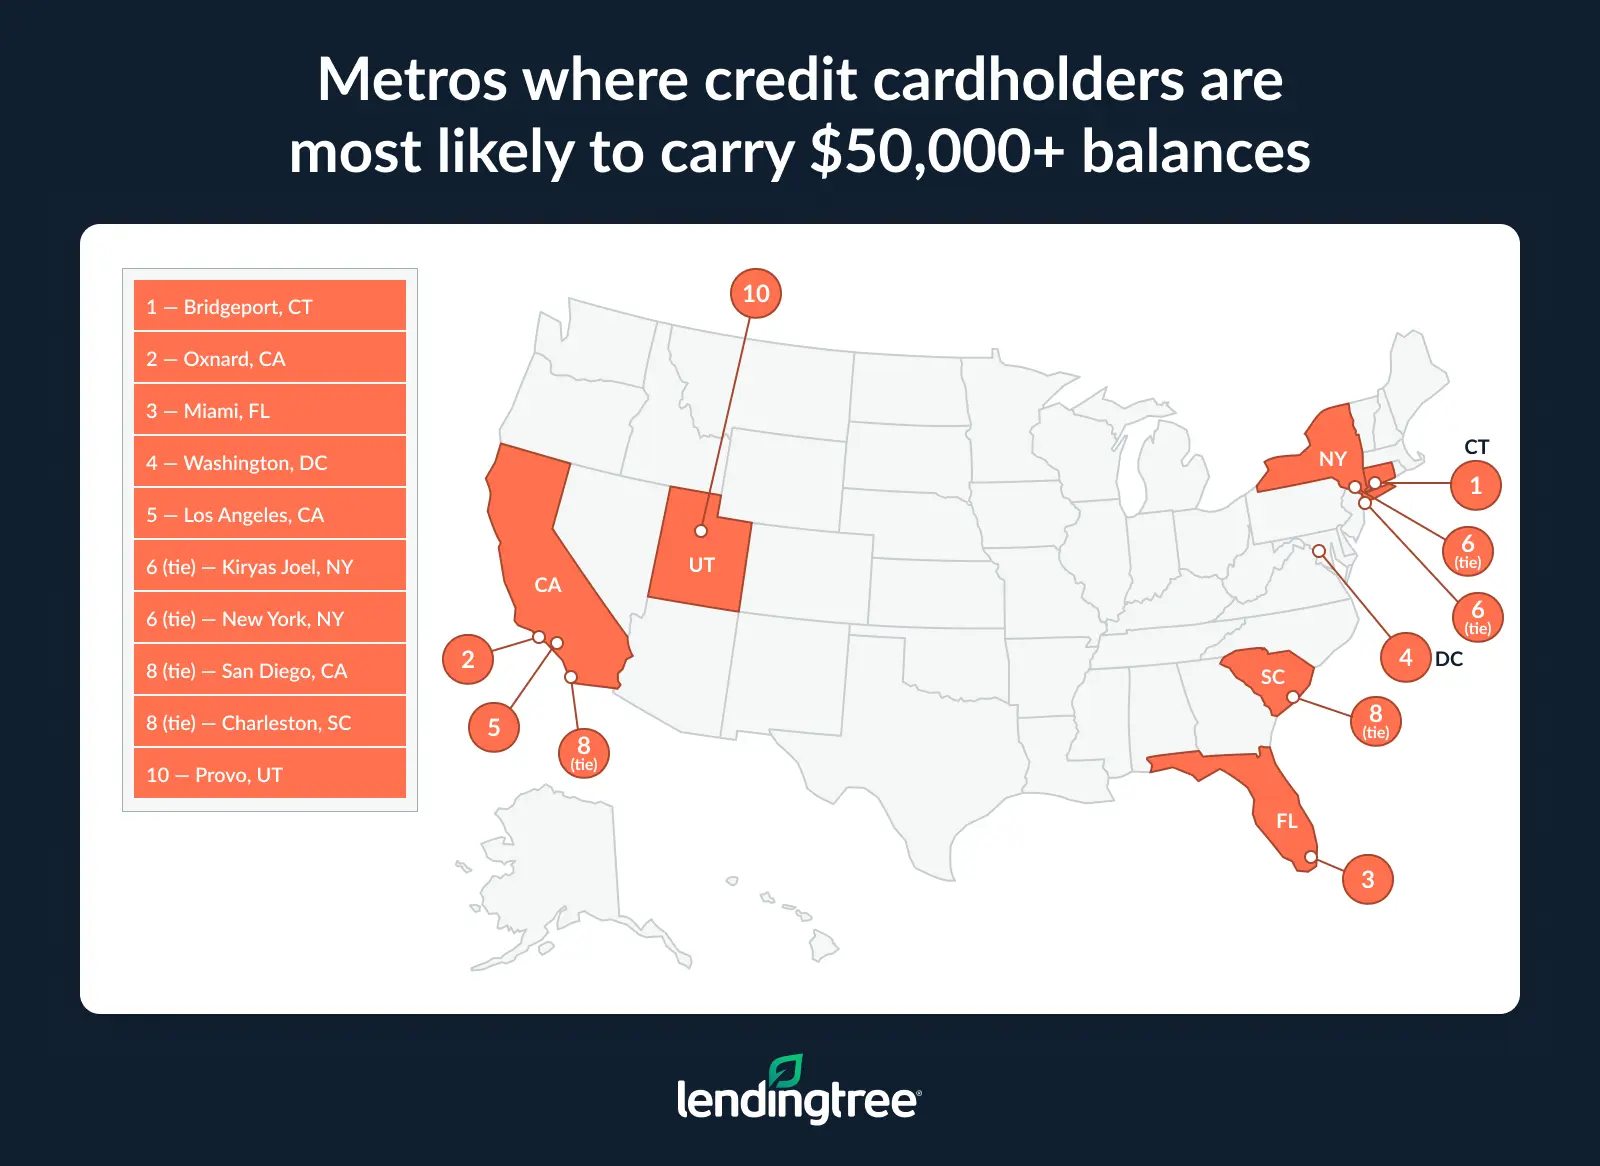
Meanwhile, Chattanooga, Tenn., ranks last, with 0.5% of cardholders carrying similar balances. Dayton, Ohio (0.9%), and Grand Rapids, Mich. (1.0%), round out the bottom three — the only metros at 1.0% or lower.
Full rankings: Metros where consumers are most likely to carry $50,000+ credit card balances
| Rank | Metro | % of cardholders who owe at least $50,000 |
|---|---|---|
| 1 | Bridgeport, CT | 5.6% |
| 2 | Oxnard, CA | 5.0% |
| 3 | Miami, FL | 4.6% |
| 4 | Washington, DC | 4.5% |
| 5 | Los Angeles, CA | 4.2% |
| 6 | Kiryas Joel, NY | 4.1% |
| 6 | New York, NY | 4.1% |
| 8 | San Diego, CA | 4.0% |
| 8 | Charleston, SC | 4.0% |
| 10 | Provo, UT | 3.9% |
| 11 | Denver, CO | 3.7% |
| 11 | San Francisco, CA | 3.7% |
| 11 | Colorado Springs, CO | 3.7% |
| 14 | North Port, FL | 3.6% |
| 14 | San Jose, CA | 3.6% |
| 16 | Houston, TX | 3.5% |
| 16 | Seattle, WA | 3.5% |
| 16 | Austin, TX | 3.5% |
| 16 | Honolulu, HI | 3.5% |
| 20 | Cape Coral, FL | 3.4% |
| 20 | Dallas, TX | 3.4% |
| 20 | Atlanta, GA | 3.4% |
| 20 | Boston, MA | 3.4% |
| 20 | Portland, OR | 3.4% |
| 20 | Syracuse, NY | 3.4% |
| 26 | Jacksonville, FL | 3.3% |
| 26 | Hartford, CT | 3.3% |
| 28 | Sacramento, CA | 3.2% |
| 28 | Palm Bay, FL | 3.2% |
| 28 | Charlotte, NC | 3.2% |
| 28 | Akron, OH | 3.2% |
| 32 | Tampa, FL | 3.1% |
| 32 | Worcester, MA | 3.1% |
| 34 | Riverside, CA | 3.0% |
| 34 | Orlando, FL | 3.0% |
| 34 | Las Vegas, NV | 3.0% |
| 34 | McAllen, TX | 3.0% |
| 38 | Baltimore, MD | 2.9% |
| 38 | San Antonio, TX | 2.9% |
| 38 | Deltona, FL | 2.9% |
| 38 | Philadelphia, PA | 2.9% |
| 38 | Richmond, VA | 2.9% |
| 38 | Durham, NC | 2.9% |
| 44 | Virginia Beach, VA | 2.8% |
| 44 | Phoenix, AZ | 2.8% |
| 44 | Boise, ID | 2.8% |
| 44 | St. Louis, MO | 2.8% |
| 48 | Albany, NY | 2.7% |
| 48 | Kansas City, MO | 2.7% |
| 50 | Chicago, IL | 2.6% |
| 50 | Ogden, UT | 2.6% |
| 50 | Lakeland, FL | 2.6% |
| 50 | Allentown, PA | 2.6% |
| 54 | Fresno, CA | 2.5% |
| 54 | Providence, RI | 2.5% |
| 54 | Raleigh, NC | 2.5% |
| 54 | Columbia, SC | 2.5% |
| 54 | Omaha, NE | 2.5% |
| 59 | Salt Lake City, UT | 2.4% |
| 60 | Augusta, GA | 2.3% |
| 60 | Cincinnati, OH | 2.3% |
| 60 | Winston-Salem, NC | 2.3% |
| 63 | New Haven, CT | 2.2% |
| 63 | Detroit, MI | 2.2% |
| 63 | Pittsburgh, PA | 2.2% |
| 63 | Little Rock, AR | 2.2% |
| 63 | Birmingham, AL | 2.2% |
| 68 | Oklahoma City, OK | 2.1% |
| 68 | Nashville, TN | 2.1% |
| 68 | New Orleans, LA | 2.1% |
| 68 | Tulsa, OK | 2.1% |
| 68 | Wichita, KS | 2.1% |
| 68 | Louisville, KY | 2.1% |
| 74 | Tucson, AZ | 2.0% |
| 74 | Minneapolis, MN | 2.0% |
| 74 | Columbus, OH | 2.0% |
| 74 | Greensboro, NC | 2.0% |
| 74 | Cleveland, OH | 2.0% |
| 74 | Fayetteville, AR | 2.0% |
| 74 | Spokane, WA | 2.0% |
| 81 | Buffalo, NY | 1.9% |
| 81 | Des Moines, IA | 1.9% |
| 81 | Madison, WI | 1.9% |
| 84 | Milwaukee, WI | 1.8% |
| 85 | El Paso, TX | 1.7% |
| 85 | Stockton, CA | 1.7% |
| 85 | Bakersfield, CA | 1.7% |
| 88 | Rochester, NY | 1.6% |
| 88 | Indianapolis, IN | 1.6% |
| 88 | Harrisburg, PA | 1.6% |
| 91 | Greenville, SC | 1.5% |
| 91 | Jackson, MS | 1.5% |
| 93 | Toledo, OH | 1.4% |
| 93 | Memphis, TN | 1.4% |
| 95 | Albuquerque, NM | 1.3% |
| 95 | Baton Rouge, LA | 1.3% |
| 95 | Knoxville, TN | 1.3% |
| 98 | Grand Rapids, MI | 1.0% |
| 99 | Dayton, OH | 0.9% |
| 100 | Chattanooga, TN | 0.5% |
Managing a mountain of credit card debt: Expert tips
If you’re struggling with steep credit card balances, you might be feeling like you’re at your wit’s end. However, paying off your debt isn’t impossible. To keep your head above water as you’re paying off your balances, Schulz recommends the following:
- Lower your interest rate. “This is a huge deal,” he says. “Whether you do it with a 0% balance transfer credit card, a low-interest personal loan or by calling and asking your issuer for a lower APR, reducing your interest rate is about the most impactful thing you can do when it comes to speeding up your ability to pay down your card debt. The better your credit, the better your chances of getting a drastically lower rate. However, every bit of decrease matters, so it’s worth your time to seek out these lower rates.”
- Create a budget, or reassess the one you have. “You simply can’t make a meaningful plan to attack credit card debt without knowing how much money is coming in and going out of your household every month,” he says. “Once you know that, you can make some tough decisions that can help you better align your spending with what really matters to you.”
- Build your emergency savings, too. “This isn’t an either-or situation: You should build your emergency savings while paying down your high-interest debt,” he says. “Yes, that means it may take a little longer and cost a little more to pay your balances down to $0. However, once you do, the savings that you stashed away can protect you from going right back into debt. It means that the next surprise trip to the vet, blown tire or dentist copay won’t have to go on your credit card in full.”
Methodology
LendingTree analyzed about 240,000 anonymized credit reports from LendingTree users between Oct. 1 and Dec. 31, 2025.
For this study, a credit cardholder is defined as a consumer with at least one active credit card on their credit report at the time of analysis. The total credit card balance is the sum of all active credit card balances.
This data was used to calculate the percentage of cardholders in the 100 most populous metropolitan statistical areas (MSAs) who carried total credit card balances of at least $10,000 or $50,000.