Households With 2 Kids Need to Earn Average of $402,708 to Comfortably Afford Child Care


Child care has long been one of the most significant expenses for families — and LendingTree research shows just how out of reach it has become.
Under federal guidelines, child care is considered affordable when it accounts for no more than 7% of household income. With average annual costs for care of an infant and a 4-year-old reaching $28,190, a family would need to earn $402,708 a year to stay within that benchmark. However, typical two-child households earn just $145,656, falling far short of what affordability standards suggest.
- Families don’t make enough on average to afford child care for two children, according to government benchmarks. The average annual cost of child care for an infant and a 4-year-old across the U.S. is $28,190. For a household to spend only 7% of its income on child care (based on an affordability threshold set by the U.S. Department of Health and Human Services), it would need to earn an average of $402,708 a year. That’s 176.5% higher than the average income among households with two kids of $145,656.
- By race, American Indian and Black families are furthest from earning the incomes needed for affordable child care. American Indian households with two kids earn an average of $94,094, while Black families earn $98,019, meaning they’d need to earn at least 328.0% and 310.8% more, respectively, to meet the affordability benchmark.
- In 20 states, the incomes needed for affordable child care are at least triple the average income among households with two kids. In Hawaii, child care costs an average of $38,107 for an infant and a 4-year-old. Families would need to earn $544,386 to spend 7% of their income on child care — 269.7% more than the average income of $147,249 among households with two kids in that state. Nebraska (263.0%) and Montana (257.8%) follow close behind.
- South Dakota families come closest to comfortably affording child care, but the average income there is still well below recommendations. In South Dakota, average annual child care costs are $16,702. To meet government thresholds, families would need to earn $238,600— 95.4% more than the average income of $122,100. Mississippi and Alabama follow, both at 109.5%.
Households with 2 kids need to earn average of $402,708 to afford child care
Child care is a major financial pressure for today’s families — and for most households with young children, it’s nowhere near affordable by federal standards. Across the U.S., the average annual cost of care for an infant and a 4-year-old is $28,190, according to Child Care Aware of America.
The U.S. Department of Health and Human Services (HHS) considers child care affordable when it accounts for no more than 7% of a household’s income. But to keep costs at that level, a family with two kids would need to earn a staggering $402,708 a year.
That income target is far beyond the earnings of a typical household. Families with two children earn an average of $145,656, meaning they fall short of what’s needed to meet the affordability benchmark, which is 176.5% higher. Even many middle- and upper-middle-income households end up spending far more than the recommended share of their income on child care.
National average cost of child care for 2 children vs. average household income
| Average annual cost of child care for an infant and a 4-year-old | $28,190 |
| Average annual income needed to meet the 7% affordability threshold | $402,708 |
| Average income of households with two kids | $145,656 |
“Most parents could tell you that child care costs are astronomical these days and can cause a major financial burden, even for high-income families,” says Matt Schulz, LendingTree chief consumer finance analyst and author of “Ask Questions, Save Money, Make More: How to Take Control of Your Financial Life.”
Devoting such an outsized portion of household income means there’s less available for saving, paying off debt, investing and meeting other financial needs. “The unfortunate reality is that these costs are so high that they’re forcing families to make major sacrifices to handle them. That’s not how it should be,” Schulz says.
American Indian, Black families earn least for affordable child care
The financial strain of child care isn’t felt equally. By race, American Indian and Black households face the largest gaps between what they earn and what’s required to meet federal affordability guidelines.
American Indian households with two children earn an average of $94,094 per year, while Black families earn about $98,019. To comfortably afford care for an infant and a 4-year-old at the 7% threshold, these families would need to earn 328.0% and 310.8% more, respectively.
Biggest discrepancies between average incomes, amount needed to afford child care (by race)
| Race | Avg. income, households with 2 kids | % difference between avg. income and the $402,708 needed to afford child care |
|---|---|---|
| American Indian alone | $94,094 | 328.0% |
| Black or African American alone | $98,019 | 310.8% |
| Some other race alone | $98,891 | 307.2% |
| American Indian and Alaska Native tribes specified; or American Indian or Alaska Native, not specified and no other races | $105,704 | 281.0% |
| Alaska Native alone | $106,442 | 278.3% |
| Native Hawaiian and other Pacific Islander alone | $106,797 | 277.1% |
| 2 or more races | $135,515 | 197.2% |
| White alone | $162,885 | 147.2% |
| Asian alone | $206,883 | 94.7% |
“The fact that no group is even remotely near meeting these affordability thresholds tells you an awful lot about the cost of child care — and a lot about these government benchmarks, which clearly need to adjust to the realities of today’s child care costs,” Schulz says.
The fact that no group is even remotely near meeting these affordability thresholds tells you an awful lot about the cost of child care — and a lot about these government benchmarks, which clearly need to adjust to the realities of today’s child care costs.

The data also underscores the monumental financial burden faced by lower-income households and families of color, Schulz adds. Historical and systemic factors have kept average earnings lower for some racial groups, forcing many parents to devote a far larger share of their income to child care.
Even as overall wealth has increased across all racial groups in recent years, income and wealth gaps remain significant — and in some cases have grown. For example, between 2019 and 2022, Black wealth increased by 60%, yet the wealth gap between median white and median Black households widened by $49,950 — for a total difference of $240,120, according to the Federal Reserve’s most recent Survey of Consumer Finances. Much of the wealth growth among white households was driven by salary and investment gains, while Black households experienced growth in home and business equity rather than in liquid assets.
While all racial groups fall short of the income needed to meet the 7% affordability threshold, Asian households come the closest to meeting it. With an average income of $206,883 for families with two children, they would need to earn 94.7% more to reach the $402,708 benchmark. White families follow, with an average two-child household income of $162,885; they need 147.2% more income to comfortably afford care.
Incomes needed are at least triple average incomes in 20 states
The income gap widens even further at the state level. In 20 states, the income required to meet the federal 7% threshold is at least three times the national average for households with two children.
Hawaii has the widest gap: Families pay an average of $38,107 annually for an infant and a 4-year-old, so to keep child care expenses within 7% of income, a household would need to earn $544,386. That’s 269.7% more than Hawaii’s average two-child household income of $147,249. Nebraska (263.0%) and Montana (257.8%) have similar gaps, illustrating how families across many regions face financial pressure to cover child care costs.
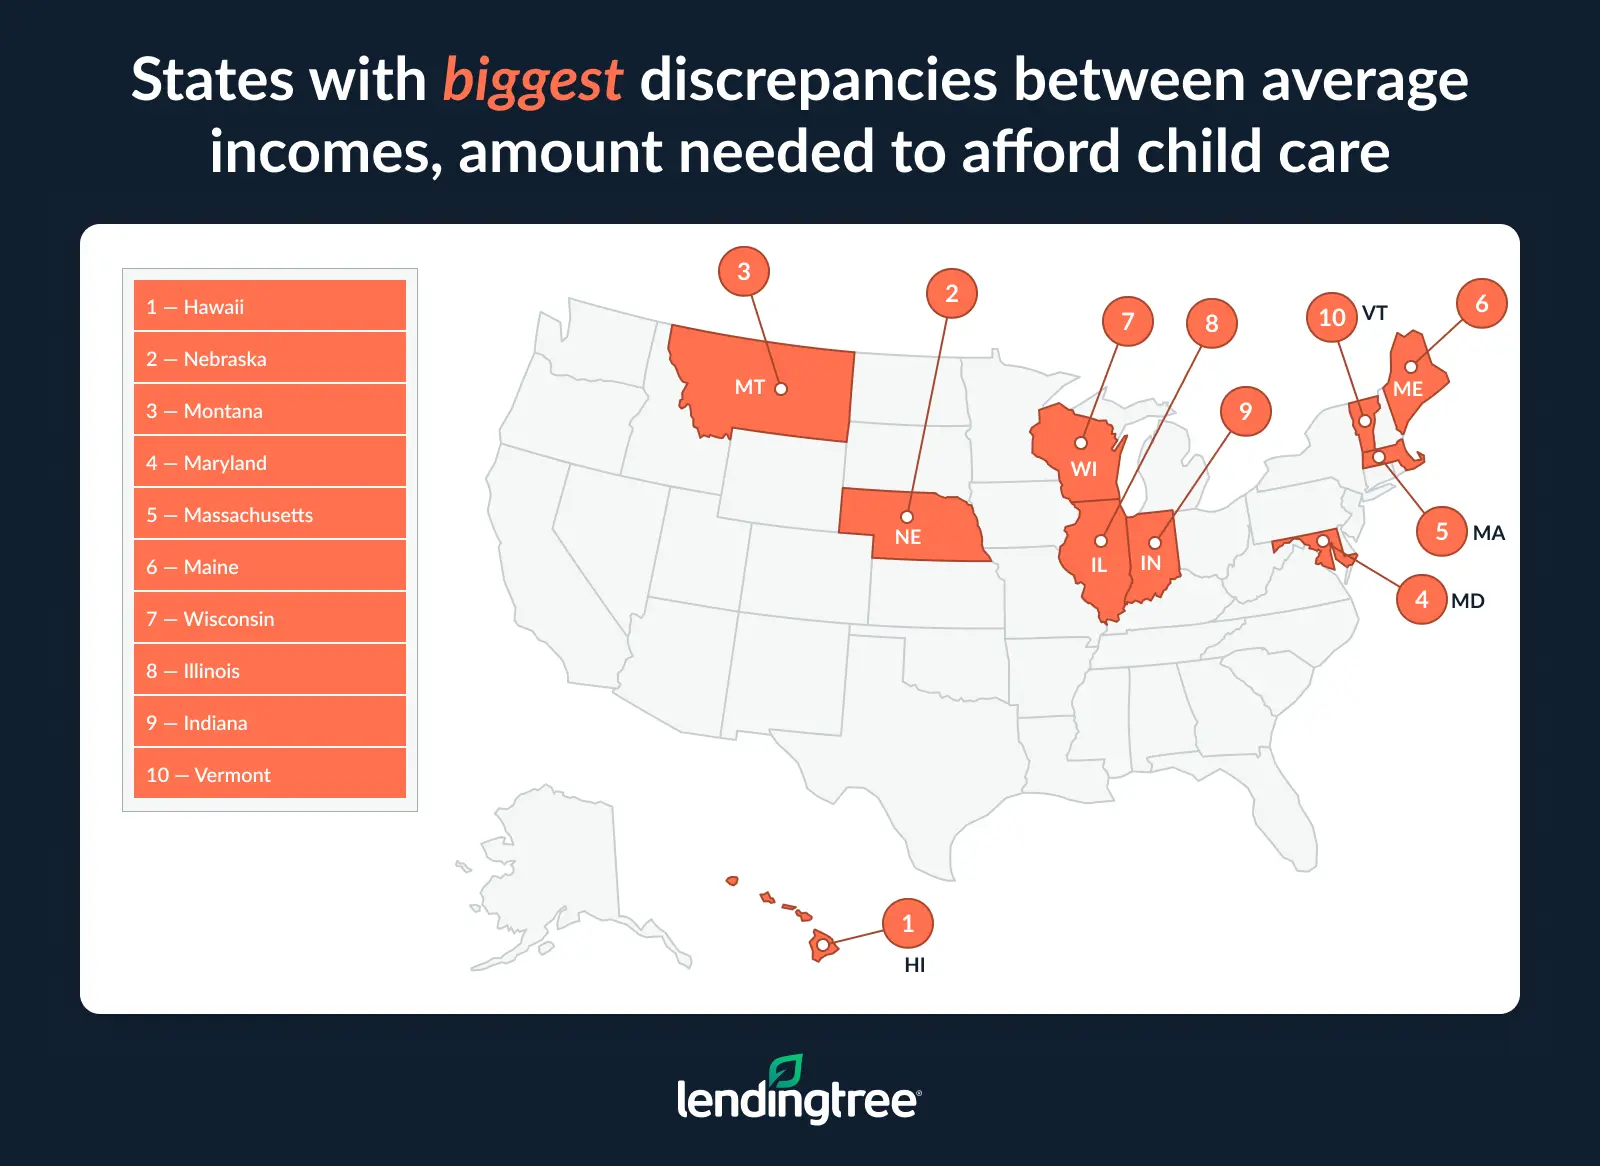
In Hawaii, high child care costs — and the wide gap in what families can afford — reflect the state’s notoriously high cost of living. The state’s cost-of-living index is 179.7 (with 100 indicating average affordability), according to the most recent data from the Missouri Economic Research and Information Center. Montana isn’t as extreme, but its cost of living is still above average — 109.8.
Nebraska is more of an outlier. Despite having the 13th-lowest cost-of-living index (91.6), infant child care costs exceed the average rent there, and only 14% of families meet HHS affordability guidelines, according to the Economic Policy Institute.
“With numbers like these, it’s easy to see why birth rates are falling. Many Americans are saying that having kids doesn’t make financial sense,” Schulz says. “It’s going to require concerted effort on the part of our political and business leaders to change the state of child care costs here in our country, but that change isn’t coming anytime soon.”
South Dakota families come closest to affording child care
While most families struggle to afford child care, households in some states are closer to meeting federal affordability guidelines. South Dakota leads the way, with average annual child care costs of $16,702 for an infant and a 4-year-old. To keep spending within 7% of income, families would need to earn $238,600, which is 95.4% more than the state’s average two-child household income of $122,100.
Other states with comparatively smaller gaps include Mississippi and Alabama, where families would need to earn 109.5% more than the average income to meet the 7% benchmark.
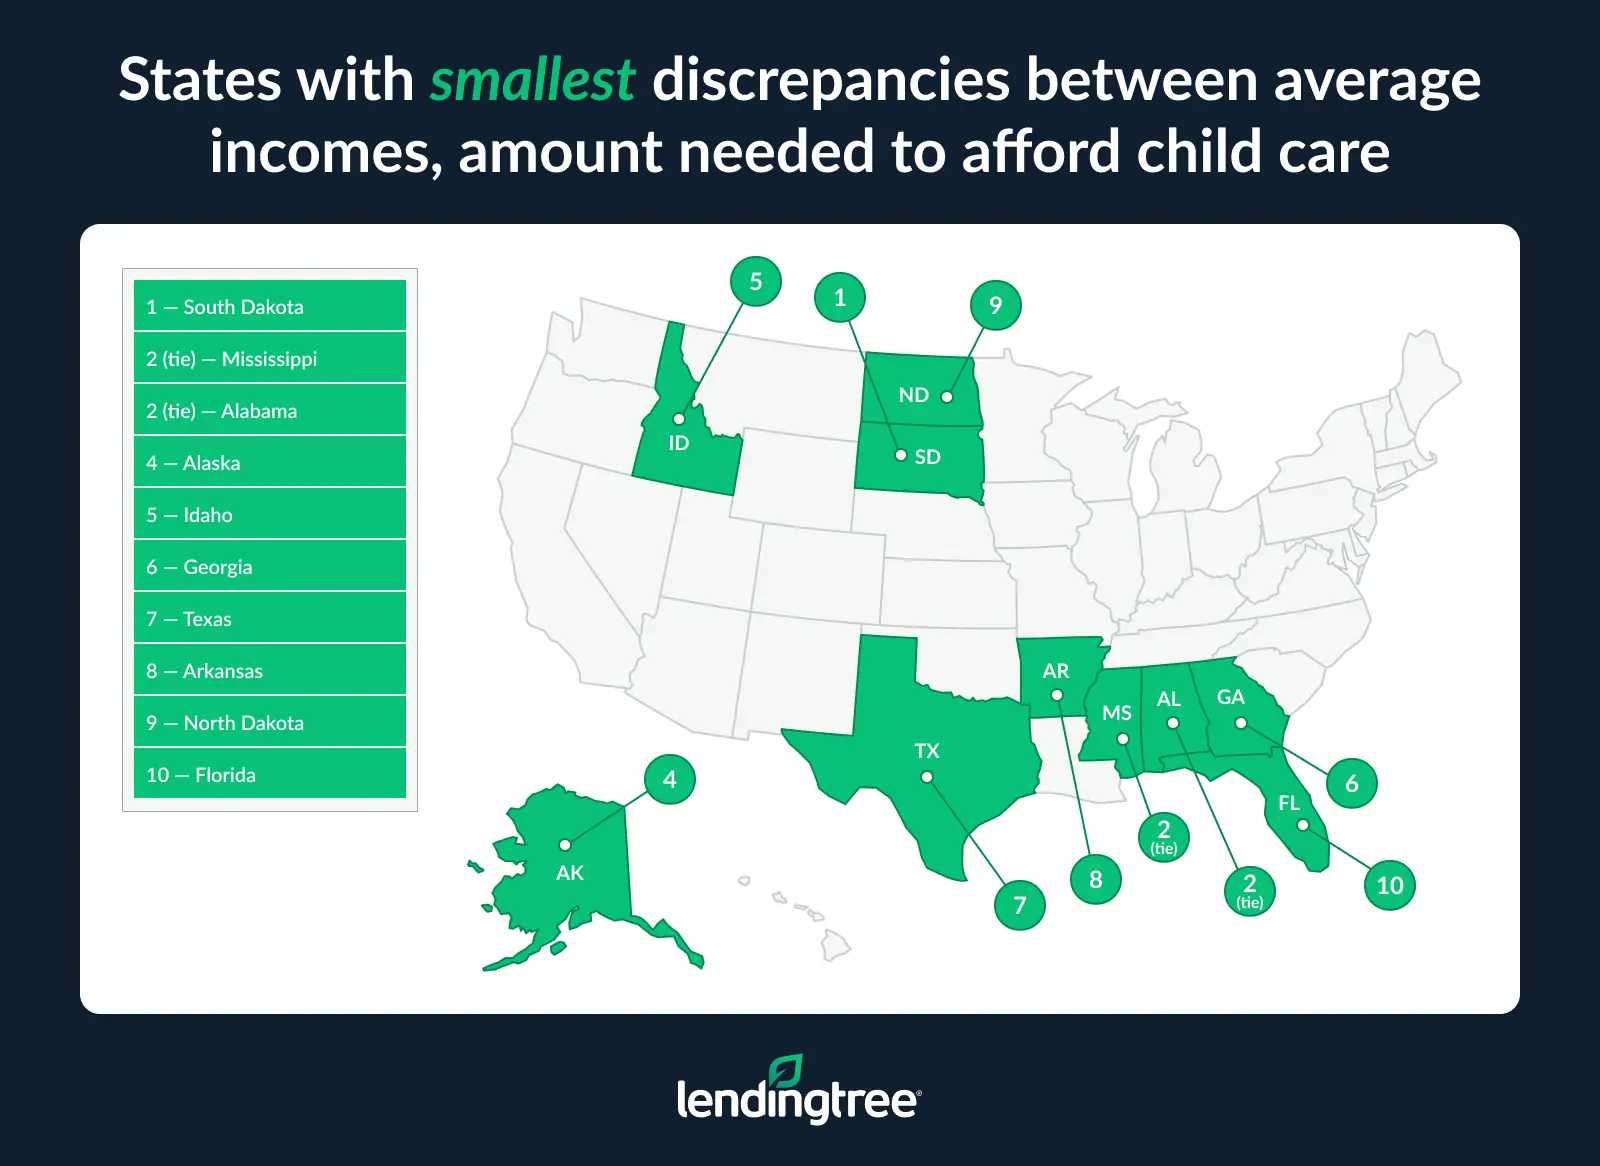
South Dakota’s smaller gap can be attributed to its overall affordability, with a recent cost-of-living index of 91.8, the 14th-lowest nationally. Similarly, Mississippi and Alabama also rank among the most affordable states. Mississippi has the second-lowest cost of living (85.5), and Alabama follows with the third-lowest (87.9). Even in these lower-cost states, child care remains a major financial commitment, highlighting that affordability is a nationwide challenge.
“There are places where the gap doesn’t look quite as impossible to overcome as it does in other states, but the numbers are daunting everywhere,” Schulz says.
Full rankings: States with biggest/smallest discrepancies between average incomes, amount needed to afford child care
| Rank | State | Avg. child care costs, infant, 4-year-old | Income needed to comfortably afford child care | Avg. income, households with 2 kids | % difference |
|---|---|---|---|---|---|
| 1 | Hawaii | $38,107 | $544,386 | $147,249 | 269.7% |
| 2 | Nebraska | $33,885 | $484,071 | $133,357 | 263.0% |
| 3 | Montana | $29,380 | $419,714 | $117,314 | 257.8% |
| 4 | Maryland | $40,922 | $584,600 | $168,047 | 247.9% |
| 5 | Massachusetts | $47,012 | $671,600 | $193,671 | 246.8% |
| 6 | Maine | $29,874 | $426,771 | $124,131 | 243.8% |
| 7 | Wisconsin | $33,002 | $471,457 | $138,512 | 240.4% |
| 8 | Illinois | $37,045 | $529,214 | $155,500 | 240.3% |
| 9 | Indiana | $29,009 | $414,414 | $122,372 | 238.7% |
| 10 | Vermont | $34,587 | $494,100 | $145,914 | 238.6% |
| 11 | Rhode Island | $34,698 | $495,686 | $147,064 | 237.1% |
| 12 | Oregon | $32,760 | $468,000 | $140,124 | 234.0% |
| 13 | California | $39,293 | $561,329 | $171,424 | 227.5% |
| 14 | Minnesota | $36,154 | $516,486 | $158,240 | 226.4% |
| 15 | New York | $37,782 | $539,743 | $169,968 | 217.6% |
| 16 | Delaware | $29,835 | $426,214 | $135,610 | 214.3% |
| 17 | Colorado | $35,778 | $511,114 | $166,470 | 207.0% |
| 18 | Wyoming | $24,013 | $343,043 | $112,156 | 205.9% |
| 19 | Washington | $38,256 | $546,514 | $179,628 | 204.2% |
| 20 | Kentucky | $23,452 | $335,029 | $111,675 | 200.0% |
| 21 | Tennessee | $23,966 | $342,371 | $115,346 | 196.8% |
| 22 | Arizona | $27,644 | $394,914 | $133,086 | 196.7% |
| 23 | Michigan | $25,700 | $367,143 | $129,702 | 183.1% |
| 24 | New Jersey | $37,716 | $538,800 | $192,156 | 180.4% |
| 25 | West Virginia | $19,807 | $282,957 | $101,028 | 180.1% |
| 26 | Ohio | $25,532 | $364,743 | $130,844 | 178.8% |
| 27 | Louisiana | $20,225 | $288,929 | $104,223 | 177.2% |
| 28 | Pennsylvania | $27,363 | $390,900 | $141,060 | 177.1% |
| 29 | Missouri | $23,348 | $333,543 | $120,985 | 175.7% |
| 29 | Nevada | $23,264 | $332,343 | $123,115 | 169.9% |
| 31 | Kansas | $24,373 | $348,186 | $130,459 | 166.9% |
| 32 | Connecticut | $33,789 | $482,700 | $183,287 | 163.4% |
| 33 | Iowa | $22,794 | $325,629 | $124,582 | 161.4% |
| 34 | Virginia | $30,680 | $438,286 | $168,227 | 160.5% |
| 35 | Oklahoma | $20,224 | $288,914 | $112,334 | 157.2% |
| 36 | Utah | $24,036 | $343,371 | $135,810 | 152.8% |
| 37 | North Carolina | $22,751 | $325,014 | $131,515 | 147.1% |
| 38 | South Carolina | $20,165 | $288,071 | $117,307 | 145.6% |
| 39 | New Hampshire | $29,082 | $415,457 | $170,840 | 143.2% |
| 40 | District of Columbia | $47,174 | $673,914 | $278,745 | 141.8% |
| 41 | Florida | $22,420 | $320,286 | $132,519 | 141.7% |
| 42 | North Dakota | $23,168 | $330,971 | $141,395 | 134.1% |
| 43 | Arkansas | $17,498 | $249,971 | $108,006 | 131.4% |
| 44 | Texas | $21,574 | $308,200 | $136,264 | 126.2% |
| 45 | Georgia | $20,639 | $294,843 | $132,877 | 121.9% |
| 46 | Idaho | $19,809 | $282,986 | $128,539 | 120.2% |
| 47 | Alaska | $21,990 | $314,143 | $142,804 | 120.0% |
| 48 | Alabama | $16,640 | $237,714 | $113,480 | 109.5% |
| 48 | Mississippi | $14,560 | $208,000 | $99,305 | 109.5% |
| 50 | South Dakota | $16,702 | $238,600 | $122,100 | 95.4% |
Affording child care: Top expert tips
Child care costs can feel overwhelming, but families may have more tools and strategies available to them to ease that burden than they might realize. While no single solution eliminates the expense entirely, combining multiple approaches can help reduce the financial toll significantly.
- Leverage employer benefits you may be overlooking. “Ask your employer about child-care-related benefits they might offer,” Schulz advises. “For example, a dependent care flexible spending account can help by allowing you to set aside pretax dollars to pay for eligible child care services.”
- Explore federal, state and local assistance programs. You may be eligible for initiatives such as free universal pre-K or subsidized child care programs, as well as the Child and Dependent Care Tax Credit. Additionally, many states offer sliding-scale subsidies, hardship grants or early-education vouchers. Because eligibility rules vary by location and income, it’s worth checking at all three levels — federal, state and local.
- Compare alternative care arrangements. Nanny shares, co-ops, part-time preschool slots or mixing informal care (like trusted relatives) with licensed child care can significantly lower out-of-pocket costs. While these options require more coordination, they can offer similar stability and educational benefits as traditional centers. “If you’re fortunate enough to have trusted family and friends who can help, let them,” Schulz says. “If not, consider leaning on organizations in your area that provide services to help struggling parents. Googling ‘child care assistance in my area’ can be a great place to start.”
- Adjust schedules to reduce total hours in care. When possible, parents or caregivers with flexible or remote work options can stagger work hours, compress schedules or swap coverage to cut the number of paid care hours needed each week. Even reducing care by a day or two each week can save thousands per year.
- Ask about payment flexibility, sibling discounts or sliding-scale fees. Some providers are open to negotiating payment terms or offering discounts if you have more than one child. Others may use income-based “sliding-scale” fees, financial aid, scholarships or flexible payment schedules to ease cash flow.
Schulz also suggests shopping around for child care options. “In most areas, there can be significant differences in cost from one child care provider to another,” he says.
Methodology
To identify the states where families would need the greatest increase in earnings to comfortably afford child care, LendingTree researchers compared the average cost of child care in each state with the average income of households with two children. Our analysis estimates the income required to afford full-time, center-based care for an infant and a 4-year-old, based on the 7% affordability threshold from the U.S. Department of Health and Human Services (HHS).
Family income data comes from the U.S. Census Bureau 2023 American Community Survey microdata with one-year estimates. The 2024 child care cost data comes from Child Care Aware of America.
New Mexico was excluded due to a lack of available child care cost data.
Get debt consolidation loan offers from up to 5 lenders in minutes
Recommended Articles