Places Where Working Adults Still Live With Their Parents


Living with your parents while working can offer a great financial advantage, allowing you to save up for a major purchase like a house.
Across the 50 largest metros, an average of 11.8% of working adults live with their parents, according to a LendingTree study.
Here’s what else we found.
Key findings
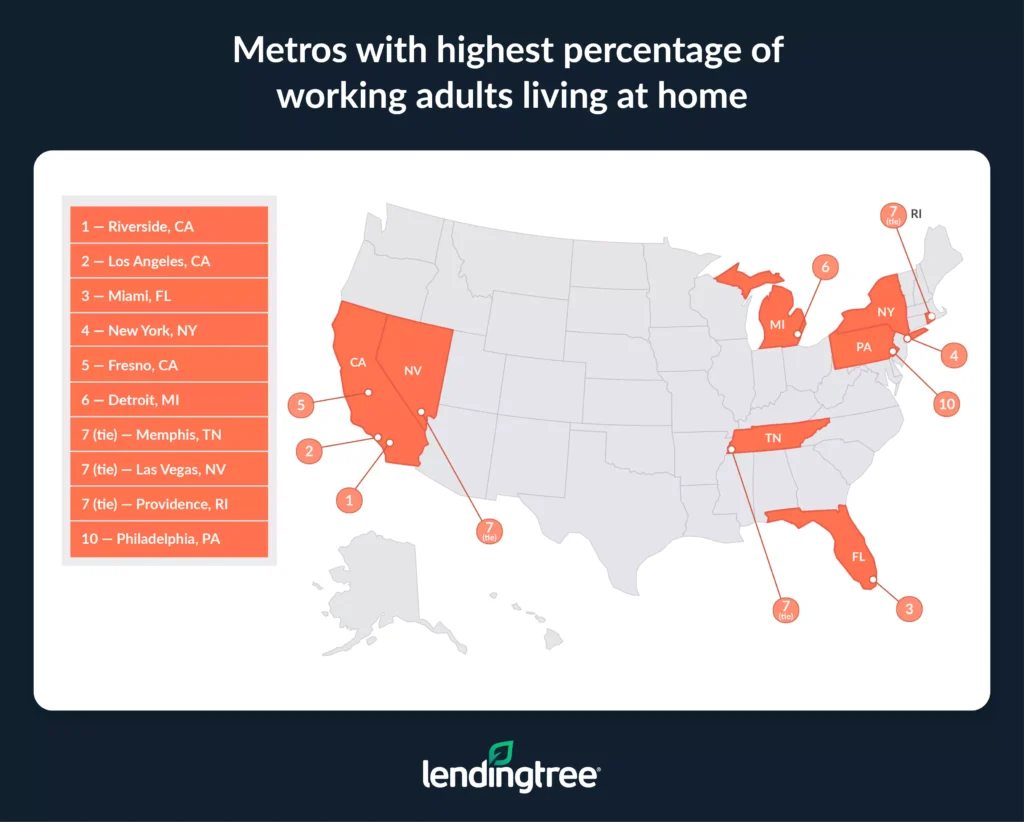
- An average of 11.8% of working adults across the 50 largest metros live with their parents. Riverside, Calif., leads, with over 1 in 5 (21.9%) working adults ages 25 to 40 living with their parents. Los Angeles (20.0%) and Miami (17.8%) follow. Meanwhile, Austin, Texas (5.8%), Raleigh, N.C. (6.7%), and Denver (7.0%) have the lowest rates.
- The number of working adults living with their parents fell 8.3% across the 50 metros from 2018 to 2023. Only 13 metros saw an increase, led by Las Vegas (22.1%), Cleveland (16.7%) and Sacramento, Calif. (8.1%). Conversely, Oklahoma City (36.7%), Nashville, Tenn. (33.2%), and Minneapolis (27.0%) saw the biggest decreases.
- Those living at home make 43.5% less on average than their independent peers. Working adults who live with their parents make an average of $39,622 annually across the 50 metros, while those who don’t make an average of $70,137. By metro, Raleigh has the highest disparity (56.0%) and Buffalo, N.Y., has the lowest (28.5%).
- Working adults living at home would need to allocate 40.2% of their monthly income to rent a one-bedroom apartment. Across the 50 metros, that’s highest in Tampa, Fla., at 54.3%. Dependent adults in just seven metros would be able to adhere to the 30% rule, allocating less than 30% of their income toward rent.
- Among working adults living at home, nearly 1 in 3 (32.6%) have a bachelor’s degree or higher. In two of the 50 metros, more than half of working adults living at home have a bachelor’s degree or higher: San Jose, Calif. (53.2%), and San Francisco (51.9%). New York (49.0%) follows close behind.
On average, 11.8% of working adults live with parents
On average, 11.8% of working adults live with their parents, according to our analysis of the 50 largest U.S. metros.
That’s led by Riverside, Calif., where a significant 21.9% of working adults ages 25 to 40 live with their parents. Los Angeles (20.0%) and Miami (17.8%) rank next. According to a Tax Foundation analysis of Bureau of Economic Analysis (BEA) data, these metros have lower purchasing power than the U.S. average, making it understandable that more working adults live with their parents.
The high cost of living is certainly a significant factor, but Matt Schulz — LendingTree chief consumer finance analyst and author of “Ask Questions, Save Money, Make More: How to Take Control of Your Financial Life” — says it isn’t the only one.
“Some of it may simply be that there’s much less stigma about being older and living with your parents today,” he says. “People are more practical. Rather than seeing moving in with their parents as a sign of defeat, people see it as an opportunity to stabilize their financial situation. If they’re living with Mom or Dad, they’re able to pay less for rent, groceries and other basic bills, allowing them to stash money away in an emergency fund, save for a car or mortgage down payment, or even get a head start on retirement savings. It may not be the sexiest, but it can make an awful lot of sense.”
Conversely, Austin, Texas, has the lowest rate, with just 5.8% of working adults living at home. Raleigh, N.C., (6.7%), and Denver (7.0%) follow. Unlike the top-ranking metros, Austin and Raleigh have higher purchasing power than the U.S. average.
Full rankings: Metros with highest/lowest % of working adults living at home
| Rank | Metro | % |
|---|---|---|
| 1 | Riverside, CA | 21.9% |
| 2 | Los Angeles, CA | 20.0% |
| 3 | Miami, FL | 17.8% |
| 4 | New York, NY | 16.5% |
| 5 | Fresno, CA | 15.8% |
| 6 | Detroit, MI | 15.6% |
| 7 | Memphis, TN | 15.3% |
| 7 | Las Vegas, NV | 15.3% |
| 7 | Providence, RI | 15.3% |
| 10 | Philadelphia, PA | 15.0% |
| 11 | Chicago, IL | 14.4% |
| 12 | San Antonio, TX | 13.9% |
| 13 | Atlanta, GA | 13.7% |
| 14 | Tampa, FL | 13.5% |
| 15 | Boston, MA | 13.3% |
| 16 | Baltimore, MD | 13.1% |
| 16 | Cleveland, OH | 13.1% |
| 18 | Sacramento, CA | 13.0% |
| 19 | San Diego, CA | 12.7% |
| 20 | Birmingham, AL | 12.5% |
| 21 | Washington, DC | 12.4% |
| 22 | Phoenix, AZ | 12.3% |
| 23 | Dallas, TX | 12.1% |
| 24 | Houston, TX | 12.0% |
| 25 | San Francisco, CA | 11.9% |
| 25 | Richmond, VA | 11.9% |
| 25 | Orlando, FL | 11.9% |
| 28 | Jacksonville, FL | 11.8% |
| 29 | San Jose, CA | 11.7% |
| 30 | Virginia Beach, VA | 10.9% |
| 31 | Buffalo, NY | 10.7% |
| 32 | Charlotte, NC | 10.4% |
| 33 | St. Louis, MO | 10.3% |
| 33 | Pittsburgh, PA | 10.3% |
| 35 | Milwaukee, WI | 10.1% |
| 36 | Salt Lake City, UT | 10.0% |
| 37 | Columbus, OH | 8.9% |
| 37 | Cincinnati, OH | 8.9% |
| 39 | Kansas City, MO | 8.4% |
| 40 | Louisville, KY | 8.2% |
| 41 | Grand Rapids, MI | 8.1% |
| 42 | Seattle, WA | 8.0% |
| 43 | Indianapolis, IN | 7.9% |
| 44 | Oklahoma City, OK | 7.5% |
| 45 | Nashville, TN | 7.3% |
| 46 | Minneapolis, MN | 7.2% |
| 46 | Portland, OR | 7.2% |
| 48 | Denver, CO | 7.0% |
| 49 | Raleigh, NC | 6.7% |
| 50 | Austin, TX | 5.8% |
Number of working adults living with parents falls 8.3%
Over five years, the number of working adults living with their parents fell. Across the 50 largest metros, this number fell 8.3% from 2018 (4,579,691) to 2023 (4,197,794).
Schulz believes a possible factor could be the rise in remote work. “In many jobs, someone can work from anywhere, meaning that people are free to find lower-priced places to move to,” he says. “I have no doubt that that has freed up people to be able to afford to live on their own rather than moving back into their parents’ house.”
Still, 13 metros saw an increase. Las Vegas saw the biggest jump, growing by 22.1%. Cleveland (16.7%) and Sacramento, Calif. (8.1%), followed.
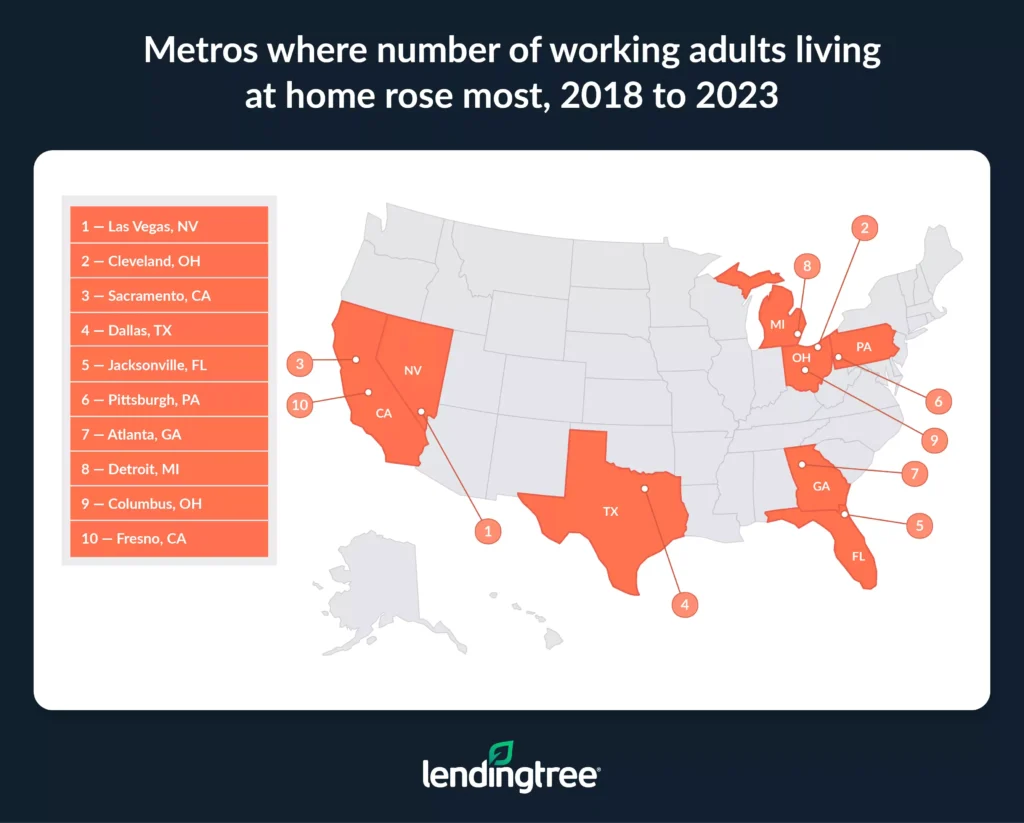
Conversely, Oklahoma City saw the biggest decrease, falling 36.7% in this time frame. Nashville, Tenn. (33.2%), and Minneapolis (27.0%) ranked next.
Full rankings: Metros with highest/lowest % change in working adults living at home, 2018-23
| Rank | Metro | # living at home, 2018 | # living at home, 2023 | % change, 2018-23 |
|---|---|---|---|---|
| 1 | Las Vegas, NV | 49,405 | 60,303 | 22.1% |
| 2 | Cleveland, OH | 35,091 | 40,954 | 16.7% |
| 3 | Sacramento, CA | 46,702 | 50,497 | 8.1% |
| 4 | Dallas, TX | 168,408 | 177,757 | 5.6% |
| 5 | Jacksonville, FL | 32,384 | 33,869 | 4.6% |
| 6 | Pittsburgh, PA | 37,914 | 39,582 | 4.4% |
| 7 | Atlanta, GA | 141,221 | 147,230 | 4.3% |
| 8 | Detroit, MI | 103,358 | 107,567 | 4.1% |
| 9 | Columbus, OH | 34,461 | 35,471 | 2.9% |
| 10 | Fresno, CA | 24,116 | 24,624 | 2.1% |
| 11 | Seattle, WA | 67,163 | 68,237 | 1.6% |
| 12 | Riverside, CA | 160,114 | 162,361 | 1.4% |
| 13 | Boston, MA | 118,999 | 119,861 | 0.7% |
| 14 | Charlotte, NC | 51,663 | 51,439 | -0.4% |
| 15 | Milwaukee, WI | 28,420 | 28,188 | -0.8% |
| 16 | Tampa, FL | 73,483 | 72,535 | -1.3% |
| 17 | Phoenix, AZ | 106,323 | 104,735 | -1.5% |
| 18 | Virginia Beach, VA | 33,926 | 32,832 | -3.2% |
| 19 | Indianapolis, IN | 31,833 | 30,661 | -3.7% |
| 20 | Kansas City, MO | 35,092 | 33,534 | -4.4% |
| 21 | Buffalo, NY | 20,872 | 19,895 | -4.7% |
| 22 | Providence, RI | 44,073 | 41,713 | -5.4% |
| 23 | Richmond, VA | 29,107 | 27,481 | -5.6% |
| 24 | St. Louis, MO | 54,008 | 50,335 | -6.8% |
| 25 | Los Angeles, CA | 478,586 | 445,436 | -6.9% |
| 26 | Washington, DC | 156,479 | 144,985 | -7.3% |
| 27 | Chicago, IL | 249,921 | 230,915 | -7.6% |
| 28 | Philadelphia, PA | 170,131 | 156,715 | -7.9% |
| 29 | New York, NY | 626,122 | 567,275 | -9.4% |
| 30 | Baltimore, MD | 67,500 | 61,088 | -9.5% |
| 31 | Cincinnati, OH | 36,086 | 32,591 | -9.7% |
| 32 | Memphis, TN | 33,328 | 29,461 | -11.6% |
| 33 | Birmingham, AL | 27,228 | 23,434 | -13.9% |
| 34 | Houston, TX | 177,285 | 149,814 | -15.5% |
| 35 | Salt Lake City, UT | 30,859 | 25,739 | -16.6% |
| 36 | Portland, OR | 41,345 | 33,629 | -18.7% |
| 37 | Orlando, FL | 72,551 | 58,944 | -18.8% |
| 38 | Austin, TX | 39,430 | 31,574 | -19.9% |
| 39 | San Jose, CA | 53,744 | 42,875 | -20.2% |
| 40 | San Francisco, CA | 129,986 | 102,142 | -21.4% |
| 41 | Denver, CO | 58,772 | 46,080 | -21.6% |
| 42 | San Diego, CA | 100,592 | 78,069 | -22.4% |
| 43 | Miami, FL | 216,643 | 167,815 | -22.5% |
| 44 | San Antonio, TX | 79,557 | 61,368 | -22.9% |
| 45 | Louisville, KY | 22,763 | 17,460 | -23.3% |
| 46 | Raleigh, NC | 24,405 | 18,376 | -24.7% |
| 47 | Grand Rapids, MI | 18,873 | 14,068 | -25.5% |
| 48 | Minneapolis, MN | 67,230 | 49,085 | -27.0% |
| 49 | Nashville, TN | 44,638 | 29,800 | -33.2% |
| 50 | Oklahoma City, OK | 27,501 | 17,395 | -36.7% |
Adults living at home make 43.5% less than independent peers
One reason adults may choose to live at home is that they may not be able to afford to live independently. In fact, adults working at home make 43.5% less on average than their independent peers, with those living with their parents making an average of $39,622 and those living independently making $70,137.
By metro, Raleigh has the highest disparity (56.0%), at $33,253 versus $75,615. Despite having a low percentage of adults living at home, Austin has the second biggest income disparity, at 55.6%. San Jose, Calif. (54.7%), rounds out the top three.
Metros with biggest % difference in income among working adults living at home and those living independently
| Rank | Metro | Avg. annual income, those living at home | Avg. annual income, those living independently | % difference |
|---|---|---|---|---|
| 1 | Raleigh, NC | $33,253 | $75,615 | 56.0% |
| 2 | Austin, TX | $35,546 | $79,998 | 55.6% |
| 3 | San Jose, CA | $62,522 | $138,139 | 54.7% |
On the other end, Buffalo, N.Y., has the lowest pay gap, with adults living at home making an average of $42,156 and adults living independently making an average of $58,922 — a 28.5% difference. Two California metros follow: Fresno (30.1%) and Riverside (32.2%).
Full rankings: Metros with biggest/smallest % difference in income among working adults living at home and those living independently
| Rank | Metro | Avg. annual income, those living at home | Avg. annual income, those living independently | % difference |
|---|---|---|---|---|
| 1 | Raleigh, NC | $33,253 | $75,615 | 56.0% |
| 2 | Austin, TX | $35,546 | $79,998 | 55.6% |
| 3 | San Jose, CA | $62,522 | $138,139 | 54.7% |
| 4 | San Francisco, CA | $55,576 | $119,976 | 53.7% |
| 5 | Seattle, WA | $45,144 | $96,573 | 53.3% |
| 6 | Richmond, VA | $36,091 | $69,518 | 48.1% |
| 7 | Washington, DC | $47,243 | $89,258 | 47.1% |
| 8 | Jacksonville, FL | $33,920 | $63,270 | 46.4% |
| 9 | Charlotte, NC | $37,244 | $68,541 | 45.7% |
| 10 | Salt Lake City, UT | $37,018 | $68,015 | 45.6% |
| 11 | Minneapolis, MN | $39,332 | $72,057 | 45.4% |
| 12 | Milwaukee, WI | $36,616 | $66,935 | 45.3% |
| 13 | Chicago, IL | $41,775 | $76,198 | 45.2% |
| 14 | Cincinnati, OH | $36,968 | $67,382 | 45.1% |
| 14 | Tampa, FL | $34,081 | $62,118 | 45.1% |
| 14 | Columbus, OH | $36,421 | $66,307 | 45.1% |
| 17 | Birmingham, AL | $33,487 | $60,689 | 44.8% |
| 17 | Atlanta, GA | $37,647 | $68,170 | 44.8% |
| 19 | Portland, OR | $38,681 | $69,942 | 44.7% |
| 20 | New York, NY | $49,547 | $89,326 | 44.5% |
| 21 | San Antonio, TX | $30,840 | $55,485 | 44.4% |
| 22 | Philadelphia, PA | $40,954 | $73,454 | 44.2% |
| 23 | Kansas City, MO | $35,316 | $62,744 | 43.7% |
| 23 | Boston, MA | $51,512 | $91,462 | 43.7% |
| 23 | Dallas, TX | $38,032 | $67,513 | 43.7% |
| 26 | Indianapolis, IN | $35,547 | $63,013 | 43.6% |
| 27 | Cleveland, OH | $34,206 | $60,351 | 43.3% |
| 28 | Detroit, MI | $35,847 | $63,155 | 43.2% |
| 29 | Denver, CO | $45,992 | $80,185 | 42.6% |
| 30 | Houston, TX | $37,937 | $65,368 | 42.0% |
| 31 | Los Angeles, CA | $42,717 | $73,443 | 41.8% |
| 32 | Nashville, TN | $38,858 | $66,135 | 41.2% |
| 33 | San Diego, CA | $46,324 | $78,361 | 40.9% |
| 34 | Pittsburgh, PA | $39,247 | $66,265 | 40.8% |
| 35 | Memphis, TN | $34,155 | $56,906 | 40.0% |
| 36 | Baltimore, MD | $44,119 | $73,055 | 39.6% |
| 37 | Phoenix, AZ | $39,075 | $64,398 | 39.3% |
| 38 | Virginia Beach, VA | $36,358 | $59,682 | 39.1% |
| 39 | Sacramento, CA | $43,315 | $70,483 | 38.5% |
| 40 | Orlando, FL | $35,677 | $57,625 | 38.1% |
| 41 | St. Louis, MO | $39,218 | $62,958 | 37.7% |
| 42 | Miami, FL | $39,742 | $63,621 | 37.5% |
| 43 | Oklahoma City, OK | $35,543 | $56,279 | 36.8% |
| 44 | Louisville, KY | $36,712 | $57,822 | 36.5% |
| 45 | Grand Rapids, MI | $38,652 | $60,654 | 36.3% |
| 46 | Providence, RI | $41,933 | $63,992 | 34.5% |
| 47 | Las Vegas, NV | $37,477 | $55,722 | 32.7% |
| 48 | Riverside, CA | $38,577 | $56,892 | 32.2% |
| 49 | Fresno, CA | $36,952 | $52,877 | 30.1% |
| 50 | Buffalo, NY | $42,156 | $58,922 | 28.5% |
Rent would cost 40.2% of monthly income
Exacerbating affordability issues, working adults living at home would need to allocate 40.2% of their monthly income to rent a one-bedroom apartment.
That figure’s highest in Tampa, Fla., at 54.3%. Orlando (52.7%) and Austin (51.9%) follow.

“When more than half of your money goes to paying rent, it severely limits your ability to work toward other financial goals,” Schulz says. “There’s less money to pay down student loans or credit cards, build up your emergency fund, go back to school or start a small business. And in cities like Tampa, Orlando and Austin, you generally need a car to get around as well, making things even harder.”
Dependent adults in just seven metros would be able to adhere to the 30% rule, which means allocating less than 30% of their income toward rent. Those in Buffalo (24.8%), Pittsburgh (26.4%) and Providence, R.I. (27.2%), would need to allocate the least of their monthly income toward rent.
Full rankings: Metros where working adults living at home would need to spend highest/lowest % of monthly income on rent
| Rank | Metro | % of income to rent 1-bedroom apartment |
|---|---|---|
| 1 | Tampa, FL | 54.3% |
| 2 | Orlando, FL | 52.7% |
| 3 | Austin, TX | 51.9% |
| 4 | Raleigh, NC | 51.8% |
| 5 | Miami, FL | 50.5% |
| 6 | San Diego, CA | 49.8% |
| 7 | Atlanta, GA | 49.2% |
| 8 | Los Angeles, CA | 48.9% |
| 9 | Jacksonville, FL | 46.5% |
| 10 | San Jose, CA | 46.2% |
| 11 | Seattle, WA | 46.1% |
| 12 | San Francisco, CA | 46.0% |
| 13 | Phoenix, AZ | 45.7% |
| 14 | Washington, DC | 45.6% |
| 14 | Charlotte, NC | 45.6% |
| 16 | Portland, OR | 45.2% |
| 17 | San Antonio, TX | 44.9% |
| 17 | Riverside, CA | 44.9% |
| 19 | Dallas, TX | 44.8% |
| 20 | Salt Lake City, UT | 44.0% |
| 21 | Richmond, VA | 43.8% |
| 21 | Nashville, TN | 43.8% |
| 23 | Las Vegas, NV | 43.5% |
| 24 | Denver, CO | 43.4% |
| 25 | Virginia Beach, VA | 40.5% |
| 26 | Sacramento, CA | 40.4% |
| 27 | Boston, MA | 39.7% |
| 28 | Birmingham, AL | 39.2% |
| 29 | New York, NY | 39.1% |
| 30 | Houston, TX | 38.7% |
| 31 | Minneapolis, MN | 37.9% |
| 32 | Philadelphia, PA | 37.3% |
| 33 | Fresno, CA | 36.5% |
| 34 | Kansas City, MO | 36.2% |
| 35 | Indianapolis, IN | 35.4% |
| 36 | Memphis, TN | 35.2% |
| 37 | Columbus, OH | 34.8% |
| 38 | Chicago, IL | 34.6% |
| 39 | Detroit, MI | 32.6% |
| 40 | Baltimore, MD | 32.5% |
| 41 | Grand Rapids, MI | 31.1% |
| 41 | Oklahoma City, OK | 31.1% |
| 43 | Milwaukee, WI | 30.4% |
| 44 | Cincinnati, OH | 29.7% |
| 45 | Cleveland, OH | 29.6% |
| 46 | Louisville, KY | 29.5% |
| 47 | St. Louis, MO | 28.6% |
| 48 | Providence, RI | 27.2% |
| 49 | Pittsburgh, PA | 26.4% |
| 50 | Buffalo, NY | 24.8% |
32.6% have bachelor’s degree or higher
Nearly 1 in 3 (32.6%) working adults living at home have a bachelor’s degree or higher.
That rises to more than half in two California metros: San Jose (53.2%) and San Francisco (51.9%). Closely behind, 49.0% in New York have a bachelor’s degree or higher.
Metros with highest % of working adults living at home with bachelor’s degree or higher
| Rank | Metro | % |
|---|---|---|
| 1 | San Jose, CA | 53.2% |
| 2 | San Francisco, CA | 51.9% |
| 3 | New York, NY | 49.0% |
This high concentration of college-educated individuals living at home highlights the challenging cost of living in the nation’s biggest metros.
Meanwhile, Indianapolis (20.3%), Fresno, Calif. (20.7%), and Phoenix (21.5%) rank lowest.
Full rankings: Metros with highest/lowest % of working adults living at home with bachelor’s degree or higher
| Rank | Metro | % |
|---|---|---|
| 1 | San Jose, CA | 53.2% |
| 2 | San Francisco, CA | 51.9% |
| 3 | New York, NY | 49.0% |
| 4 | Boston, MA | 48.5% |
| 5 | Washington, DC | 43.8% |
| 6 | Philadelphia, PA | 40.7% |
| 7 | Buffalo, NY | 39.1% |
| 8 | Raleigh, NC | 37.0% |
| 9 | Miami, FL | 36.0% |
| 10 | Richmond, VA | 35.7% |
| 11 | Los Angeles, CA | 35.6% |
| 11 | Chicago, IL | 35.6% |
| 13 | Seattle, WA | 35.5% |
| 14 | Grand Rapids, MI | 35.2% |
| 15 | Sacramento, CA | 35.1% |
| 16 | Baltimore, MD | 35.0% |
| 16 | Denver, CO | 35.0% |
| 18 | Minneapolis, MN | 34.9% |
| 19 | Atlanta, GA | 34.4% |
| 20 | Birmingham, AL | 34.3% |
| 21 | Austin, TX | 34.2% |
| 22 | Oklahoma City, OK | 33.8% |
| 23 | Pittsburgh, PA | 33.6% |
| 24 | Orlando, FL | 33.5% |
| 25 | Columbus, OH | 33.0% |
| 26 | Providence, RI | 32.6% |
| 27 | Portland, OR | 32.0% |
| 28 | San Diego, CA | 31.5% |
| 29 | Nashville, TN | 31.0% |
| 30 | Virginia Beach, VA | 30.9% |
| 31 | Dallas, TX | 30.7% |
| 32 | St. Louis, MO | 29.9% |
| 33 | Houston, TX | 29.6% |
| 34 | Milwaukee, WI | 29.4% |
| 35 | Charlotte, NC | 29.3% |
| 36 | Detroit, MI | 28.3% |
| 37 | Cleveland, OH | 28.0% |
| 38 | Las Vegas, NV | 27.4% |
| 39 | Memphis, TN | 27.0% |
| 40 | San Antonio, TX | 26.7% |
| 41 | Jacksonville, FL | 25.2% |
| 42 | Louisville, KY | 25.0% |
| 43 | Tampa, FL | 24.9% |
| 44 | Kansas City, MO | 24.8% |
| 45 | Cincinnati, OH | 24.7% |
| 46 | Riverside, CA | 23.9% |
| 47 | Salt Lake City, UT | 21.6% |
| 48 | Phoenix, AZ | 21.5% |
| 49 | Fresno, CA | 20.7% |
| 50 | Indianapolis, IN | 20.3% |
Saving up to move out: Top expert tips
While living with your parents can have its benefits, you’ll probably (understandably) want to live independently eventually. For those looking to move out, we offer the following advice:
- Set financial goals for yourself. “Ultimately, the goal should be to save as much money as possible and put yourself in the best position possible for when you move out,” Schulz says. “However, different people will have different goals and different thresholds for how much is enough. That’s why setting some specific goals for your time there makes a lot of sense.”
- Build your credit. “Little in life is more expensive than crummy credit,” Schulz says. “Living at home and keeping your expenses to a minimum gives you a chance to do some positive work on your credit. Pay down those balances. Build up more available credit. Set up autopay to make sure you never pay late. All these things can make a difference in your ability to accomplish the goals you’ll be working toward.”
- Create and stick to a mock budget. Use your time at home to simulate the financial responsibilities you’ll have once you move out. Set a monthly budget that includes rent, utilities, groceries and other living expenses — even if you’re not paying them yet. Doing so can help ensure you’re financially prepared when it’s time to live on your own, and it’ll also provide a nest egg for your first few months.
Methodology
LendingTree analysts used 2018 and 2023 U.S. Census Bureau American Community Survey (ACS) microdata hosted on IPUMS to determine the percentage of working adults living at home in the 50 largest U.S. metros.
Specifically, we identified the metros with the highest share of working adults ages 25 to 40 (excluding students) living with their parents.
Among this group, we also calculated the following:
- The percentage change in the number of working adults living at home from 2018 to 2023
- The average annual income for working adults living with their parents compared to those living independently
- The percentage of earnings working adults living at home would need to spend on median rent for a one-bedroom apartment
- The percentage of working adults living at home with a bachelor’s degree or higher
Get debt consolidation loan offers from up to 5 lenders in minutes
Recommended Articles