Where Social Security Goes the Furthest for Retirees


While many dream of retirement, getting there isn’t so easy — particularly when it comes to managing your finances.
Debt is the last thing you want to worry about in your golden years, so having a big enough nest egg and factoring in how much of your spending Social Security will cover is crucial.
We’ll go over the metros where Social Security goes the furthest and which ones require the most savings.
Key findings
- On average, Social Security covers 30.11% of retirees’ spending. Across the 100 largest U.S. metros, the annual implied pretax need (average estimated annual expenditures before taxes) for retirees is $71,407, while the average Social Security income is $21,500.
- Social Security covers more than a third of retiree spending in only one of the 100 largest metros. With an implied pretax need of $61,821 and average Social Security income of $21,398, 34.61% of McAllen, Texas, retirees’ spending is covered. Buffalo, N.Y. (33.12%), and El Paso, Texas (32.85%), follow.
- California metros have the smallest chunk of retirees’ spending covered by Social Security. Among the 10 metros where Social Security covers the lowest percentage of implied pretax need, eight are in California. San Francisco (24.28%) and Los Angeles (24.85%) rank at the bottom, along with Washington, D.C. (24.91%).
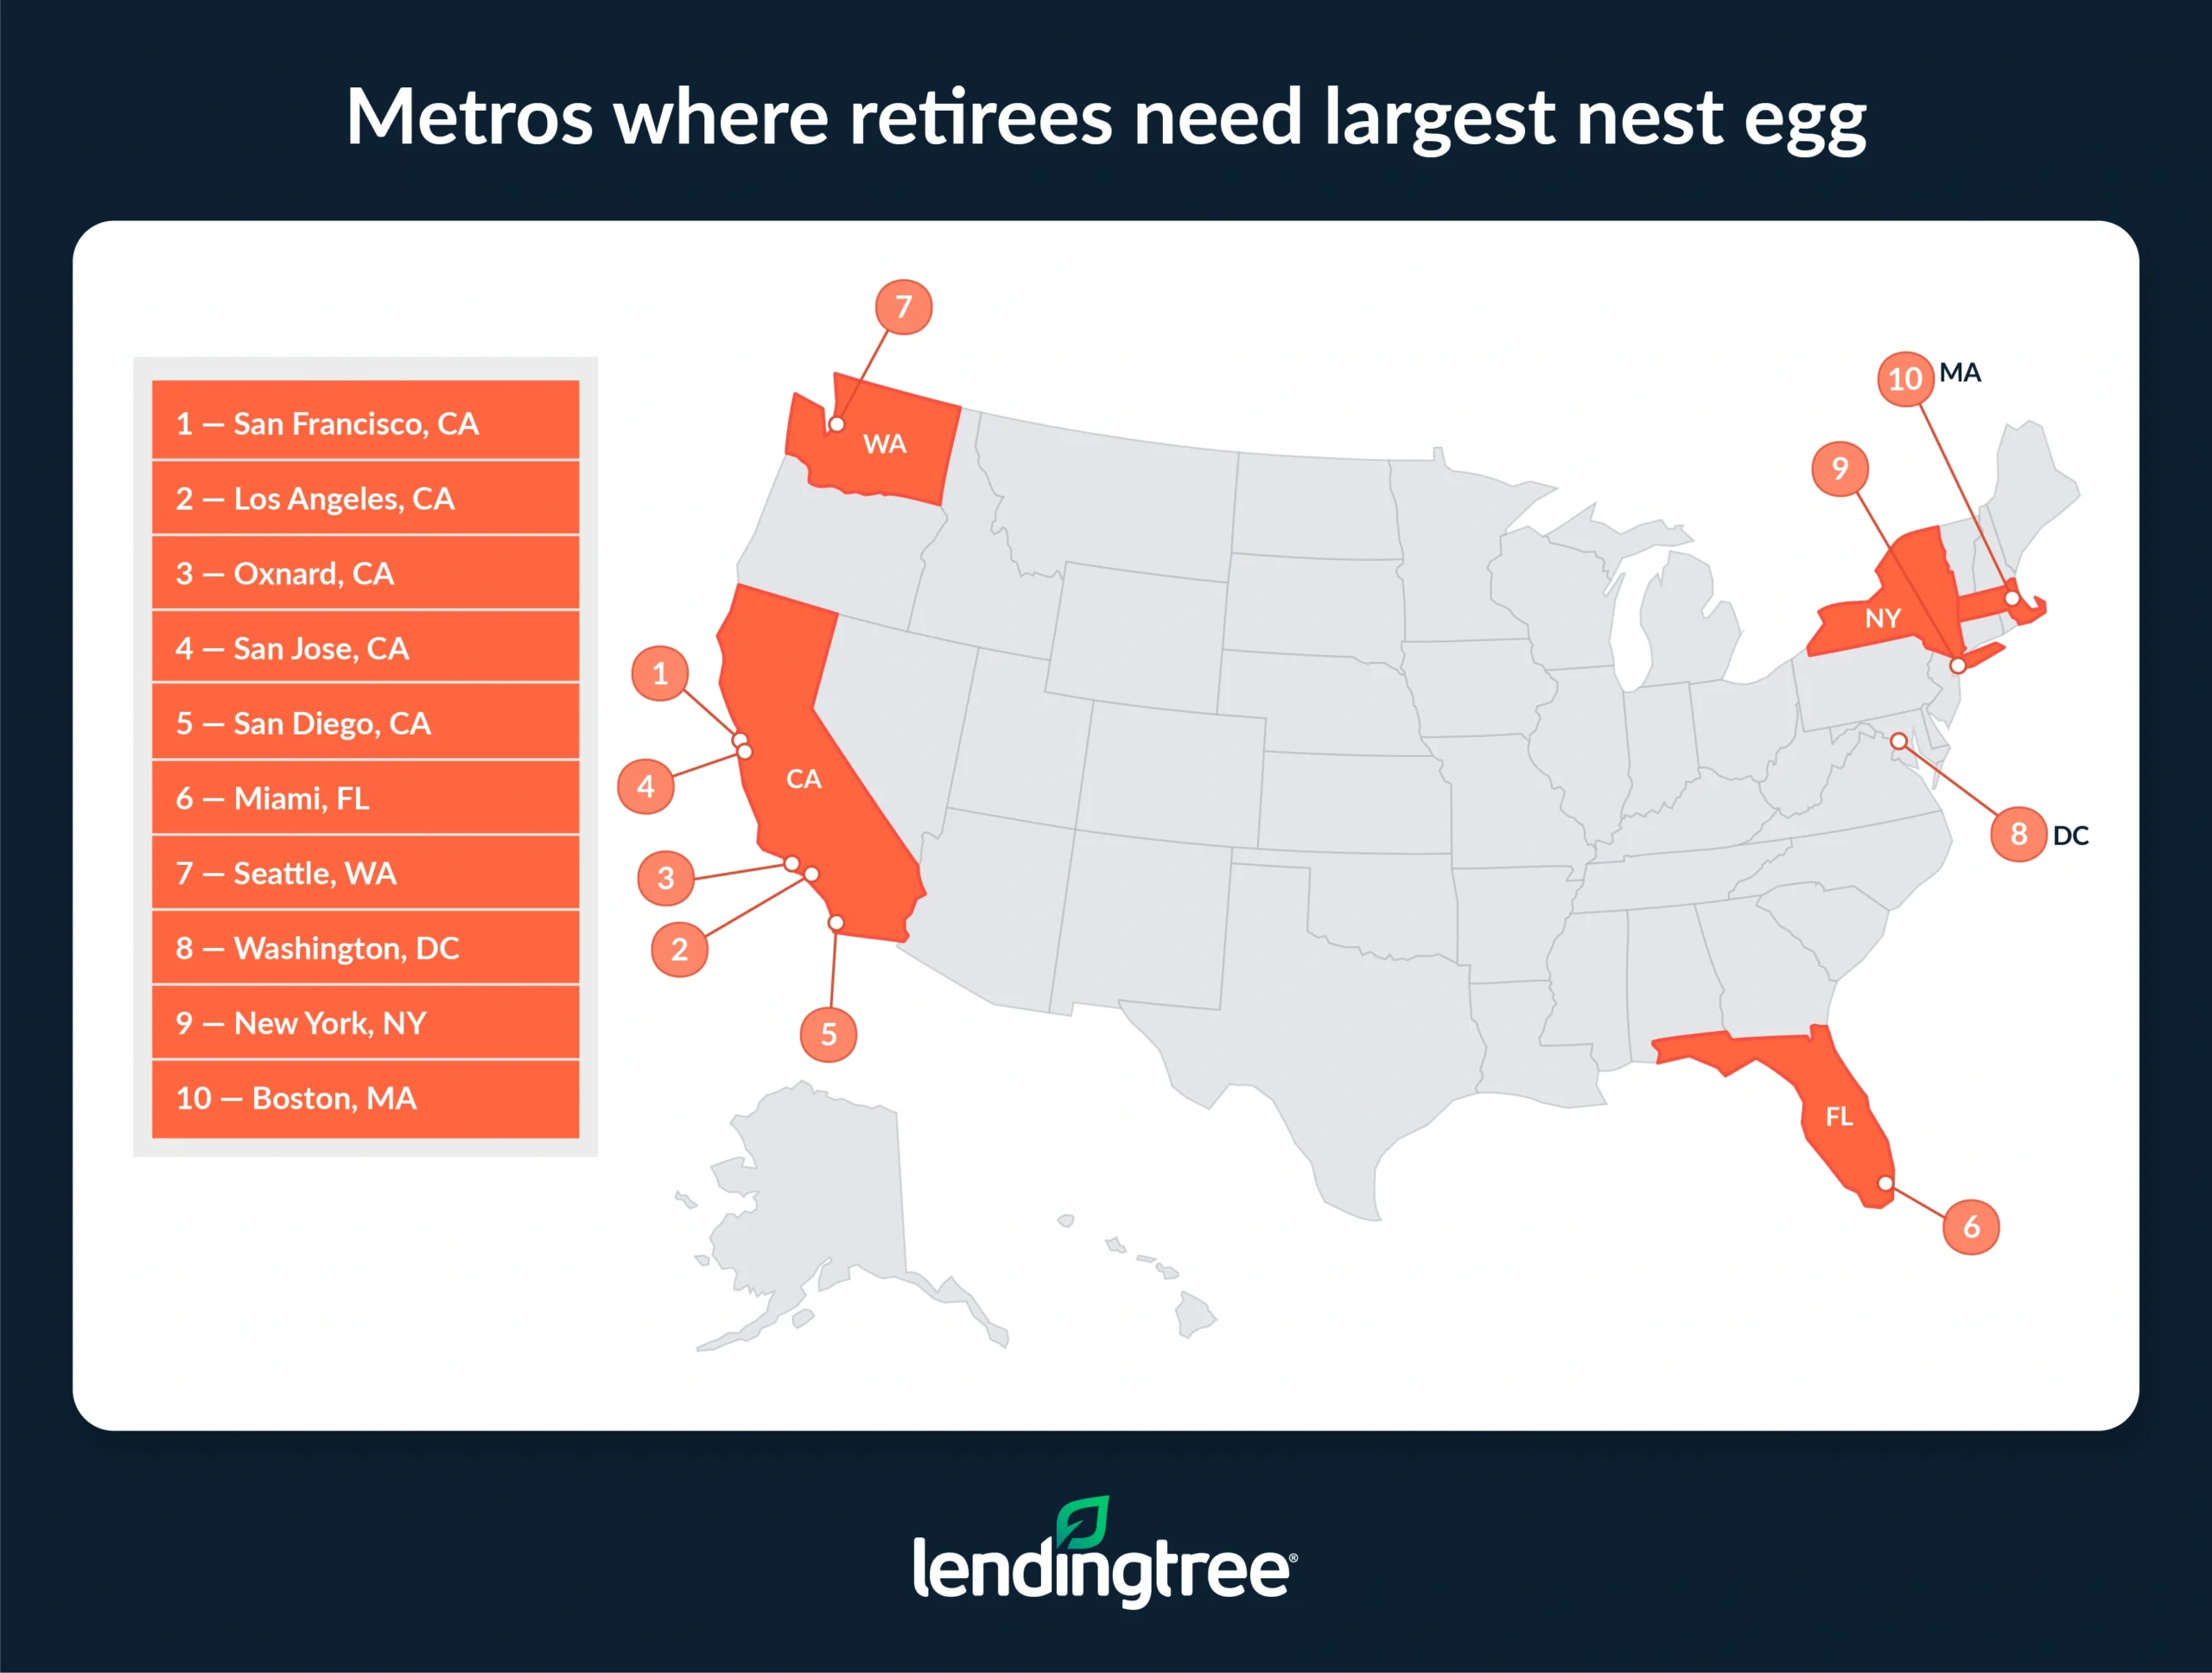
- Retirees in San Francisco require the biggest nest egg, needing $1.62 million to retire. After accounting for average Social Security income, retirees here need $64,638 annually from additional retirement funds to cover their spending. The five metros requiring the biggest nest eggs across the 100 largest are in California, with Los Angeles ($1.57 million) and Oxnard ($1.53 million) behind San Fran.
Social Security covers 30.11% of retiree spending on average
Across the 100 largest U.S. metros, the implied pretax need for retirees (or average estimated annual expenditures before taxes) is $71,407. Meanwhile, the average Social Security income in these metros is $21,500, meaning Social Security covers 30.11% of retirees’ spending.
According to Matt Schulz — LendingTree chief consumer finance analyst and author of “Ask Questions, Save Money, Make More: How to Take Control of Your Financial Life” — Americans generally have a lot of work to do before retiring comfortably.
“For many, that’ll never happen,” he says. “Most aren’t fortunate enough to have a seven-figure nest egg or a pension to lean on. Most people have tight budgets, limited expendable income and low retirement account balances. It’s all going to add up to a challenging situation for retirees and their loved ones in the next 15 to 20 years.”
Most aren’t fortunate enough to have a seven-figure nest egg or a pension to lean on. Most people have tight budgets, limited expendable income and low retirement account balances.

Retirees in this Texas metro rank first
Across the metros analyzed, Social Security covers more than a third of retirement spending in only one of the 100 largest metros: McAllen, Texas. Here, the implied pretax need is $61,821. Meanwhile, the average Social Security income is $21,398, meaning 34.61% of retirees’ spending is covered.
“There’s something to be said for living in a low-cost-of-living location, and McAllen fits that bill,” Schulz says. “Controlling your spending is a crucial step toward having a comfortable retirement, and that can be far easier in a place with cheaper housing and a lower cost of living.”
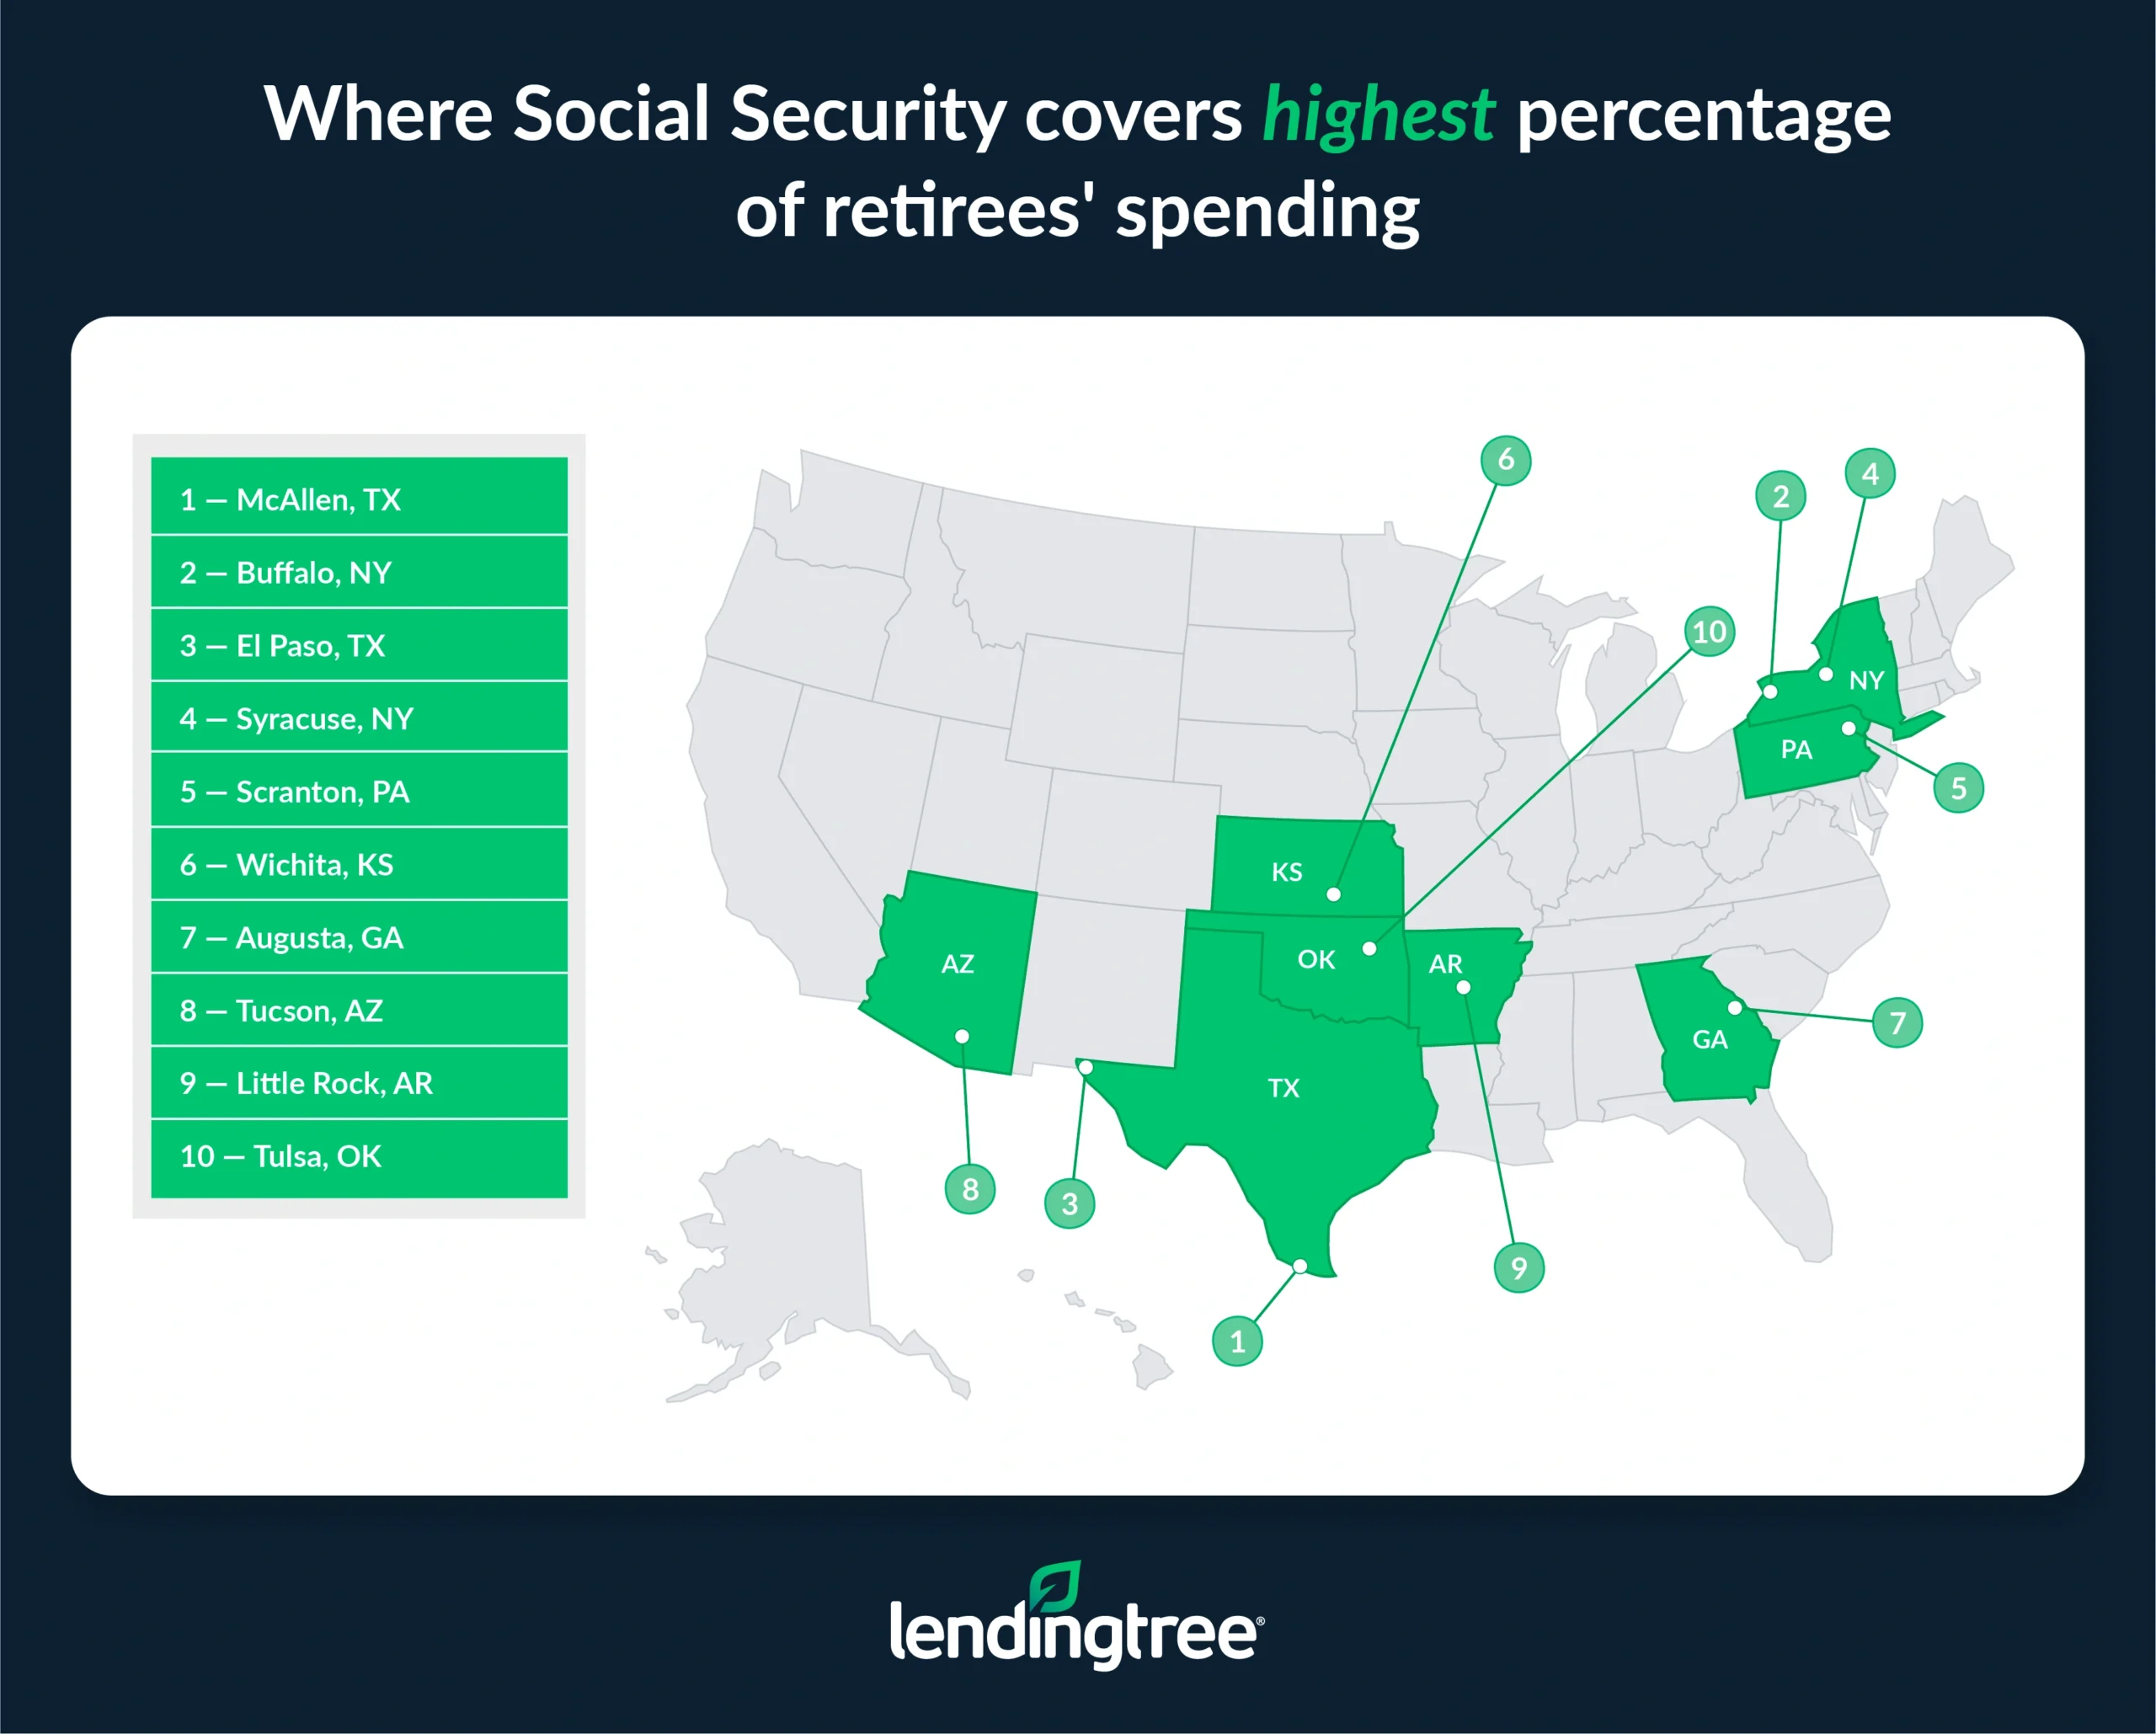
Buffalo, N.Y. (33.12%), follows, with an implied pretax need of $68,176 and an average Social Security income of $22,581. El Paso, Texas (32.85%), ranks third. Here, the implied pretax need is $65,143 and the average Social Security income is $21,398.
California metros least covered by Social Security
Perhaps unsurprisingly, given it’s one of the most expensive states in which to live, California metros have the smallest chunk of retirees’ spending covered by Social Security. Eight of the 10 metros where it covers the lowest percentage of implied pretax need are in the state.
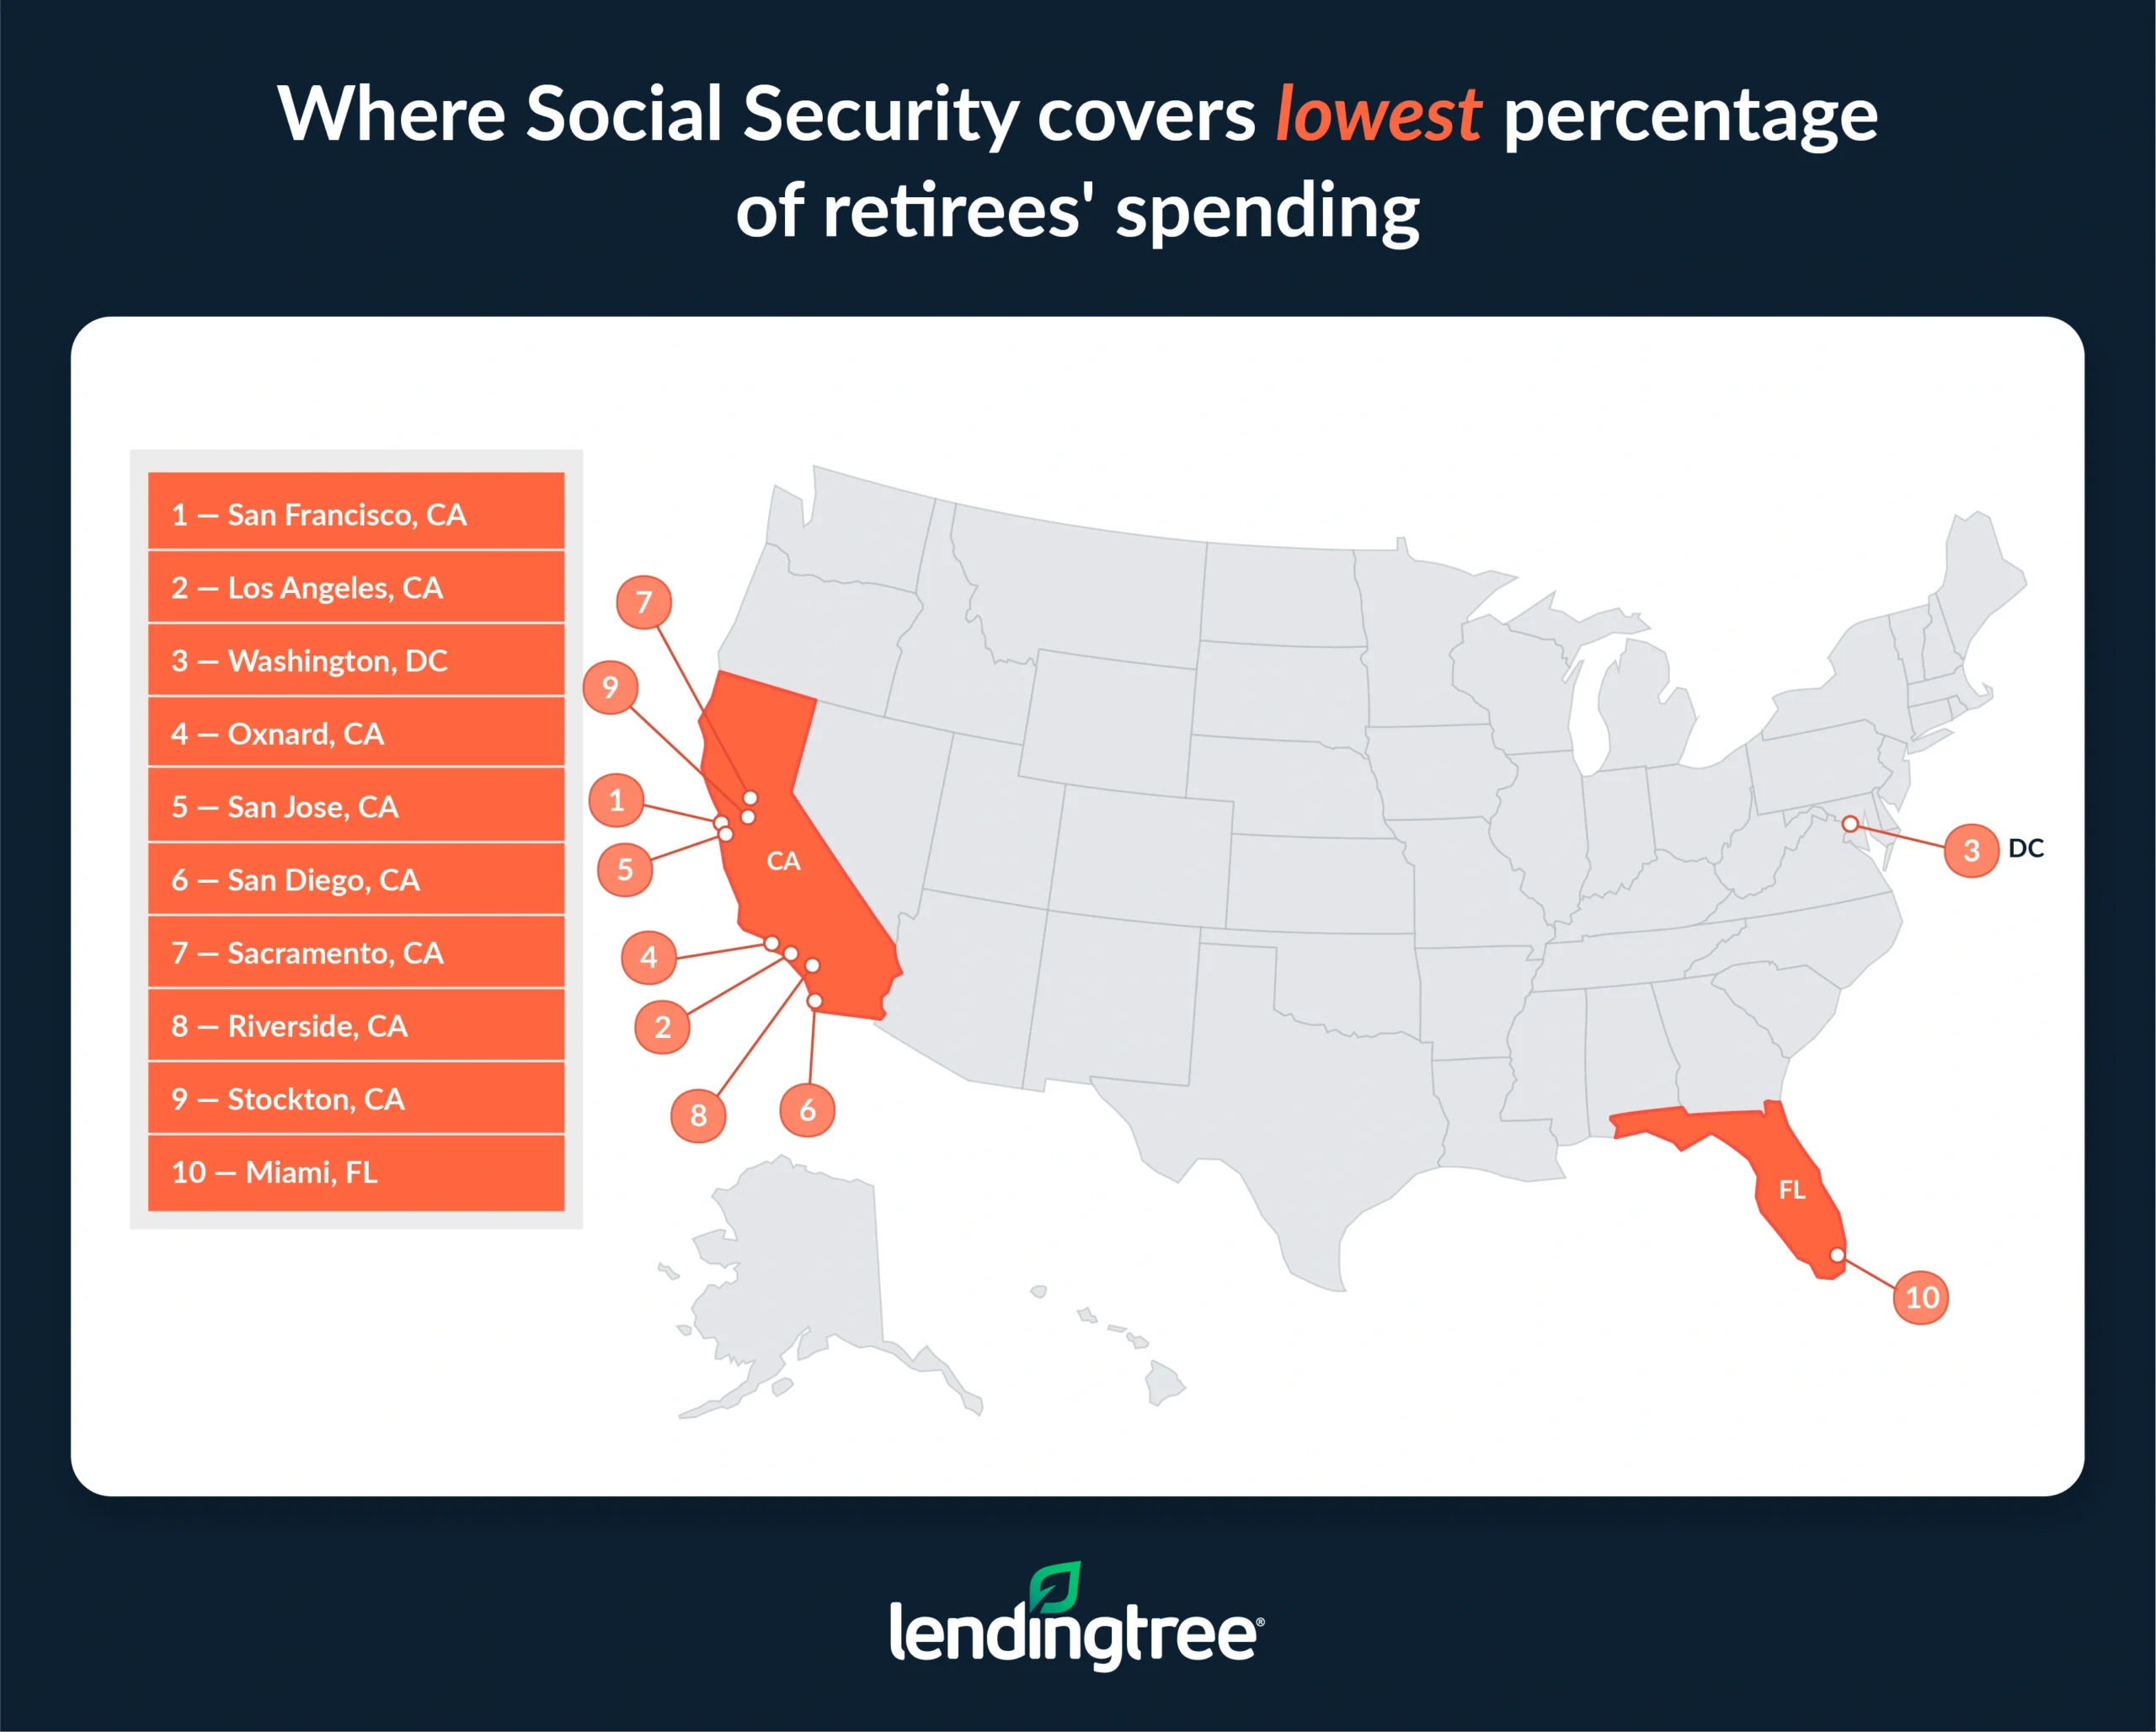
San Francisco (24.28%) ranks first, with an implied pretax need of $85,364 and an average Social Security income of just $20,726. Los Angeles (24.85%) follows. Here, the implied pretax need is $83,414 and the average Social Security income is $20,726. Washington, D.C. (24.91%), rounds out the bottom three.
Full rankings: Where Social Security covers highest/lowest percentage of retiree spending
| Rank | Metro | Avg. spending | Implied pretax need | Avg. SS retirement income | % of spending covered by SS |
|---|---|---|---|---|---|
| 1 | McAllen, TX | $50,673 | $61,821 | $21,398 | 34.61% |
| 2 | Buffalo, NY | $55,882 | $68,176 | $22,581 | 33.12% |
| 3 | El Paso, TX | $53,396 | $65,143 | $21,398 | 32.85% |
| 4 | Syracuse, NY | $56,355 | $68,754 | $22,581 | 32.84% |
| 5 | Scranton, PA | $55,053 | $67,165 | $21,978 | 32.72% |
| 6 | Wichita, KS | $52,981 | $64,637 | $21,096 | 32.64% |
| 7 | Augusta, GA | $53,869 | $65,720 | $21,317 | 32.44% |
| 8 | Tucson, AZ | $55,823 | $68,104 | $21,989 | 32.29% |
| 9 | Little Rock, AR | $52,744 | $64,348 | $20,772 | 32.28% |
| 10 | Tulsa, OK | $52,981 | $64,637 | $20,860 | 32.27% |
| 11 | Winston-Salem, NC | $54,106 | $66,009 | $21,280 | 32.24% |
| 11 | Pittsburgh, PA | $55,882 | $68,176 | $21,978 | 32.24% |
| 13 | Grand Rapids, MI | $56,355 | $68,754 | $22,117 | 32.17% |
| 14 | Birmingham, AL | $54,816 | $66,876 | $21,452 | 32.08% |
| 15 | Albany, NY | $57,776 | $70,487 | $22,581 | 32.04% |
| 16 | Rochester, NY | $57,835 | $70,559 | $22,581 | 32.00% |
| 17 | Greensboro, NC | $54,876 | $66,948 | $21,280 | 31.79% |
| 18 | Oklahoma City, OK | $53,869 | $65,720 | $20,860 | 31.74% |
| 19 | Greenville, SC | $54,935 | $67,020 | $21,268 | 31.73% |
| 20 | Memphis, TN | $54,698 | $66,732 | $21,157 | 31.70% |
| 20 | Columbia, SC | $54,994 | $67,093 | $21,268 | 31.70% |
| 22 | Toledo, OH | $53,514 | $65,287 | $20,665 | 31.65% |
| 23 | San Antonio, TX | $55,468 | $67,670 | $21,398 | 31.62% |
| 24 | Milwaukee, WI | $56,533 | $68,970 | $21,784 | 31.58% |
| 25 | Knoxville, TN | $54,935 | $67,020 | $21,157 | 31.57% |
| 25 | Chattanooga, TN | $54,935 | $67,020 | $21,157 | 31.57% |
| 27 | Baltimore, MD | $60,795 | $74,170 | $23,408 | 31.56% |
| 28 | Harrisburg, PA | $57,125 | $69,693 | $21,978 | 31.53% |
| 29 | Provo, UT | $56,237 | $68,609 | $21,615 | 31.50% |
| 30 | Madison, WI | $56,711 | $69,187 | $21,784 | 31.49% |
| 31 | Ogden, UT | $56,296 | $68,681 | $21,615 | 31.47% |
| 32 | Indianapolis, IN | $56,000 | $68,320 | $21,491 | 31.46% |
| 33 | Colorado Springs, CO | $57,658 | $70,343 | $22,121 | 31.45% |
| 34 | Las Vegas, NV | $57,658 | $70,343 | $22,105 | 31.42% |
| 35 | Baton Rouge, LA | $53,751 | $65,576 | $20,563 | 31.36% |
| 36 | New Orleans, LA | $53,928 | $65,793 | $20,563 | 31.25% |
| 36 | Detroit, MI | $58,013 | $70,776 | $22,117 | 31.25% |
| 38 | Virginia Beach, VA | $57,658 | $70,343 | $21,978 | 31.24% |
| 39 | Hartford, CT | $60,736 | $74,098 | $23,139 | 31.23% |
| 40 | Jackson, MS | $53,692 | $65,504 | $20,433 | 31.19% |
| 41 | Kansas City, MO | $55,231 | $67,381 | $20,991 | 31.15% |
| 41 | Boise, ID | $55,290 | $67,454 | $21,010 | 31.15% |
| 43 | Spokane, WA | $59,789 | $72,942 | $22,715 | 31.14% |
| 44 | Des Moines, IA | $54,876 | $66,948 | $20,817 | 31.09% |
| 45 | Richmond, VA | $58,013 | $70,776 | $21,978 | 31.05% |
| 45 | Salt Lake City, UT | $57,066 | $69,620 | $21,615 | 31.05% |
| 47 | Dayton, OH | $54,639 | $66,659 | $20,665 | 31.00% |
| 48 | New Haven, CT | $61,269 | $74,748 | $23,139 | 30.96% |
| 49 | Allentown, PA | $58,250 | $71,065 | $21,978 | 30.93% |
| 50 | Lakeland, FL | $57,658 | $70,343 | $21,740 | 30.91% |
| 51 | Louisville, KY | $55,645 | $67,887 | $20,948 | 30.86% |
| 52 | Akron, OH | $54,935 | $67,020 | $20,665 | 30.83% |
| 53 | Cleveland, OH | $55,053 | $67,165 | $20,665 | 30.77% |
| 54 | Albuquerque, NM | $55,053 | $67,165 | $20,600 | 30.67% |
| 55 | Omaha, NE | $54,757 | $66,804 | $20,462 | 30.63% |
| 56 | Durham, NC | $57,184 | $69,765 | $21,280 | 30.50% |
| 56 | Deltona, FL | $58,427 | $71,281 | $21,740 | 30.50% |
| 58 | Cincinnati, OH | $55,704 | $67,959 | $20,665 | 30.41% |
| 59 | Worcester, MA | $60,381 | $73,665 | $22,397 | 30.40% |
| 60 | Charlotte, NC | $57,421 | $70,054 | $21,280 | 30.38% |
| 61 | Austin, TX | $57,776 | $70,487 | $21,398 | 30.36% |
| 62 | Jacksonville, FL | $58,723 | $71,642 | $21,740 | 30.35% |
| 63 | Columbus, OH | $55,941 | $68,248 | $20,665 | 30.28% |
| 64 | St. Louis, MO | $57,007 | $69,548 | $20,991 | 30.18% |
| 65 | Bridgeport, CT | $63,045 | $76,915 | $23,139 | 30.08% |
| 65 | Nashville, TN | $57,658 | $70,343 | $21,157 | 30.08% |
| 67 | Raleigh, NC | $58,013 | $70,776 | $21,280 | 30.07% |
| 68 | Palm Bay, FL | $59,670 | $72,798 | $21,740 | 29.86% |
| 69 | Orlando, FL | $59,848 | $73,015 | $21,740 | 29.77% |
| 70 | Chicago, IL | $60,736 | $74,098 | $21,922 | 29.59% |
| 71 | Houston, TX | $59,315 | $72,365 | $21,398 | 29.57% |
| 72 | Philadelphia, PA | $61,269 | $74,748 | $21,978 | 29.40% |
| 73 | Minneapolis, MN | $61,861 | $75,470 | $22,151 | 29.35% |
| 74 | Cape Coral, FL | $60,736 | $74,098 | $21,740 | 29.34% |
| 75 | Charleston, SC | $59,552 | $72,654 | $21,268 | 29.27% |
| 76 | Atlanta, GA | $59,730 | $72,870 | $21,317 | 29.25% |
| 77 | Tampa, FL | $61,210 | $74,676 | $21,740 | 29.11% |
| 78 | North Port, FL | $61,328 | $74,820 | $21,740 | 29.06% |
| 79 | Denver, CO | $62,453 | $76,192 | $22,121 | 29.03% |
| 80 | Providence, RI | $59,730 | $72,870 | $21,124 | 28.99% |
| 81 | Phoenix, AZ | $62,453 | $76,192 | $21,989 | 28.86% |
| 82 | Dallas, TX | $61,150 | $74,604 | $21,398 | 28.68% |
| 83 | Poughkeepsie, NY | $64,939 | $79,226 | $22,581 | 28.50% |
| 84 | Bakersfield, CA | $60,499 | $73,809 | $20,726 | 28.08% |
| 85 | Seattle, WA | $66,893 | $81,609 | $22,715 | 27.83% |
| 86 | New York, NY | $66,597 | $81,248 | $22,581 | 27.79% |
| 86 | Boston, MA | $66,064 | $80,598 | $22,397 | 27.79% |
| 88 | Portland, OR | $63,104 | $76,987 | $21,390 | 27.78% |
| 89 | Fresno, CA | $61,565 | $75,109 | $20,726 | 27.59% |
| 90 | Honolulu, HI | $65,235 | $79,587 | $21,870 | 27.48% |
| 91 | Miami, FL | $66,182 | $80,742 | $21,740 | 26.93% |
| 92 | Stockton, CA | $63,577 | $77,565 | $20,726 | 26.72% |
| 93 | Riverside, CA | $63,873 | $77,926 | $20,726 | 26.60% |
| 94 | Sacramento, CA | $64,465 | $78,648 | $20,726 | 26.35% |
| 95 | San Diego, CA | $66,005 | $80,526 | $20,726 | 25.74% |
| 96 | San Jose, CA | $66,833 | $81,537 | $20,726 | 25.42% |
| 97 | Oxnard, CA | $67,189 | $81,970 | $20,726 | 25.28% |
| 98 | Washington, DC | $64,288 | $78,431 | $19,540 | 24.91% |
| 99 | Los Angeles, CA | $68,372 | $83,414 | $20,726 | 24.85% |
| 100 | San Francisco, CA | $69,971 | $85,364 | $20,726 | 24.28% |
San Francisco requires biggest nest egg for retirees
As far as the metros where Americans need the most to retire, San Francisco ranks first. Here, retirees need a whopping $1.62 million to retire. After accounting for average Social Security income, retirees need $64,638 annually from additional retirement funds to cover their spending.
According to Schulz, that need for a large nest egg is going to force some difficult choices. “There’s no question that many Californians will have to work longer than they’d like to, and many will have to look elsewhere to retire,” he says. “That’s the unfortunate reality facing many people in that state. In places as expensive as California’s biggest cities, something has to give.”
California again tops the list, with all five of the metros requiring the biggest nest eggs across the 100 largest being in the state. Los Angeles ($1.57 million) follows, with retirees needing an additional $62,688 annually to cover their spending. Oxnard ($1.53 million) ranks third, with retirees needing an additional $61,244 annually.
On the other hand, McAllen ranks at the bottom, requiring a nest egg of $1.0 million, or $40,422 in additional annual income. Wichita, Kan. ($1.1 million), and Little Rock, Ark. ($1.1 million), follow.
Full rankings: Metros where retirees need largest/smallest nest egg
| Rank | Metro | Avg. spending | Implied pretax need | Avg. SS retirement income | Income needed from retirement funds | Nest egg size |
|---|---|---|---|---|---|---|
| 1 | San Francisco, CA | $69,971 | $85,364 | $20,726 | $64,638 | $1,615,958 |
| 2 | Los Angeles, CA | $68,372 | $83,414 | $20,726 | $62,688 | $1,567,210 |
| 3 | Oxnard, CA | $67,189 | $81,970 | $20,726 | $61,244 | $1,531,100 |
| 4 | San Jose, CA | $66,833 | $81,537 | $20,726 | $60,811 | $1,520,266 |
| 5 | San Diego, CA | $66,005 | $80,526 | $20,726 | $59,800 | $1,494,989 |
| 6 | Miami, FL | $66,182 | $80,742 | $21,740 | $59,002 | $1,475,056 |
| 7 | Seattle, WA | $66,893 | $81,609 | $22,715 | $58,894 | $1,472,349 |
| 8 | Washington, DC | $64,288 | $78,431 | $19,540 | $58,891 | $1,472,270 |
| 9 | New York, NY | $66,597 | $81,248 | $22,581 | $58,667 | $1,466,680 |
| 10 | Boston, MA | $66,064 | $80,598 | $22,397 | $58,201 | $1,455,021 |
| 11 | Sacramento, CA | $64,465 | $78,648 | $20,726 | $57,922 | $1,448,046 |
| 12 | Honolulu, HI | $65,235 | $79,587 | $21,870 | $57,716 | $1,442,911 |
| 13 | Riverside, CA | $63,873 | $77,926 | $20,726 | $57,200 | $1,429,991 |
| 14 | Stockton, CA | $63,577 | $77,565 | $20,726 | $56,839 | $1,420,964 |
| 15 | Poughkeepsie, NY | $64,939 | $79,226 | $22,581 | $56,645 | $1,416,125 |
| 16 | Portland, OR | $63,104 | $76,987 | $21,390 | $55,597 | $1,389,918 |
| 17 | Fresno, CA | $61,565 | $75,109 | $20,726 | $54,383 | $1,359,576 |
| 18 | Phoenix, AZ | $62,453 | $76,192 | $21,989 | $54,204 | $1,355,094 |
| 19 | Denver, CO | $62,453 | $76,192 | $22,121 | $54,071 | $1,351,773 |
| 20 | Bridgeport, CT | $63,045 | $76,915 | $23,139 | $53,775 | $1,344,376 |
| 21 | Minneapolis, MN | $61,861 | $75,470 | $22,151 | $53,319 | $1,332,974 |
| 22 | Dallas, TX | $61,150 | $74,604 | $21,398 | $53,205 | $1,330,133 |
| 23 | Bakersfield, CA | $60,499 | $73,809 | $20,726 | $53,083 | $1,327,077 |
| 24 | North Port, FL | $61,328 | $74,820 | $21,740 | $53,080 | $1,327,004 |
| 25 | Tampa, FL | $61,210 | $74,676 | $21,740 | $52,936 | $1,323,393 |
| 26 | Philadelphia, PA | $61,269 | $74,748 | $21,978 | $52,770 | $1,319,261 |
| 27 | Cape Coral, FL | $60,736 | $74,098 | $21,740 | $52,358 | $1,308,949 |
| 28 | Chicago, IL | $60,736 | $74,098 | $21,922 | $52,176 | $1,304,401 |
| 29 | Providence, RI | $59,730 | $72,870 | $21,124 | $51,747 | $1,293,664 |
| 30 | New Haven, CT | $61,269 | $74,748 | $23,139 | $51,608 | $1,290,211 |
| 31 | Atlanta, GA | $59,730 | $72,870 | $21,317 | $51,554 | $1,288,843 |
| 32 | Charleston, SC | $59,552 | $72,654 | $21,268 | $51,385 | $1,284,628 |
| 33 | Orlando, FL | $59,848 | $73,015 | $21,740 | $51,275 | $1,281,866 |
| 34 | Worcester, MA | $60,381 | $73,665 | $22,397 | $51,268 | $1,281,692 |
| 35 | Palm Bay, FL | $59,670 | $72,798 | $21,740 | $51,058 | $1,276,450 |
| 36 | Houston, TX | $59,315 | $72,365 | $21,398 | $50,966 | $1,274,162 |
| 37 | Hartford, CT | $60,736 | $74,098 | $23,139 | $50,958 | $1,273,962 |
| 38 | Baltimore, MD | $60,795 | $74,170 | $23,408 | $50,762 | $1,269,042 |
| 39 | Spokane, WA | $59,789 | $72,942 | $22,715 | $50,228 | $1,255,689 |
| 40 | Jacksonville, FL | $58,723 | $71,642 | $21,740 | $49,902 | $1,247,562 |
| 41 | Deltona, FL | $58,427 | $71,281 | $21,740 | $49,541 | $1,238,534 |
| 42 | Raleigh, NC | $58,013 | $70,776 | $21,280 | $49,496 | $1,237,399 |
| 43 | Nashville, TN | $57,658 | $70,343 | $21,157 | $49,186 | $1,229,647 |
| 44 | Austin, TX | $57,776 | $70,487 | $21,398 | $49,089 | $1,227,219 |
| 45 | Allentown, PA | $58,250 | $71,065 | $21,978 | $49,087 | $1,227,180 |
| 46 | Richmond, VA | $58,013 | $70,776 | $21,978 | $48,798 | $1,219,958 |
| 47 | Charlotte, NC | $57,421 | $70,054 | $21,280 | $48,774 | $1,219,344 |
| 48 | Detroit, MI | $58,013 | $70,776 | $22,117 | $48,658 | $1,216,459 |
| 49 | Lakeland, FL | $57,658 | $70,343 | $21,740 | $48,603 | $1,215,063 |
| 50 | St. Louis, MO | $57,007 | $69,548 | $20,991 | $48,557 | $1,213,926 |
| 51 | Durham, NC | $57,184 | $69,765 | $21,280 | $48,485 | $1,212,122 |
| 52 | Virginia Beach, VA | $57,658 | $70,343 | $21,978 | $48,365 | $1,209,125 |
| 53 | Las Vegas, NV | $57,658 | $70,343 | $22,105 | $48,238 | $1,205,942 |
| 54 | Colorado Springs, CO | $57,658 | $70,343 | $22,121 | $48,221 | $1,205,527 |
| 55 | Salt Lake City, UT | $57,066 | $69,620 | $21,615 | $48,005 | $1,200,132 |
| 56 | Rochester, NY | $57,835 | $70,559 | $22,581 | $47,979 | $1,199,465 |
| 57 | Albany, NY | $57,776 | $70,487 | $22,581 | $47,906 | $1,197,659 |
| 58 | Harrisburg, PA | $57,125 | $69,693 | $21,978 | $47,715 | $1,192,875 |
| 59 | Columbus, OH | $55,941 | $68,248 | $20,665 | $47,583 | $1,189,572 |
| 60 | Madison, WI | $56,711 | $69,187 | $21,784 | $47,403 | $1,185,080 |
| 61 | Cincinnati, OH | $55,704 | $67,959 | $20,665 | $47,294 | $1,182,350 |
| 62 | Milwaukee, WI | $56,533 | $68,970 | $21,784 | $47,187 | $1,179,663 |
| 63 | Ogden, UT | $56,296 | $68,681 | $21,615 | $47,066 | $1,176,660 |
| 64 | Provo, UT | $56,237 | $68,609 | $21,615 | $46,994 | $1,174,855 |
| 65 | Louisville, KY | $55,645 | $67,887 | $20,948 | $46,939 | $1,173,475 |
| 66 | Indianapolis, IN | $56,000 | $68,320 | $21,491 | $46,829 | $1,170,729 |
| 67 | Grand Rapids, MI | $56,355 | $68,754 | $22,117 | $46,636 | $1,165,904 |
| 68 | Albuquerque, NM | $55,053 | $67,165 | $20,600 | $46,565 | $1,164,132 |
| 69 | Cleveland, OH | $55,053 | $67,165 | $20,665 | $46,500 | $1,162,490 |
| 70 | Boise, ID | $55,290 | $67,454 | $21,010 | $46,443 | $1,161,086 |
| 71 | Kansas City, MO | $55,231 | $67,381 | $20,991 | $46,390 | $1,159,761 |
| 72 | Akron, OH | $54,935 | $67,020 | $20,665 | $46,355 | $1,158,879 |
| 73 | Omaha, NE | $54,757 | $66,804 | $20,462 | $46,341 | $1,158,533 |
| 74 | San Antonio, TX | $55,468 | $67,670 | $21,398 | $46,272 | $1,156,804 |
| 75 | Pittsburgh, PA | $55,882 | $68,176 | $21,978 | $46,198 | $1,154,960 |
| 76 | Syracuse, NY | $56,355 | $68,754 | $22,581 | $46,173 | $1,154,327 |
| 77 | Des Moines, IA | $54,876 | $66,948 | $20,817 | $46,131 | $1,153,285 |
| 78 | Tucson, AZ | $55,823 | $68,104 | $21,989 | $46,115 | $1,152,877 |
| 79 | Dayton, OH | $54,639 | $66,659 | $20,665 | $45,994 | $1,149,851 |
| 80 | Knoxville, TN | $54,935 | $67,020 | $21,157 | $45,864 | $1,146,594 |
| 80 | Chattanooga, TN | $54,935 | $67,020 | $21,157 | $45,864 | $1,146,594 |
| 82 | Columbia, SC | $54,994 | $67,093 | $21,268 | $45,824 | $1,145,605 |
| 83 | Greenville, SC | $54,935 | $67,020 | $21,268 | $45,752 | $1,143,799 |
| 84 | Greensboro, NC | $54,876 | $66,948 | $21,280 | $45,668 | $1,141,708 |
| 85 | Buffalo, NY | $55,882 | $68,176 | $22,581 | $45,595 | $1,139,883 |
| 86 | Memphis, TN | $54,698 | $66,732 | $21,157 | $45,575 | $1,139,372 |
| 87 | Birmingham, AL | $54,816 | $66,876 | $21,452 | $45,424 | $1,135,597 |
| 88 | New Orleans, LA | $53,928 | $65,793 | $20,563 | $45,230 | $1,130,744 |
| 89 | Scranton, PA | $55,053 | $67,165 | $21,978 | $45,187 | $1,129,683 |
| 90 | Jackson, MS | $53,692 | $65,504 | $20,433 | $45,071 | $1,126,778 |
| 91 | Baton Rouge, LA | $53,751 | $65,576 | $20,563 | $45,013 | $1,125,327 |
| 92 | Oklahoma City, OK | $53,869 | $65,720 | $20,860 | $44,861 | $1,121,515 |
| 93 | Winston-Salem, NC | $54,106 | $66,009 | $21,280 | $44,729 | $1,118,236 |
| 94 | Toledo, OH | $53,514 | $65,287 | $20,665 | $44,622 | $1,115,547 |
| 95 | Augusta, GA | $53,869 | $65,720 | $21,317 | $44,404 | $1,110,098 |
| 96 | Tulsa, OK | $52,981 | $64,637 | $20,860 | $43,777 | $1,094,432 |
| 97 | El Paso, TX | $53,396 | $65,143 | $21,398 | $43,744 | $1,093,612 |
| 98 | Little Rock, AR | $52,744 | $64,348 | $20,772 | $43,576 | $1,089,409 |
| 99 | Wichita, KS | $52,981 | $64,637 | $21,096 | $43,541 | $1,088,535 |
| 100 | McAllen, TX | $50,673 | $61,821 | $21,398 | $40,422 | $1,010,558 |
Preparing for retirement: Top expert tips
Your golden years shouldn’t be a financial strain, but unfortunately they are for many Americans. Schulz recommends the following advice for those nearing retirement:
- When in doubt, put more away. “Very few people can comfortably say they’ll have plenty of money to retire on regardless of what happens to Social Security,” he says. “Knowing that, the more you can put into retirement savings and the longer you can do it, the better off you’ll be.”
- Be ruthless in prioritizing your spending. “Living on a fixed income isn’t easy, especially for those who earned a lot in their careers but didn’t put enough savings away,” he says. “It can be a seriously rude awakening. One of the most important things to do is be laser-focused on controlling spending. Every cent you spend on things that don’t matter can’t be spent on the things that do, so take the time to assess your budget and make sure your spending lines up with your values.”
- Knock down your high-interest debt. “Credit card debt is a killer for retirees,” he says. “Those card payments take up funds that could be much better used elsewhere. If you have good credit — as many older Americans do — consider a 0% balance transfer credit card. It’s perhaps the best weapon you have in the battle against credit card debt. If your credit isn’t great, consider a low-interest personal loan. You can even call your card issuer and ask them to lower your rate. It works way more often than you’d imagine.”
Methodology
To determine where Social Security stretches the furthest, LendingTree analysts conducted two calculations:
- Estimating annual retiree spending: Researchers estimated average annual retiree expenditures by multiplying the average annual expenditures of retired workers (using U.S. Bureau of Labor Statistics — BLS — 2023 Consumer Expenditure Survey data) with the cost of living (using U.S. Bureau of Economic Analysis — BEA — 2023 regional price parity data) in each metro. We adjusted for inflation using the year-over-year change in the BLS Consumer Price Index from April 2024 to April 2025. To account for taxes, these expenditures were then converted to pretax income levels, assuming a flat 22% federal tax rate (via the Tax Foundation).
- Calculating coverage by Social Security: Researchers divided the average annualized Social Security retirement benefit (based on 2024 Social Security Administration — SSA — averages plus 2025 cost-of-living adjustments) by the implied pretax income required. Researchers also applied the “4% rule” to determine necessary retirement assets, dividing the gap between implied needs and Social Security benefits by 4% to estimate required savings.
Researchers used the U.S. Census Bureau 2023 American Community Survey with five-year estimates to identify the 100 largest metros.
Get debt consolidation loan offers from up to 5 lenders in minutes