Decade in Debt: Mortgage Borrowers Regain Footing After Housing Crisis

The global financial crisis was centered on the U.S. housing market, or to be more specific, on the mortgage industry. Rabid optimism about the future path of home prices — and increasingly permissive and irresponsible lending standards — created a tidal wave of home purchases as everyone became a speculative investor in housing.
It all came crashing down and, to save us all, the Federal Reserve stepped in with a massive unprecedented quantitative easing program. Ten years later, the Fed remains a primary player in the mortgage market, with its large balance sheet enabling liquidity and keeping the cost of borrowing low. However, unlike prior to the crisis, the accessibility of mortgages loans has changed dramatically as lending standards are much tighter. Many people who got burned during the housing downturn are now shy to participate or wary of taking on housing debt. As one result, the indebtedness of homeowners has improved relative to their income and assets.
Key findings
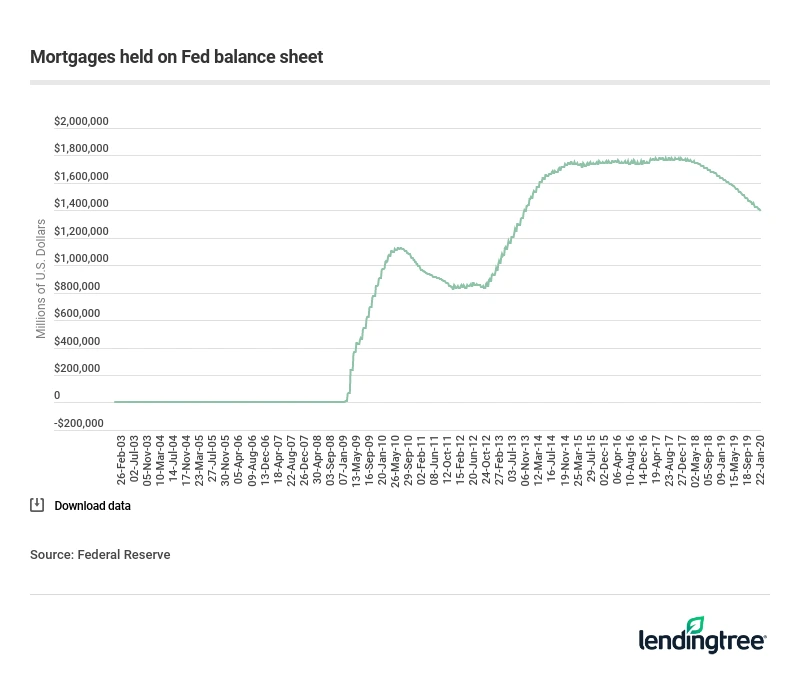
- The value of mortgage-backed securities held by the Federal Reserve rose from $909 billion at the start of the decade to $1.4 trillion by its end. This increase has kept mortgage rates low in the aftermath of the Great Recession.
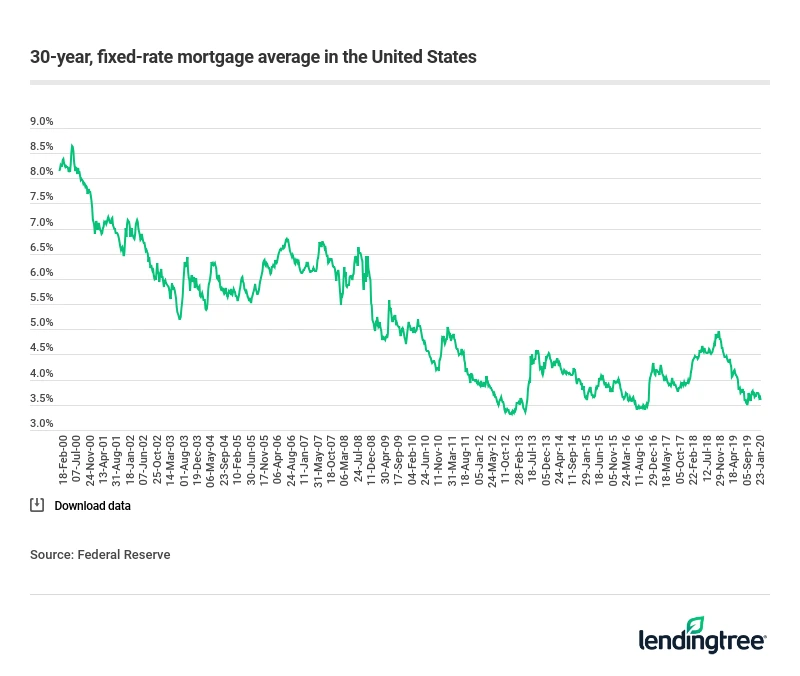
- The average rate for a 30-year, fixed-rate mortgage in the United States was 3.74% at the end of the decade. This is more than a point lower than the average rate of 5.09% at the start of the decade, meaning that borrowing became less expensive throughout the 2010s.
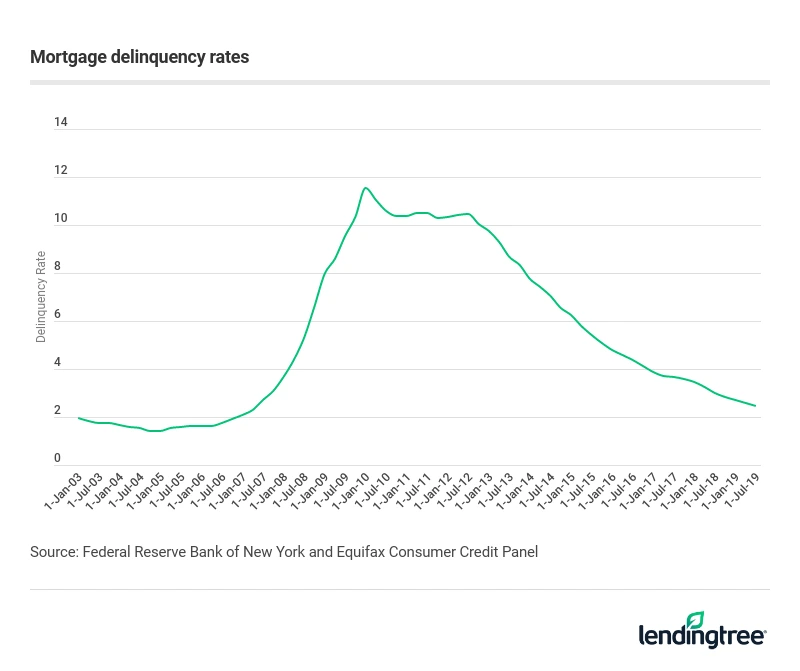
- In 2019, mortgage delinquency rates fell to 2.45%, the lowest level in a decade. In 2010, mortgage delinquency rates reached 11.5%.
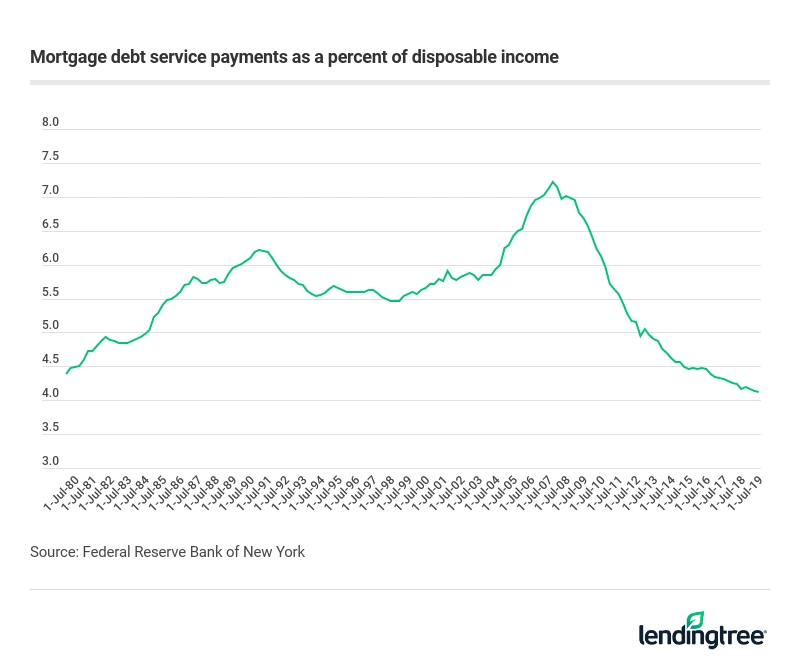
- As of 2019, homeowners spent 4.1% of their annual household income on their mortgage payments, the lowest percentage since the start of the decade. It’s also the lowest percentage since the Fed began tracking the data in 1980.
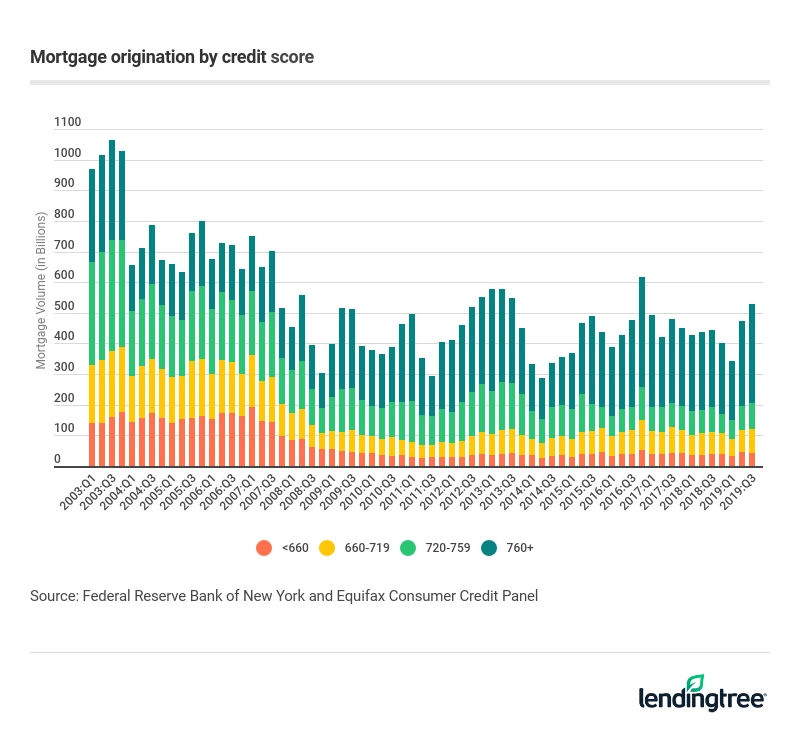
- Mortgage lending standards have tightened considerably over the past decade, making it harder for borrowers with lower credit scores to be approved for a loan. As of 2019, only 8% of mortgages went to subprime borrowers, down from 20% prior to the financial crisis.
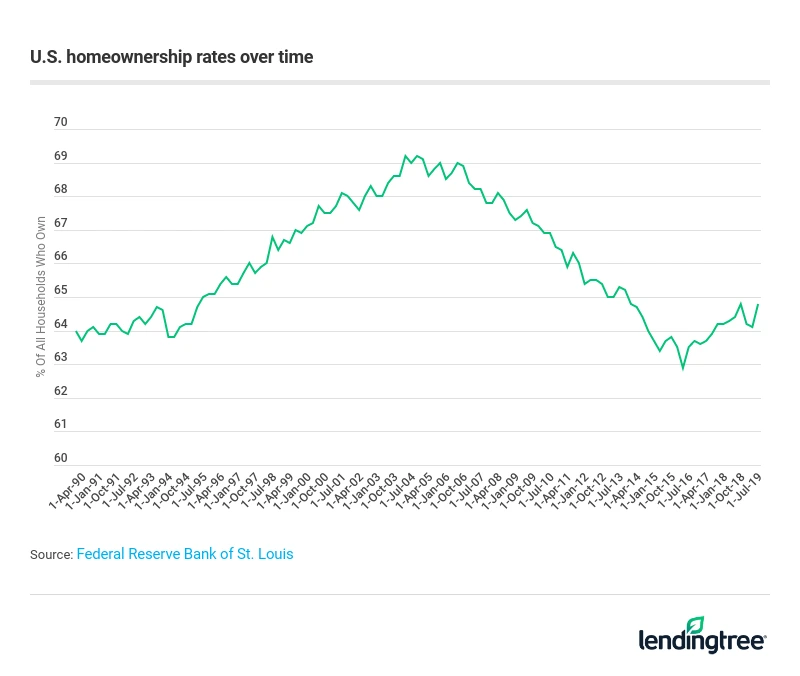
- Though the housing market has mostly recovered since the Great Recession, the homeownership rate in the U.S. is still lower than its pre-crisis level. In 2019, the homeownership rate was 64.8%, or about 2 percentage points lower than it was at the start of the decade and more than 4 percentage points below its pre-crisis peak.
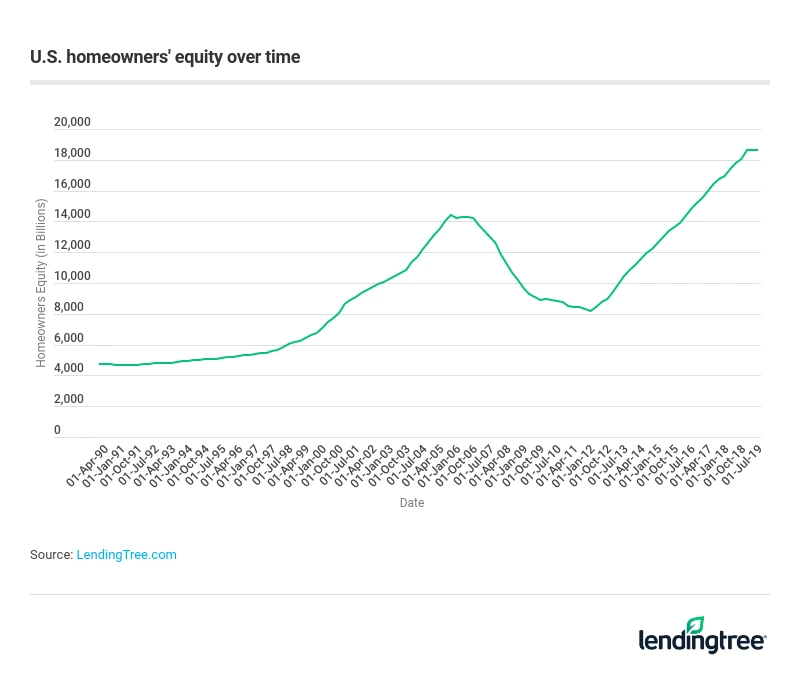
- Home equity has risen considerably over the last decade. Since its low point of $8.2 trillion in 2012, the value of home equity surpassed its pre-crisis peak at $14.4 trillion and rose to $18.7 trillion in 2019.
Lower rates, thanks to the Fed
The Federal Reserve’s holdings of mortgage securities rose from $909 billion at the start of 2010 to $1.4 trillion at the end of 2019. It maintained a consistently high level of mortgages on its balance sheet throughout the decade, helping keep mortgage rates low. Thirty-year fixed rates were 5.09% at the start of the decade and fell consistently below this level through the decade ending at 3.74%.
The defining measure of the financial crisis was the sharp rise in mortgage delinquencies and foreclosures. What a difference a decade makes. Loans in default are now well below where they were at the start of the decade, 2.45% in 2019 compared to 11.5% in 2010. Aside from tighter lending standards and low mortgage rates, gradual but steady improvements in the job market have helped reduce loan delinquencies and defaults.
Although wage growth wasn’t robust through the decade, current homeowners are spending just 4.1% of their annual household income on mortgage payments, the lowest percentage since the Fed began tracking the data in 1980. This smaller payment burden contributes to the low level of delinquencies.
Restricted credit access for lower credit scores
Another reason for the improved performance of mortgage data has been a significant tightening in lending standards. Before the housing downturn, there was a significant innovation in mortgage loan types, many of which proved to be poorly designed when home values fell and the labor market weakened. Subprime loans, in particular, are no longer as prevalent, and subprime borrowers received just 8% of all mortgages in the third quarter of 2019, down from 20% prior to the crisis.
What does this mean? Mortgage credit has shifted more readily to borrowers with higher credit scores. Those with excellent credit of 760 and up now receive 61% of mortgages, up from 28% before the crisis. These borrowers have more choices than ever with the rise of digital lending.
Fewer homeowners
One of the drivers of the housing bubble was to increase the rate of homeownership. It worked for a while as the homeownership rate rose to a high of 69.2% in 2004. However, it also drove some of the product creation and the lack of regulatory oversight that led to the crisis. As millions of people lost their homes and access to mortgages declined, the homeownership rate tumbled, down to 64.8% today.
More housing wealth, but less liquid
For those who managed to hold onto their homes through the crisis or who were able to purchase in its aftermath, it’s been a banner decade. Rising home prices have added trillions to net housing wealth. Home equity crashed to just $8.2 trillion in 2012 from a pre-crisis peak of $14.4 trillion. Today, home equity has surpassed the pre-downturn peak, increasing to $18.7 trillion in 2019.
LendingTree research analyst Jacob Channel contributed to this report.
View mortgage loan offers from up to 5 lenders in minutes