Best and Worst Drivers by State: 2025 Report
Driving is easily one of the most dangerous tasks in our daily lives. And our own good driving is only half of the equation when it comes to staying safe on the road — the driving habits of those around us also play a pivotal role.
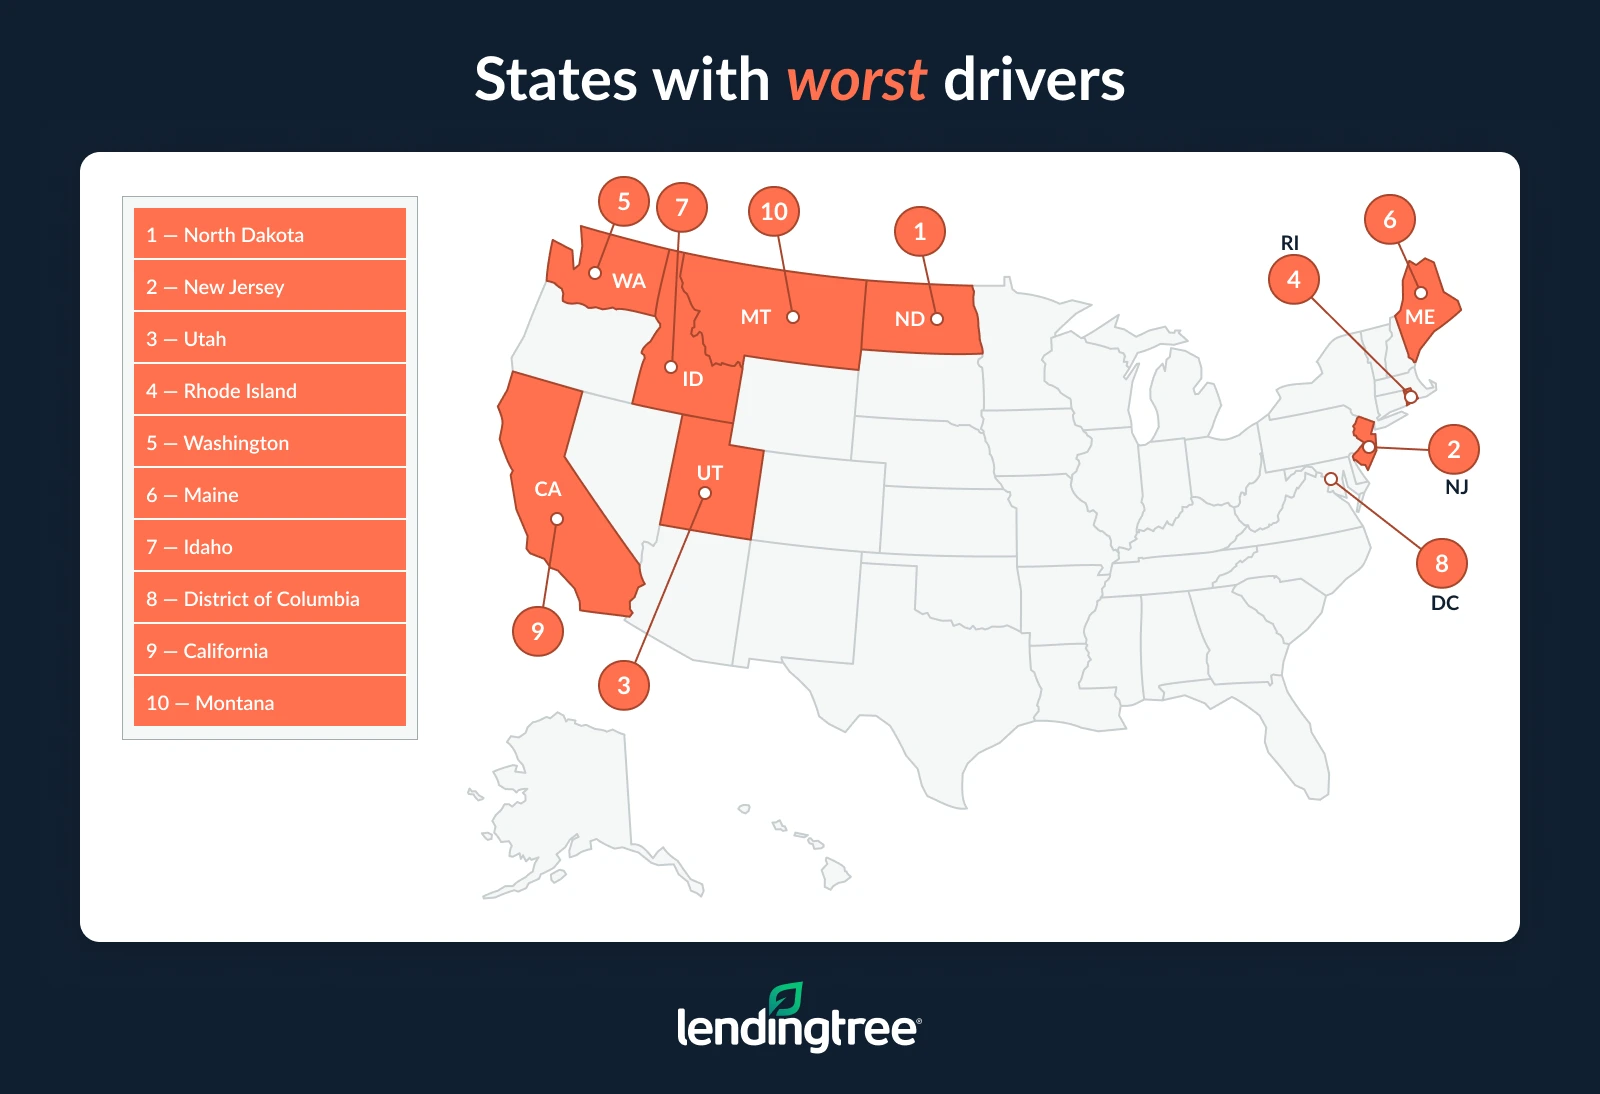
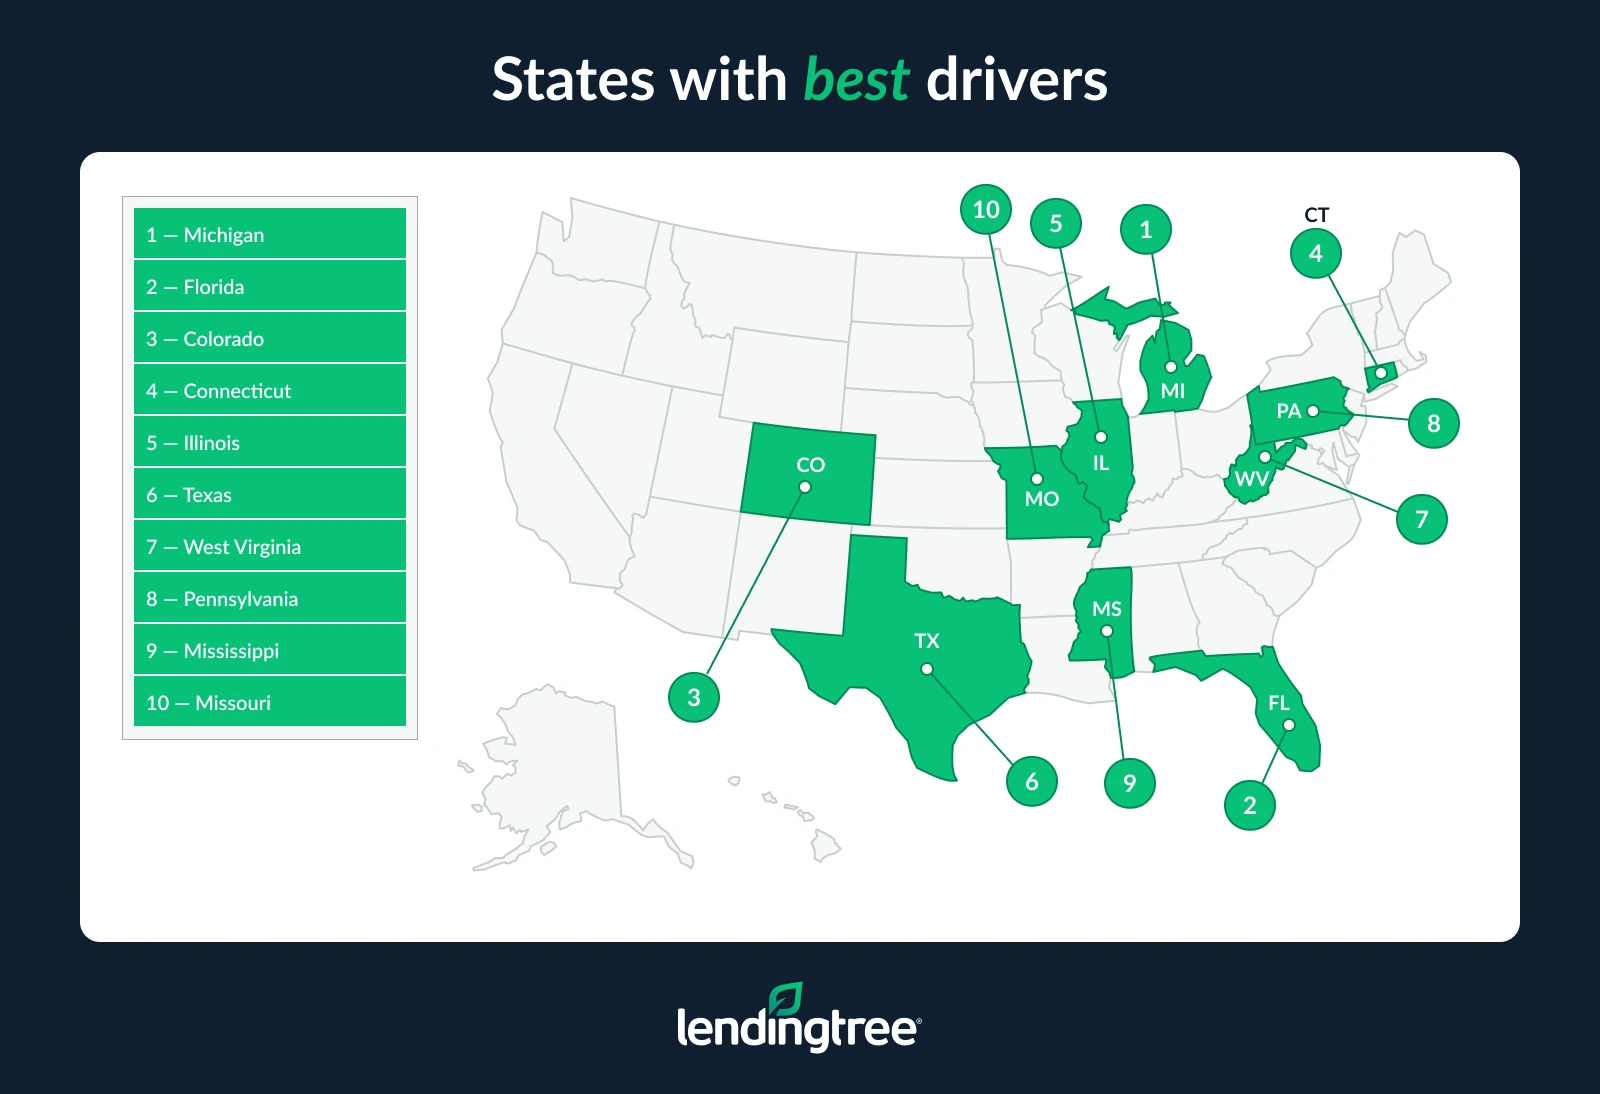
Some states have better drivers than others. According to LendingTree research, North Dakota has the worst drivers in the U.S., while Michigan has the best. Read on for more on our findings, plus tips on utilizing auto insurance to protect yourself against bad drivers, no matter the state in which you live.
Key findings
- North Dakota has the worst drivers in the U.S. In 2025 through September, North Dakota drivers had 64.0 incidents (including accidents, DUIs, speeding and citations) per 1,000 drivers. The next worst drivers are in New Jersey (58.8) and Utah (54.6).
- The best drivers in the U.S. are in Michigan. At just 20.9 incidents per 1,000 drivers, Michigan has the lowest rate. Florida (23.1) and Colorado (23.7) follow.
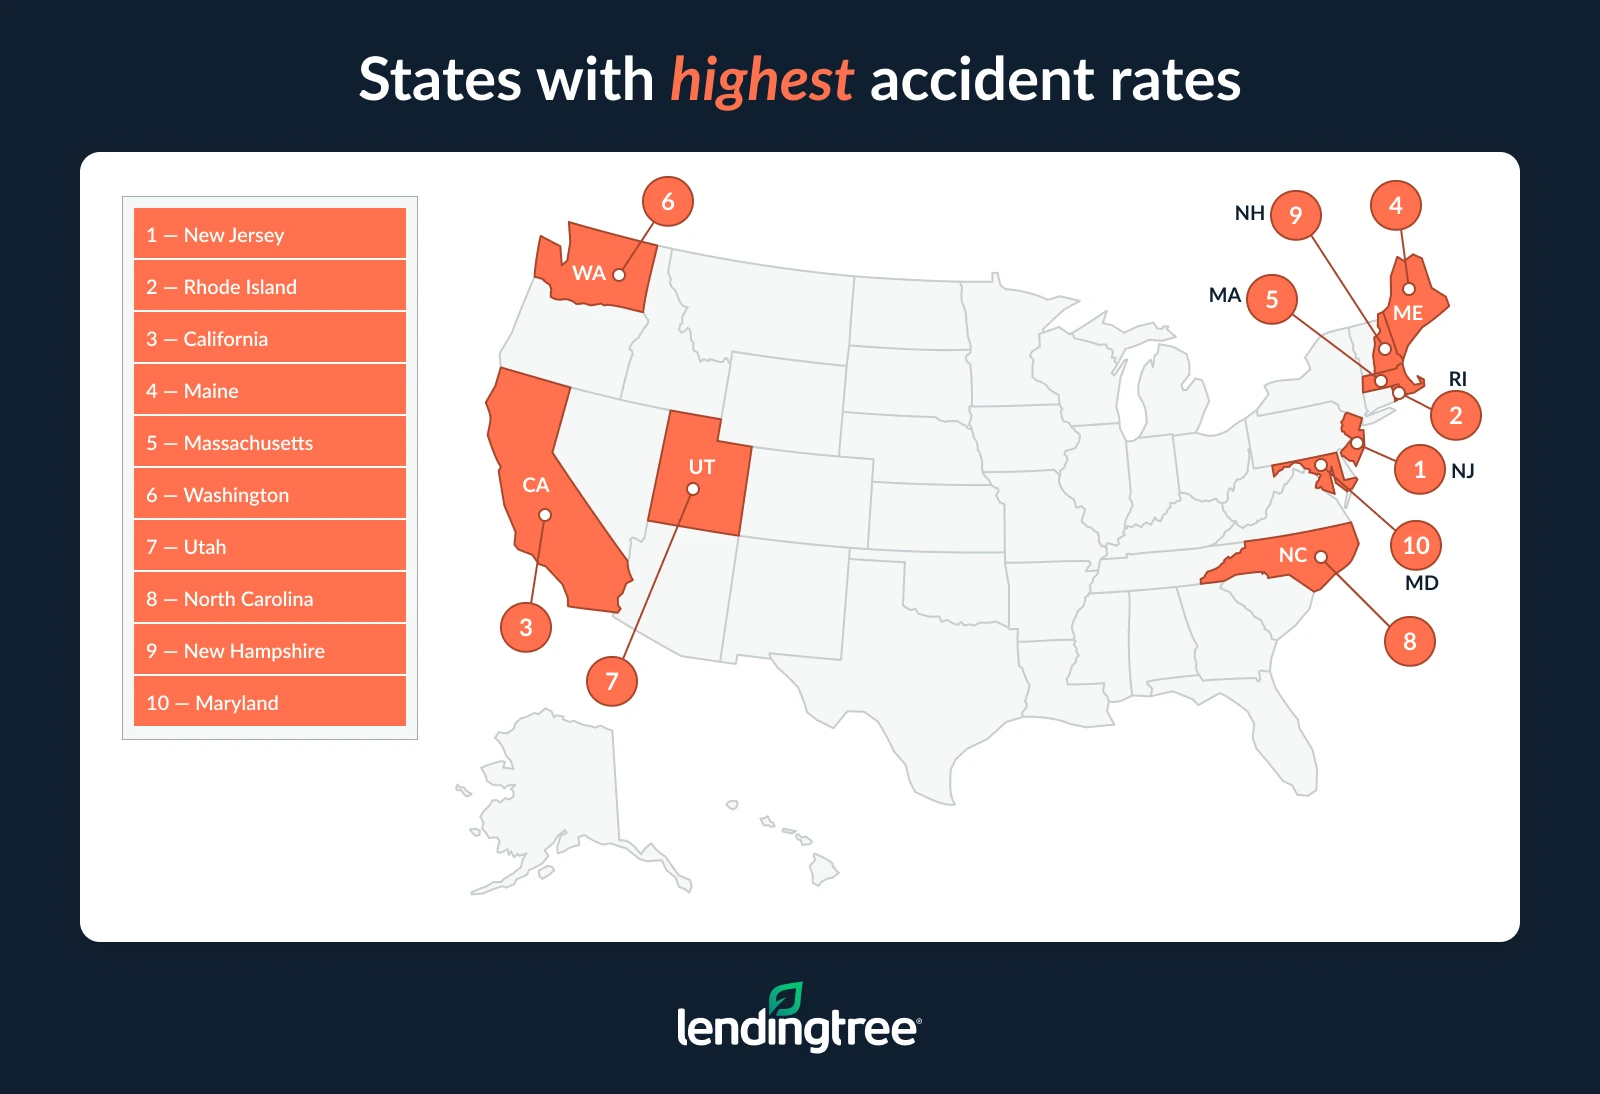
- New Jersey has the highest accident rate. In our analyzed period, New Jersey drivers had 31.5 accidents per 1,000 drivers, making it the only state above 30.0. The next highest rates are in Rhode Island (29.0) and California (28.1). Meanwhile, Michigan (10.0) has the lowest rate, below Colorado (11.7) and Florida (11.9).
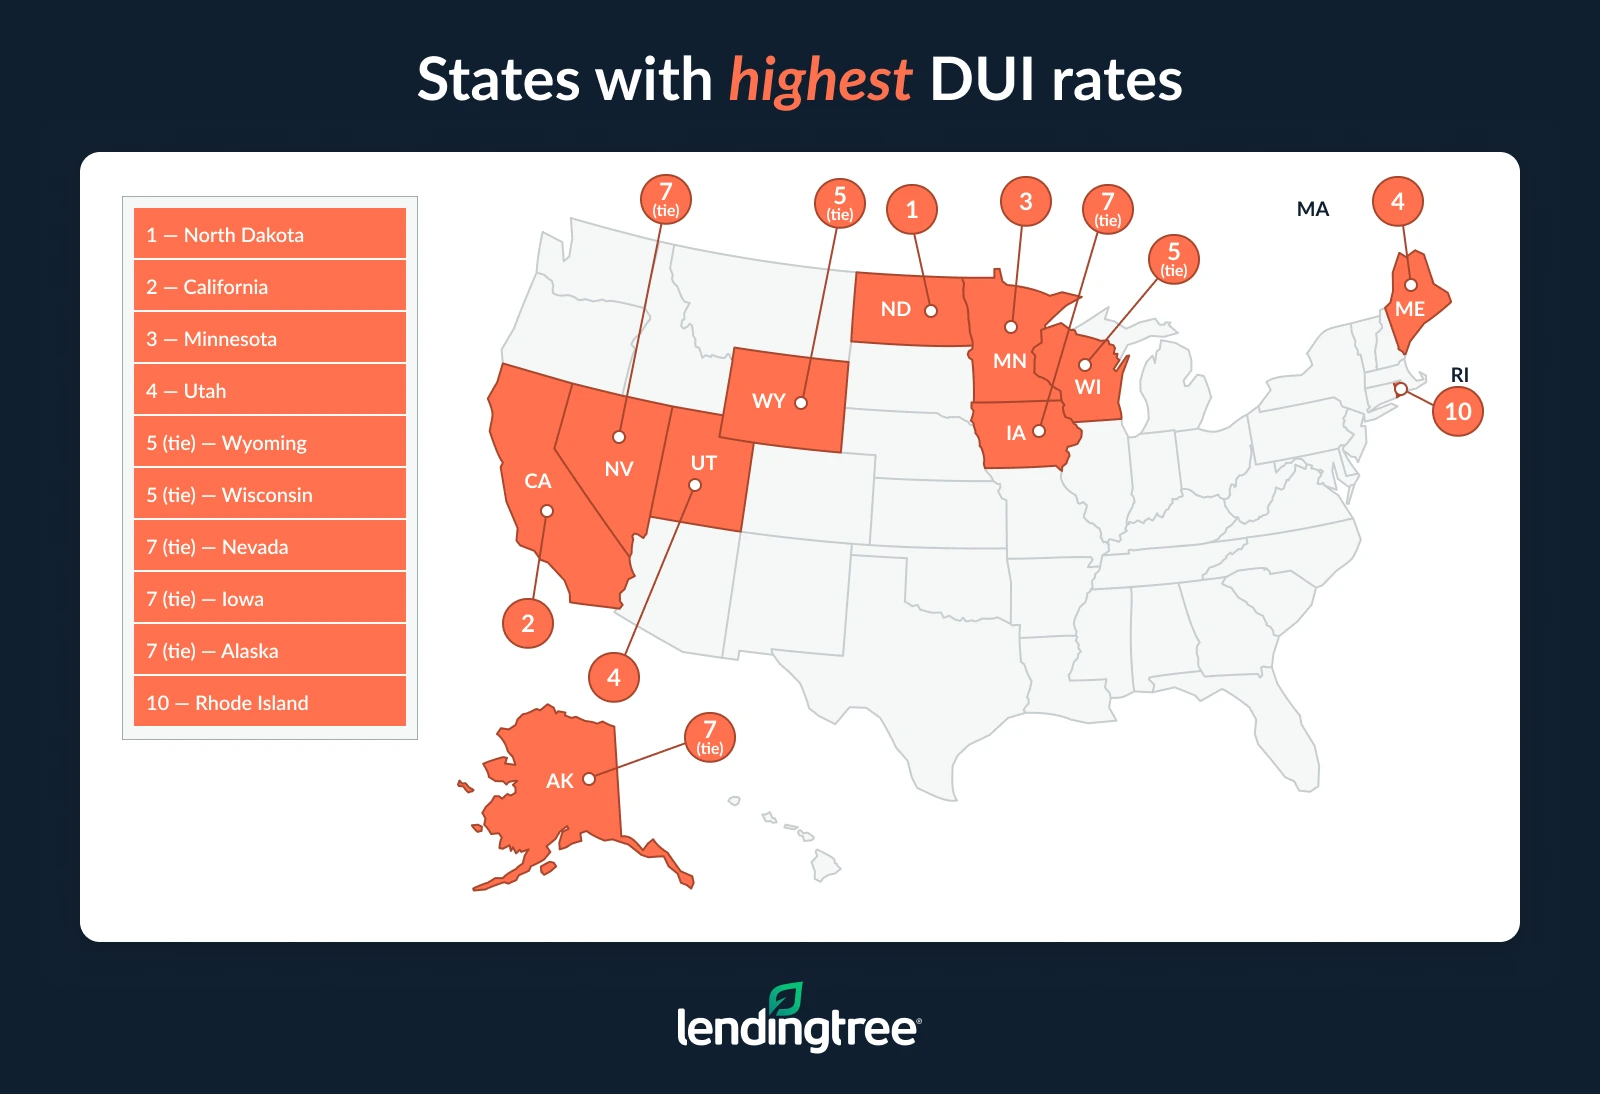
- North Dakota has the highest DUI rate. In 2025, North Dakota drivers recorded 3.7 DUIs per 1,000 drivers, the most of any state. The next highest rates are in California (3.5) and Minnesota (2.8). Conversely, nine states have rates below 1.0, with Florida (0.4) at the bottom. Illinois, Mississippi and West Virginia tie for the next lowest, at 0.6.
- North Dakota also has the highest speeding-related incident rate. Through September, North Dakota drivers had 11.9 speeding-related incidents per 1,000 drivers, making it the only state above 10.0. The next highest rates are in Utah (9.4) and Vermont (7.7). Five states have speeding-related incident rates below 1.0, led by New Jersey (0.2), Massachusetts (0.3) and New York (0.4).
North Dakota has worst drivers
By state, North Dakota has the worst drivers in the U.S. North Dakota drivers had 64.0 incidents (accidents, DUIs, speeding and citations) per 1,000 drivers in 2025 through September. Most notably, North Dakota has both the highest DUI rates and speeding-related incident rates (more on that below).
New Jersey ranks next, at 58.8 incidents per 1,000 drivers. It also has the highest accident rate per state. Rounding out the top three is Utah (54.6).
Conversely, Michigan has the best drivers, with just 20.9 incidents per 1,000 drivers. It has the lowest accident rate as well. Florida (23.1) and Colorado (23.7) have the next best drivers.
Full rankings: States with worst/best drivers
| Rank | State | Driving incidents per 1,000 drivers |
|---|---|---|
| 1 | North Dakota | 64.0 |
| 2 | New Jersey | 58.8 |
| 3 | Utah | 54.6 |
| 4 | Rhode Island | 52.2 |
| 5 | Washington | 44.9 |
| 6 | Maine | 44.1 |
| 7 | Idaho | 43.4 |
| 8 | District of Columbia | 42.2 |
| 9 | California | 41.9 |
| 10 | Montana | 40.3 |
| 11 | North Carolina | 39.9 |
| 12 | Wyoming | 39.6 |
| 13 | Virginia | 39.4 |
| 14 | Vermont | 39.2 |
| 15 | Kansas | 38.7 |
| 16 | Oregon | 38.6 |
| 17 | Wisconsin | 38.0 |
| 18 | Maryland | 37.4 |
| 18 | Massachusetts | 37.4 |
| 20 | South Dakota | 36.9 |
| 21 | Nebraska | 36.1 |
| 21 | New Hampshire | 36.1 |
| 23 | Ohio | 36.0 |
| 24 | South Carolina | 35.9 |
| 25 | Iowa | 35.8 |
| 26 | Alaska | 35.5 |
| 27 | Nevada | 33.8 |
| 28 | Tennessee | 33.7 |
| 29 | Indiana | 33.2 |
| 30 | Louisiana | 32.9 |
| 31 | Delaware | 31.9 |
| 32 | Minnesota | 31.8 |
| 33 | New Mexico | 31.1 |
| 34 | Alabama | 30.7 |
| 34 | New York | 30.7 |
| 36 | Georgia | 30.6 |
| 37 | Oklahoma | 29.9 |
| 38 | Hawaii | 29.4 |
| 39 | Arkansas | 29.3 |
| 40 | Kentucky | 28.0 |
| 41 | Arizona | 27.8 |
| 42 | Missouri | 26.9 |
| 43 | Mississippi | 26.6 |
| 44 | Pennsylvania | 26.5 |
| 45 | West Virginia | 26.0 |
| 46 | Texas | 25.8 |
| 47 | Illinois | 24.9 |
| 48 | Connecticut | 24.1 |
| 49 | Colorado | 23.7 |
| 50 | Florida | 23.1 |
| 51 | Michigan | 20.9 |
New Jersey has highest accident rate
By incident type, New Jersey has the highest accident rate. Here, there are 31.5 accidents per 1,000 drivers — the only state above 30.0. Rhode Island (29.0) and California (28.1) follow.
According to LendingTree auto insurance expert and licensed insurance agent Rob Bhatt, there are a few factors at play.
“Excessive speeds, impairment and distractions are among the most common factors in traffic accidents,” he says. “Eliminating all three of these behaviors when you drive is a good start. Avoiding these behaviors allows you to maintain situational awareness of your driving environment, including the presence of law enforcement officers who may be looking for speeders.”
Conversely, Michigan has the lowest rate of accidents, at 10.0. Colorado (11.7) and Florida (11.9) follow.
Full rankings: States with highest/lowest accident rates
| Rank | State | Accidents per 1,000 drivers |
|---|---|---|
| 1 | New Jersey | 31.5 |
| 2 | Rhode Island | 29.0 |
| 3 | California | 28.1 |
| 4 | Maine | 25.5 |
| 5 | Massachusetts | 25.4 |
| 6 | Washington | 24.8 |
| 7 | Utah | 23.8 |
| 8 | North Carolina | 22.1 |
| 9 | New Hampshire | 21.4 |
| 10 | Maryland | 20.7 |
| 11 | Nevada | 20.4 |
| 12 | North Dakota | 20.1 |
| 12 | Montana | 20.1 |
| 12 | Idaho | 20.1 |
| 15 | District of Columbia | 20.0 |
| 16 | Vermont | 19.8 |
| 17 | Indiana | 19.2 |
| 18 | Kansas | 18.7 |
| 18 | Nebraska | 18.7 |
| 20 | Oregon | 18.3 |
| 21 | New York | 18.2 |
| 22 | Louisiana | 17.9 |
| 23 | Wisconsin | 17.6 |
| 23 | Tennessee | 17.6 |
| 25 | Wyoming | 16.9 |
| 25 | Ohio | 16.9 |
| 27 | Virginia | 16.8 |
| 28 | South Carolina | 16.7 |
| 29 | Hawaii | 15.8 |
| 30 | Alabama | 15.7 |
| 31 | Alaska | 15.4 |
| 32 | South Dakota | 15.3 |
| 33 | Texas | 15.2 |
| 33 | Iowa | 15.2 |
| 35 | Oklahoma | 15.1 |
| 35 | Georgia | 15.1 |
| 35 | Kentucky | 15.1 |
| 38 | Connecticut | 15.0 |
| 38 | New Mexico | 15.0 |
| 40 | Arizona | 14.8 |
| 41 | Pennsylvania | 14.7 |
| 42 | Delaware | 14.3 |
| 43 | Missouri | 14.2 |
| 44 | Illinois | 13.9 |
| 45 | Arkansas | 13.8 |
| 46 | West Virginia | 13.5 |
| 47 | Minnesota | 13.3 |
| 48 | Mississippi | 12.8 |
| 49 | Florida | 11.9 |
| 50 | Colorado | 11.7 |
| 51 | Michigan | 10.0 |
North Dakota drivers have 3.7 DUIs per 1,000 drivers
When it comes to impaired driving, North Dakota has the highest DUI rate, at 3.7 DUIs per 1,000 drivers. California (3.5) and Minnesota (2.8) follow.
Bhatt says that’s significant. “The financial consequences of a DUI are severe,” he says. “In addition to fines and reinstatement fees for your license and registration, you may have to hire a lawyer to defend you in court. A DUI usually also makes your car insurance rates go up by nearly double for a few years or longer.”
Some good news: Nine states have rates below 1.0. Florida (0.4) has the lowest rate, with Illinois, Mississippi and West Virginia tying for the next lowest, at 0.6. The other states with DUI rates below 1.0 are:
- Colorado (0.7)
- Missouri (0.7)
- Alabama (0.7)
- South Carolina (0.8)
- Delaware (0.9)
Full rankings: States with highest/lowest DUI rates
| Rank | State | DUIs per 1,000 drivers |
|---|---|---|
| 1 | North Dakota | 3.7 |
| 2 | California | 3.5 |
| 3 | Minnesota | 2.8 |
| 4 | Utah | 2.7 |
| 5 | Wyoming | 2.5 |
| 5 | Wisconsin | 2.5 |
| 7 | Nevada | 2.4 |
| 7 | Iowa | 2.4 |
| 7 | Alaska | 2.4 |
| 10 | Rhode Island | 2.2 |
| 11 | New Jersey | 2.0 |
| 12 | Nebraska | 1.9 |
| 12 | South Dakota | 1.9 |
| 14 | Idaho | 1.8 |
| 14 | Indiana | 1.8 |
| 14 | New Mexico | 1.8 |
| 17 | Montana | 1.7 |
| 18 | Michigan | 1.6 |
| 18 | Washington | 1.6 |
| 18 | New Hampshire | 1.6 |
| 18 | Maryland | 1.6 |
| 18 | North Carolina | 1.6 |
| 23 | Virginia | 1.5 |
| 23 | Arizona | 1.5 |
| 25 | Tennessee | 1.4 |
| 25 | Ohio | 1.4 |
| 25 | New York | 1.4 |
| 25 | Connecticut | 1.4 |
| 25 | Kansas | 1.4 |
| 30 | Pennsylvania | 1.3 |
| 30 | Kentucky | 1.3 |
| 30 | Maine | 1.3 |
| 33 | District of Columbia | 1.2 |
| 33 | Hawaii | 1.2 |
| 35 | Louisiana | 1.1 |
| 36 | Arkansas | 1.0 |
| 36 | Oklahoma | 1.0 |
| 36 | Georgia | 1.0 |
| 36 | Texas | 1.0 |
| 36 | Vermont | 1.0 |
| 36 | Massachusetts | 1.0 |
| 36 | Oregon | 1.0 |
| 43 | Delaware | 0.9 |
| 44 | South Carolina | 0.8 |
| 45 | Alabama | 0.7 |
| 45 | Missouri | 0.7 |
| 45 | Colorado | 0.7 |
| 48 | West Virginia | 0.6 |
| 48 | Mississippi | 0.6 |
| 48 | Illinois | 0.6 |
| 51 | Florida | 0.4 |
North Dakota has highest speeding rate
Looking at speeding rates, North Dakota once again has the highest rate. Here, there are 11.9 speeding-related incidents per 1,000 drivers — the only state above 10.0.
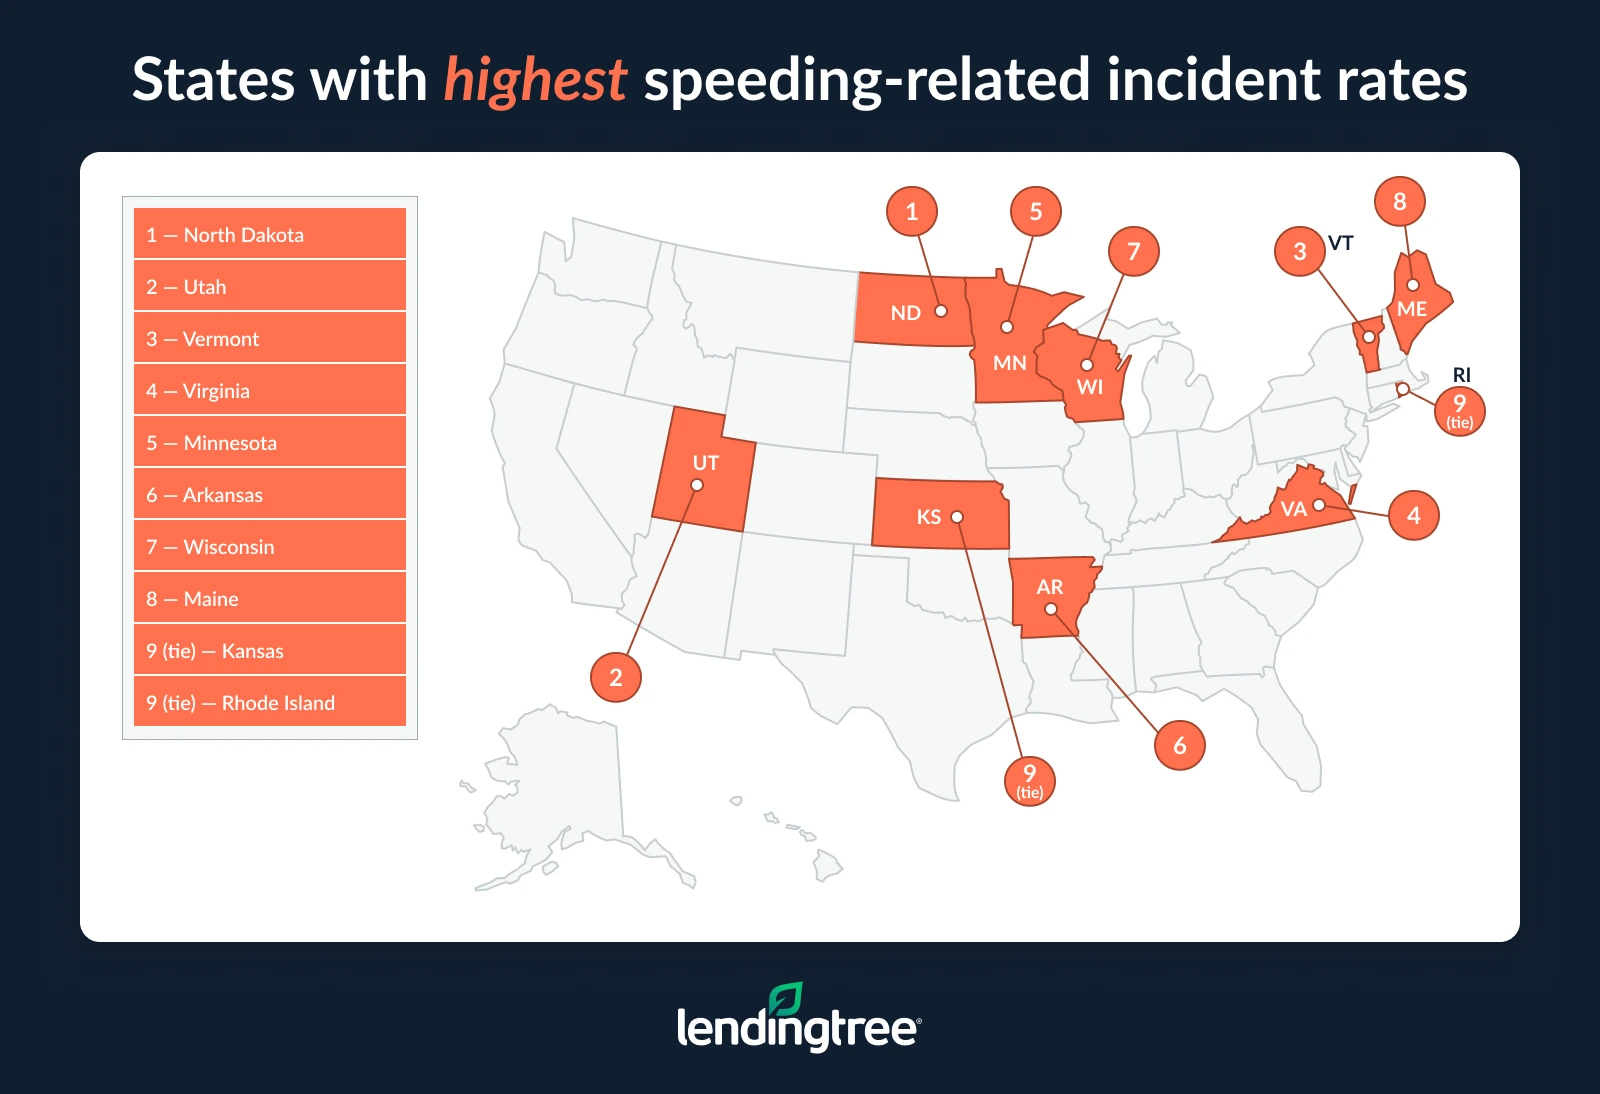
Utah (9.4) and Vermont (7.7) rank second and third, respectively.
Bhatt says there’s a reason that rural states rank highest.
“There’s a natural temptation to speed in rural areas where there’s not much traffic on the road to slow you down,” he says. “However, driving too fast creates crash risks for yourself and other drivers. It also puts you at risk of being cited.”
There’s a natural temptation to speed in rural areas where there’s not much traffic on the road to slow you down.

Meanwhile, five states have speeding-related incident rates below 1.0. New Jersey (0.2) ranks first, with Massachusetts (0.3) and New York (0.4) close behind. The District of Columbia (0.8) and California (0.9) follow.
Full rankings: States with highest/lowest speeding-related incident rates
| Rank | State | Speeding-related incidents per 1,000 drivers |
|---|---|---|
| 1 | North Dakota | 11.9 |
| 2 | Utah | 9.4 |
| 3 | Vermont | 7.7 |
| 4 | Virginia | 5.9 |
| 5 | Minnesota | 5.4 |
| 6 | Arkansas | 4.8 |
| 7 | Wisconsin | 4.6 |
| 8 | Maine | 4.4 |
| 9 | Kansas | 4.2 |
| 9 | Rhode Island | 4.2 |
| 11 | Wyoming | 3.8 |
| 11 | Oklahoma | 3.8 |
| 11 | Delaware | 3.8 |
| 14 | Montana | 3.7 |
| 15 | Alaska | 3.6 |
| 15 | South Dakota | 3.6 |
| 15 | Iowa | 3.6 |
| 18 | Alabama | 3.5 |
| 19 | Ohio | 3.3 |
| 20 | New Mexico | 3.2 |
| 20 | Arizona | 3.2 |
| 20 | New Hampshire | 3.2 |
| 23 | Georgia | 3.1 |
| 23 | Mississippi | 3.1 |
| 23 | Washington | 3.1 |
| 26 | Missouri | 3.0 |
| 26 | Oregon | 3.0 |
| 26 | Idaho | 3.0 |
| 29 | South Carolina | 2.4 |
| 29 | Pennsylvania | 2.4 |
| 29 | Kentucky | 2.4 |
| 32 | Louisiana | 2.3 |
| 32 | Nebraska | 2.3 |
| 32 | Tennessee | 2.3 |
| 32 | Indiana | 2.3 |
| 32 | West Virginia | 2.3 |
| 37 | North Carolina | 2.2 |
| 38 | Maryland | 2.0 |
| 38 | Hawaii | 2.0 |
| 40 | Michigan | 1.9 |
| 41 | Colorado | 1.8 |
| 42 | Texas | 1.7 |
| 43 | Connecticut | 1.5 |
| 44 | Illinois | 1.4 |
| 45 | Nevada | 1.3 |
| 46 | Florida | 1.2 |
| 47 | California | 0.9 |
| 48 | District of Columbia | 0.8 |
| 49 | New York | 0.4 |
| 50 | Massachusetts | 0.3 |
| 51 | New Jersey | 0.2 |
Defending against dangerous drivers: Top insurance tips
You can never be too careful on the road. Whether you live in a state with good drivers or bad ones, here are some tips to keep in mind when it comes to your insurance:
- Remember that accidents can happen anywhere, even in states with low incident rates. “No one wants to overpay for insurance, but you shouldn’t skimp, either,” Bhatt says. “If you want to save money, it’s better to increase your deductibles than reduce your coverage. Shopping around for the best rate from time to time never hurts, either.”
- Consider uninsured motorist coverage. “Unfortunately, too many people are driving without insurance,” he says. “Uninsured motorist coverage is required in about 20 states, and it’s an optional add-on in most others. It covers your medical expenses if you’re injured in an accident caused by a driver without insurance. You can usually also get uninsured motorist coverage for car damage. It’s not very expensive, and it can be extremely valuable if you ever need it.”
- Don’t underestimate the peace of mind coverage can provide. “If you’re laid up after an accident caused by an uninsured driver, just knowing that your insurance is going to cover your medical bills can make it a lot easier for you to focus on your recovery,” he says.
Methodology
Researchers analyzed tens of millions of QuoteWizard by LendingTree auto insurance inquiries from Jan. 1 through Sept. 30, 2025.
To determine the best and worst drivers by state, researchers calculated the number of driving incidents per 1,000 drivers in every state based on the residences listed on those insurance inquiries. This main category included accidents, DUIs, speeding-related incidents and general citations.
We looked at the four categories combined and evaluated accidents, DUIs and speeding-related incidents individually. Our individual analyses don’t add to the driving incident total because of drivers with multiple incidents.
The categories that fell under general citations included:
- Carelessness or recklessness
- Improper lane usage, improper passing and improper turning
- No insurance or no license to operate a vehicle, or misrepresenting a license
- Failure to yield to a car or pedestrian
- Safety violations, following another vehicle closely and passing a bus
- Not signaling
- Hit-and-runs involving a bicycle or pedestrian
- Having defective equipment or using the wrong road
- Comprehensive or other citations