Charging Deserts: Toughest States for Electric Vehicle Ownership
Owning an electric vehicle (EV) is supposed to be a step into the future. But many believe the U.S. is stuck in the past, with a lack of EV infrastructure a common pain point.
The latest LendingTree study examines charging ports, laws and incentives, adoption rates and registration changes to find the states with the worst EV infrastructure.
Additionally, we surveyed 2,000 U.S. consumers to determine what’s holding some of them back from going electric, with 26% blaming poor infrastructure as a hurdle.
Here’s what else we found.
Key findings
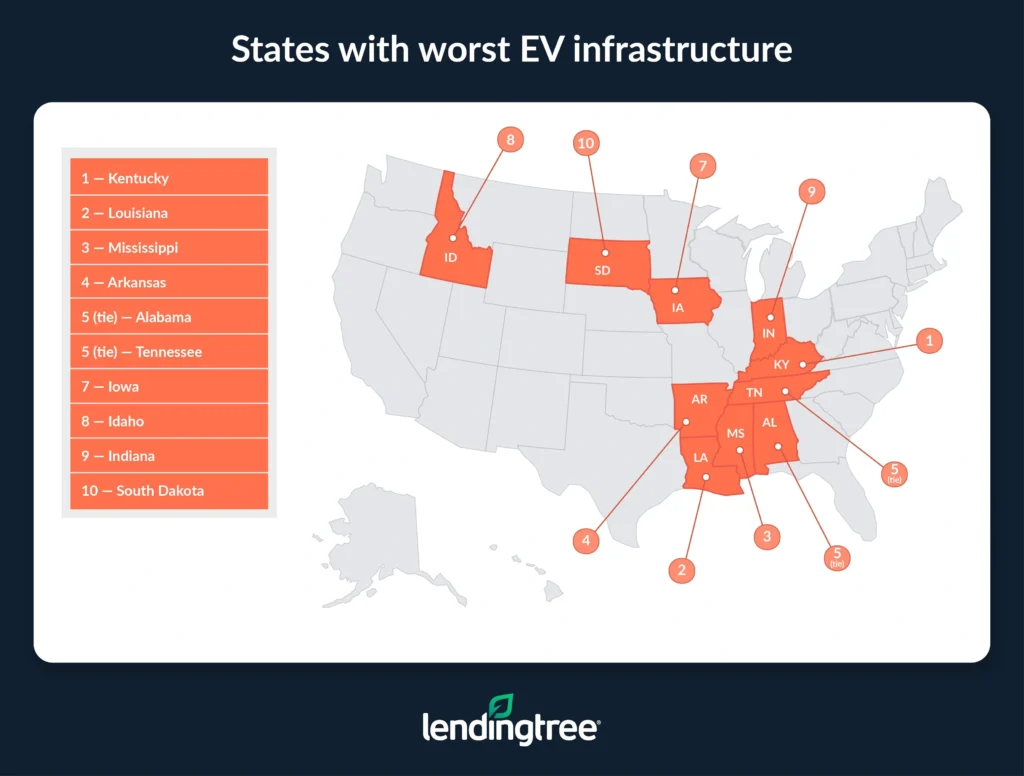
- Kentucky has the worst electric vehicle infrastructure. The state is among the bottom nine in three categories (charging ports, laws and incentives, and adoption rate). Overall, Louisiana and Mississippi follow. Meanwhile, Vermont has the best EV infrastructure. It finishes in the top six in the same three categories in which Kentucky is in the bottom nine (charging ports, laws and incentives and adoption rate). The District of Columbia and Massachusetts follow.
- Individually, Mississippi has the lowest EV adoption rate. Only 1.2% of light-duty vehicle registrations in Mississippi are for EVs, the lowest by state and well below the national average of 4.3%. North Dakota (1.3%) and Louisiana (1.4%) follow. Mississippi also has the lowest EV charging port rate — at 1.7 per 10,000 vehicles, it’s the only state below 2.0. Louisiana (2.0) and Kentucky (2.4) follow.
- The District of Columbia saw the lowest year-over-year growth in EV registrations. Despite EV registrations jumping 13.7% from 26,300 in 2022 to 29,900 in 2023, that was the lowest increase across the U.S. (Amid this, the nation’s capital has the highest EV adoption rate at 9.6%.) Following behind with the next-lowest growth in EV registrations were South Dakota (19.2%) and Hawaii (19.5%).
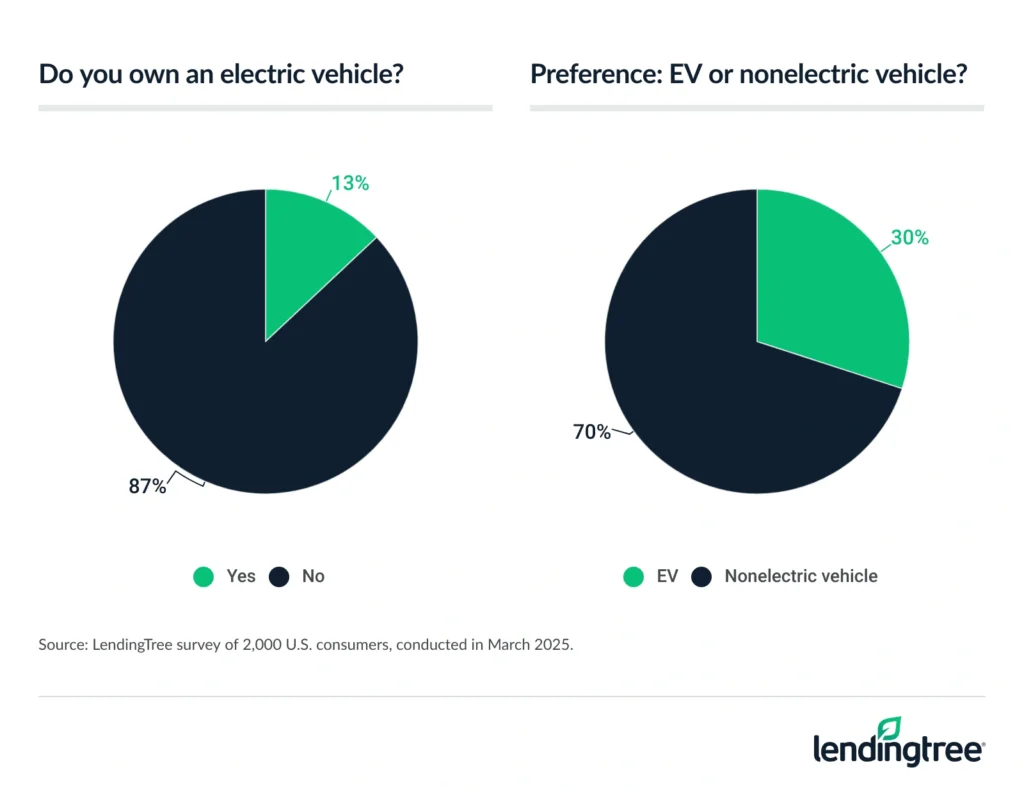
- Inadequate infrastructure is impacting the willingness to purchase an EV. While just 13% of Americans own an electric vehicle, 30% would prefer to own one over a nonelectric vehicle. However, 26% are less inclined to purchase one due to the infrastructure in their area, and 22% say they or someone they know has been directly impacted by inadequate EV infrastructure. Additionally, 44% say improvements to EV infrastructure would make them more likely to consider purchasing one.
- Some look to the White House for expanded infrastructure. Almost two-thirds (65%) of Americans say the previous administration didn’t do enough to effectively address EV infrastructure expansion. When asked what the current administration should do, 40% said expand infrastructure, while 30% said reduce it.
Kentucky has worst EV infrastructure
By state, Kentucky has the worst EV infrastructure. It has the third-lowest EV charging port rate at 2.4 per 10,000 vehicles. (Across the U.S., the average is 7.0.) It also ties for eighth-lowest for laws and incentives such as tax credits at 0.5 per 100,000 vehicles (compared to a national rate of 0.9). Finally, it has the ninth-lowest EV adoption rate at 2.1% (compared to a national rate of 4.3%).
Overall, Louisiana follows. It has the second-lowest EV charging port rate (2.0), the third-lowest EV adoption rate (1.4%) and ties for 10th-lowest for its EV laws and incentives rate (0.6). Mississippi ranks third, with the lowest EV charging port rate (1.7) and the lowest EV adoption rate (1.2%). However, it’s in the middle (25th) for its EV laws and incentives rate at 1.0, tying with Oklahoma.
LendingTree auto insurance expert and licensed insurance agent Rob Bhatt says poor infrastructure in these states is primarily due to political alignments.
“We generally see more EV infrastructure and higher adoption rates in areas with greater environmental concerns,” he says. “It starts with voters choosing leaders who support eco-friendly policies like EV incentives and developing EV infrastructure. We just haven’t seen widespread interest in these issues from voters or policymakers in places like Kentucky, Louisiana and Mississippi.”
Conversely, Vermont has the best electric vehicle infrastructure. In the three categories in which Kentucky does poorly, Vermont excels. It has the second-highest EV charging port rate (19.4), second-highest EV laws and incentives rate (12.5) and sixth-highest EV adoption rate (5.7%).
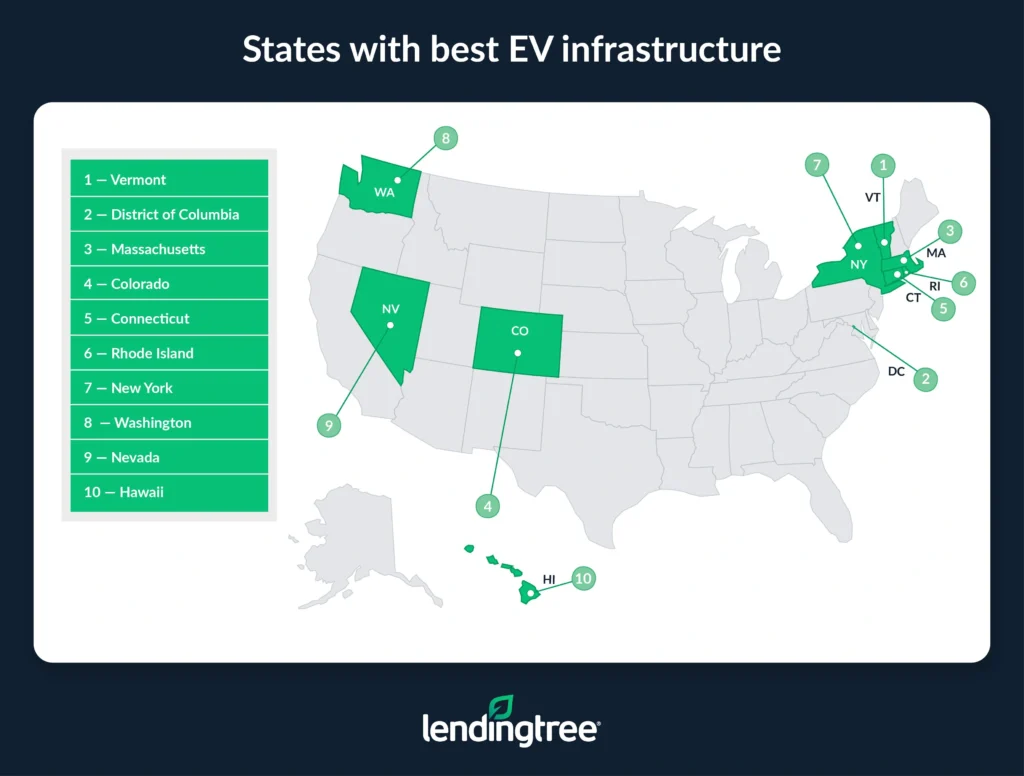
The District of Columbia follows, with the highest EV charging port rate (34.7), laws and incentives rate (15.1) and EV adoption rate (9.6%). However, it ranks last for its year-over-year change in EV registrations, which affects its overall ranking (more on that later).
Massachusetts follows. It has the third-highest EV charging port rate (15.7) and seventh-highest EV adoption rate (5.6%), though it ties for 14th for its year-over-year change in EV registrations (27.8%, compared with a national average increase of 25.7%) and has the 17th-highest laws and incentives rate (1.6).
Full rankings: States with worst/best electric vehicle infrastructure
| Rank | State | Charging ports per 10,000 vehicles | Adoption rate | Laws, incentives per 100,000 vehicles | % change in registrations |
|---|---|---|---|---|---|
| 1 | Kentucky | 2.4 | 2.1% | 0.5 | 24.3% |
| 2 | Louisiana | 2.0 | 1.4% | 0.6 | 30.3% |
| 3 | Mississippi | 1.7 | 1.2% | 1.0 | 28.5% |
| 4 | Arkansas | 3.4 | 1.7% | 0.8 | 23.8% |
| 5 | Alabama | 2.9 | 1.7% | 0.6 | 28.5% |
| 5 | Tennessee | 3.7 | 2.4% | 0.2 | 26.1% |
| 7 | Iowa | 3.3 | 2.3% | 0.9 | 21.1% |
| 8 | Idaho | 2.7 | 2.9% | 0.6 | 23.7% |
| 9 | Indiana | 2.9 | 2.6% | 0.9 | 22.8% |
| 10 | South Dakota | 3.5 | 1.6% | 1.9 | 19.2% |
| 11 | Nebraska | 3.1 | 2.2% | 1.3 | 24.4% |
| 12 | Kansas | 4.5 | 2.6% | 0.6 | 21.5% |
| 13 | Ohio | 4.2 | 2.7% | 0.2 | 26.0% |
| 13 | West Virginia | 3.2 | 1.8% | 1.4 | 25.0% |
| 15 | North Dakota | 2.7 | 1.3% | 2.0 | 28.2% |
| 16 | Wisconsin | 3.2 | 2.9% | 0.9 | 23.0% |
| 17 | Alaska | 2.8 | 2.5% | 2.9 | 21.4% |
| 18 | South Carolina | 3.3 | 2.2% | 0.8 | 29.9% |
| 19 | Missouri | 5.2 | 2.7% | 0.4 | 25.4% |
| 20 | Texas | 4.2 | 2.8% | 0.2 | 32.0% |
| 21 | Illinois | 4.1 | 4.2% | 0.5 | 24.3% |
| 21 | Michigan | 4.5 | 2.7% | 0.7 | 26.2% |
| 21 | Wyoming | 4.2 | 1.6% | 2.6 | 24.1% |
| 24 | Oklahoma | 3.6 | 2.6% | 1.0 | 50.0% |
| 25 | Pennsylvania | 4.9 | 3.5% | 0.4 | 30.1% |
| 26 | Georgia | 6.2 | 3.0% | 0.3 | 28.8% |
| 27 | North Carolina | 5.4 | 3.4% | 0.6 | 27.0% |
| 28 | New Mexico | 4.3 | 3.0% | 2.5 | 22.4% |
| 29 | Montana | 4.1 | 2.8% | 2.3 | 27.6% |
| 30 | Florida | 6.1 | 3.9% | 0.3 | 31.5% |
| 31 | Minnesota | 4.7 | 3.5% | 1.3 | 25.6% |
| 32 | Arizona | 6.2 | 4.5% | 0.8 | 22.8% |
| 33 | Virginia | 6.4 | 4.4% | 0.9 | 23.3% |
| 34 | New Hampshire | 5.1 | 3.9% | 2.5 | 24.2% |
| 35 | California | 13.9 | 9.1% | 0.8 | 21.3% |
| 36 | Maine | 10.0 | 3.9% | 3.3 | 22.7% |
| 36 | Utah | 8.4 | 4.4% | 1.5 | 26.7% |
| 38 | New Jersey | 6.2 | 4.8% | 1.1 | 36.5% |
| 39 | Maryland | 8.5 | 5.4% | 1.3 | 26.4% |
| 40 | Delaware | 7.2 | 3.8% | 4.3 | 26.7% |
| 41 | Oregon | 9.4 | 6.5% | 2.0 | 20.0% |
| 42 | Hawaii | 7.6 | 6.4% | 3.7 | 19.5% |
| 43 | Nevada | 9.2 | 5.0% | 1.4 | 26.6% |
| 44 | Washington | 9.8 | 7.3% | 1.4 | 23.4% |
| 45 | New York | 14.1 | 4.7% | 0.8 | 33.0% |
| 46 | Rhode Island | 9.3 | 3.8% | 4.6 | 27.8% |
| 47 | Connecticut | 12.1 | 4.3% | 2.7 | 25.8% |
| 48 | Colorado | 10.7 | 5.2% | 1.8 | 29.9% |
| 49 | Massachusetts | 15.7 | 5.6% | 1.6 | 27.8% |
| 50 | District of Columbia | 34.7 | 9.6% | 15.1 | 13.7% |
| 51 | Vermont | 19.4 | 5.7% | 12.5 | 23.8% |
Mississippi residents least likely to own EV
Looking at each metric, Mississippi has the lowest EV adoption rate. Of light-duty vehicle registrations in the state, only 1.2% are for EVs. Comparatively, the national adoption rate is 4.3%. Mississippi’s low adoption rate likely goes hand-in-hand with its low rate of EV charging ports — more on that below.
North Dakota (1.3%) and Louisiana (1.4%) have the next lowest adoption rates. Both states also finish in the bottom five for lowest EV charging port rates, likely affecting their adoption rates.
Despite having among the lowest adoption rates, North Dakota offers the lowest at-home EV charging costs.
States with lowest EV adoption rates
| Rank | State | EV registrations | Light-duty registrations | Adoption rate |
|---|---|---|---|---|
| 1 | Mississippi | 33,800 | 2,723,300 | 1.2% |
| 2 | North Dakota | 10,000 | 797,400 | 1.3% |
| 3 | Louisiana | 52,400 | 3,774,200 | 1.4% |
The District of Columbia (9.6%), California (9.1%) and Washington (7.3%) have the highest EV adoption rates.
Meanwhile, Mississippi has just 1.7 charging ports per 10,000 vehicles — making it the only state below 2.0. Louisiana (2.0) and Kentucky (2.4) follow. Five other states have an EV charging port rate below 3.0: Idaho (2.7), North Dakota (2.7), Alaska (2.8), Alabama (2.9) and Indiana (2.9).
States with lowest EV charging port rates
| Rank | State | Charging station locations | Charging ports | Ports per 10,000 vehicles |
|---|---|---|---|---|
| 1 | Mississippi | 181 | 470 | 1.7 |
| 2 | Louisiana | 271 | 742 | 2.0 |
| 3 | Kentucky | 344 | 964 | 2.4 |
The District of Columbia has the most charging ports, at 34.7 per 10,000 vehicles. Vermont (19.4) and Massachusetts (15.7) follow.
Following that, three states tie for the lowest EV laws and incentives rate: Texas, Ohio and Tennessee, all with just 0.2 EV laws and incentives per 100,000 vehicles. Florida and Georgia follow closely behind at 0.3.
States with lowest EV laws and incentives rates
| Rank | State | Laws and incentives | Light-duty vehicle registrations | Incentives per 100,000 vehicles |
|---|---|---|---|---|
| 1 | Texas | 55 | 25,796,600 | 0.2 |
| 1 | Ohio | 23 | 10,317,300 | 0.2 |
| 1 | Tennessee | 16 | 6,538,800 | 0.2 |
Conversely, the District of Columbia (15.1) and Vermont (12.5) are the only states above 10.0. Rhode Island (4.6) follows.
Full details: States with lowest/highest EV adoption rates
| Rank | State | EV registrations | Light-duty registrations | Adoption rate |
|---|---|---|---|---|
| 1 | Mississippi | 33,800 | 2,723,300 | 1.2% |
| 2 | North Dakota | 10,000 | 797,400 | 1.3% |
| 3 | Louisiana | 52,400 | 3,774,200 | 1.4% |
| 4 | South Dakota | 14,900 | 918,000 | 1.6% |
| 4 | Wyoming | 10,300 | 652,900 | 1.6% |
| 6 | Alabama | 82,100 | 4,835,900 | 1.7% |
| 6 | Arkansas | 47,300 | 2,708,300 | 1.7% |
| 8 | West Virginia | 27,000 | 1,510,900 | 1.8% |
| 9 | Kentucky | 84,300 | 4,039,700 | 2.1% |
| 10 | Nebraska | 43,300 | 1,971,200 | 2.2% |
| 10 | South Carolina | 113,000 | 5,042,400 | 2.2% |
| 12 | Iowa | 72,300 | 3,153,300 | 2.3% |
| 13 | Tennessee | 157,500 | 6,538,800 | 2.4% |
| 14 | Alaska | 14,200 | 559,800 | 2.5% |
| 15 | Indiana | 158,100 | 6,172,100 | 2.6% |
| 15 | Kansas | 67,300 | 2,621,100 | 2.6% |
| 15 | Oklahoma | 112,200 | 4,287,900 | 2.6% |
| 18 | Michigan | 227,500 | 8,525,400 | 2.7% |
| 18 | Missouri | 154,700 | 5,626,000 | 2.7% |
| 18 | Ohio | 274,200 | 10,317,300 | 2.7% |
| 21 | Montana | 28,200 | 1,021,700 | 2.8% |
| 21 | Texas | 730,500 | 25,796,600 | 2.8% |
| 23 | Idaho | 56,800 | 1,974,600 | 2.9% |
| 23 | Wisconsin | 161,000 | 5,529,000 | 2.9% |
| 25 | Georgia | 290,400 | 9,642,400 | 3.0% |
| 25 | New Mexico | 59,500 | 1,952,400 | 3.0% |
| 27 | North Carolina | 304,500 | 9,085,500 | 3.4% |
| 28 | Minnesota | 177,700 | 5,118,500 | 3.5% |
| 28 | Pennsylvania | 354,500 | 10,211,000 | 3.5% |
| 30 | Delaware | 35,100 | 914,700 | 3.8% |
| 30 | Rhode Island | 33,600 | 877,600 | 3.8% |
| 32 | Florida | 726,700 | 18,583,200 | 3.9% |
| 32 | Maine | 48,600 | 1,236,000 | 3.9% |
| 32 | New Hampshire | 53,300 | 1,383,700 | 3.9% |
| 35 | Illinois | 418,400 | 10,043,200 | 4.2% |
| 36 | Connecticut | 125,300 | 2,945,700 | 4.3% |
| 37 | Utah | 136,200 | 3,076,200 | 4.4% |
| 37 | Virginia | 341,100 | 7,723,500 | 4.4% |
| 39 | Arizona | 291,100 | 6,529,000 | 4.5% |
| 40 | New York | 537,600 | 11,318,600 | 4.7% |
| 41 | New Jersey | 349,900 | 7,324,100 | 4.8% |
| 42 | Nevada | 127,600 | 2,556,100 | 5.0% |
| 43 | Colorado | 280,300 | 5,441,800 | 5.2% |
| 44 | Maryland | 272,100 | 5,060,000 | 5.4% |
| 45 | Massachusetts | 304,900 | 5,491,100 | 5.6% |
| 46 | Vermont | 33,800 | 593,100 | 5.7% |
| 47 | Hawaii | 69,300 | 1,080,100 | 6.4% |
| 48 | Oregon | 250,100 | 3,832,700 | 6.5% |
| 49 | Washington | 500,500 | 6,816,100 | 7.3% |
| 50 | California | 3,370,500 | 36,850,300 | 9.1% |
| 51 | District of Columbia | 29,900 | 312,100 | 9.6% |
Full details: States with lowest/highest EV charging port rates
| Rank | State | Charging station locations | Charging ports | Ports per 10,000 vehicles |
|---|---|---|---|---|
| 1 | Mississippi | 181 | 470 | 1.7 |
| 2 | Louisiana | 271 | 742 | 2.0 |
| 3 | Kentucky | 344 | 964 | 2.4 |
| 4 | Idaho | 212 | 532 | 2.7 |
| 4 | North Dakota | 93 | 216 | 2.7 |
| 6 | Alaska | 66 | 155 | 2.8 |
| 7 | Alabama | 489 | 1,403 | 2.9 |
| 7 | Indiana | 638 | 1,815 | 2.9 |
| 9 | Nebraska | 282 | 609 | 3.1 |
| 10 | Wisconsin | 728 | 1,759 | 3.2 |
| 10 | West Virginia | 170 | 488 | 3.2 |
| 12 | South Carolina | 613 | 1,641 | 3.3 |
| 12 | Iowa | 445 | 1,034 | 3.3 |
| 14 | Arkansas | 350 | 912 | 3.4 |
| 15 | South Dakota | 116 | 319 | 3.5 |
| 16 | Oklahoma | 375 | 1,535 | 3.6 |
| 17 | Tennessee | 981 | 2,445 | 3.7 |
| 18 | Montana | 150 | 422 | 4.1 |
| 18 | Illinois | 1,499 | 4,155 | 4.1 |
| 20 | Texas | 3,730 | 10,712 | 4.2 |
| 20 | Ohio | 1,768 | 4,306 | 4.2 |
| 20 | Wyoming | 111 | 277 | 4.2 |
| 23 | New Mexico | 355 | 837 | 4.3 |
| 24 | Kansas | 544 | 1,174 | 4.5 |
| 24 | Michigan | 1,659 | 3,828 | 4.5 |
| 26 | Minnesota | 911 | 2,402 | 4.7 |
| 27 | Pennsylvania | 1,918 | 4,965 | 4.9 |
| 28 | New Hampshire | 280 | 709 | 5.1 |
| 29 | Missouri | 1,274 | 2,938 | 5.2 |
| 30 | North Carolina | 1,781 | 4,880 | 5.4 |
| 31 | Florida | 3,733 | 11,421 | 6.1 |
| 32 | Georgia | 2,155 | 5,950 | 6.2 |
| 32 | Arizona | 1,376 | 4,064 | 6.2 |
| 32 | New Jersey | 1,522 | 4,576 | 6.2 |
| 35 | Virginia | 1,780 | 4,942 | 6.4 |
| 36 | Delaware | 252 | 661 | 7.2 |
| 37 | Hawaii | 352 | 820 | 7.6 |
| 38 | Utah | 922 | 2,594 | 8.4 |
| 39 | Maryland | 1,545 | 4,299 | 8.5 |
| 40 | Nevada | 638 | 2,347 | 9.2 |
| 41 | Rhode Island | 337 | 813 | 9.3 |
| 42 | Oregon | 1,470 | 3,598 | 9.4 |
| 43 | Washington | 2,494 | 6,695 | 9.8 |
| 44 | Maine | 535 | 1,233 | 10.0 |
| 45 | Colorado | 2,365 | 5,811 | 10.7 |
| 46 | Connecticut | 1,233 | 3,576 | 12.1 |
| 47 | California | 17,163 | 51,204 | 13.9 |
| 48 | New York | 4,592 | 15,954 | 14.1 |
| 49 | Massachusetts | 3,555 | 8,595 | 15.7 |
| 50 | Vermont | 457 | 1,150 | 19.4 |
| 51 | District of Columbia | 329 | 1,083 | 34.7 |
Full details: States with lowest/highest EV laws and incentives rates
| Rank | State | Laws and incentives | Light-duty vehicle registrations | Incentives per 100,000 vehicles |
|---|---|---|---|---|
| 1 | Texas | 55 | 25,796,600 | 0.2 |
| 1 | Ohio | 23 | 10,317,300 | 0.2 |
| 1 | Tennessee | 16 | 6,538,800 | 0.2 |
| 4 | Florida | 54 | 18,583,200 | 0.3 |
| 4 | Georgia | 33 | 9,642,400 | 0.3 |
| 6 | Missouri | 24 | 5,626,000 | 0.4 |
| 6 | Pennsylvania | 45 | 10,211,000 | 0.4 |
| 8 | Illinois | 54 | 10,043,200 | 0.5 |
| 8 | Kentucky | 22 | 4,039,700 | 0.5 |
| 10 | Alabama | 28 | 4,835,900 | 0.6 |
| 10 | Idaho | 12 | 1,974,600 | 0.6 |
| 10 | Louisiana | 23 | 3,774,200 | 0.6 |
| 10 | Kansas | 16 | 2,621,100 | 0.6 |
| 10 | North Carolina | 59 | 9,085,500 | 0.6 |
| 15 | Michigan | 61 | 8,525,400 | 0.7 |
| 16 | California | 281 | 36,850,300 | 0.8 |
| 16 | Arizona | 53 | 6,529,000 | 0.8 |
| 16 | Arkansas | 22 | 2,708,300 | 0.8 |
| 16 | South Carolina | 42 | 5,042,400 | 0.8 |
| 16 | New York | 96 | 11,318,600 | 0.8 |
| 21 | Indiana | 53 | 6,172,100 | 0.9 |
| 21 | Iowa | 29 | 3,153,300 | 0.9 |
| 21 | Wisconsin | 51 | 5,529,000 | 0.9 |
| 21 | Virginia | 72 | 7,723,500 | 0.9 |
| 25 | Mississippi | 26 | 2,723,300 | 1.0 |
| 25 | Oklahoma | 42 | 4,287,900 | 1.0 |
| 27 | New Jersey | 79 | 7,324,100 | 1.1 |
| 28 | Minnesota | 64 | 5,118,500 | 1.3 |
| 28 | Maryland | 64 | 5,060,000 | 1.3 |
| 28 | Nebraska | 25 | 1,971,200 | 1.3 |
| 31 | Nevada | 35 | 2,556,100 | 1.4 |
| 31 | West Virginia | 21 | 1,510,900 | 1.4 |
| 31 | Washington | 95 | 6,816,100 | 1.4 |
| 34 | Utah | 47 | 3,076,200 | 1.5 |
| 35 | Massachusetts | 90 | 5,491,100 | 1.6 |
| 36 | Colorado | 98 | 5,441,800 | 1.8 |
| 37 | South Dakota | 17 | 918,000 | 1.9 |
| 38 | North Dakota | 16 | 797,400 | 2.0 |
| 38 | Oregon | 78 | 3,832,700 | 2.0 |
| 40 | Montana | 23 | 1,021,700 | 2.3 |
| 41 | New Hampshire | 34 | 1,383,700 | 2.5 |
| 41 | New Mexico | 48 | 1,952,400 | 2.5 |
| 43 | Wyoming | 17 | 652,900 | 2.6 |
| 44 | Connecticut | 80 | 2,945,700 | 2.7 |
| 45 | Alaska | 16 | 559,800 | 2.9 |
| 46 | Maine | 41 | 1,236,000 | 3.3 |
| 47 | Hawaii | 40 | 1,080,100 | 3.7 |
| 48 | Delaware | 39 | 914,700 | 4.3 |
| 49 | Rhode Island | 40 | 877,600 | 4.6 |
| 50 | Vermont | 74 | 593,100 | 12.5 |
| 51 | District of Columbia | 47 | 312,100 | 15.1 |
District of Columbia has lowest EV registration growth
Turning to EV registrations, the District of Columbia saw the lowest year-over-year growth. While D.C. has the highest EV adoption rate at 9.6%, registrations grew just 13.7% from 26,300 in 2022 to 29,900 in 2023.
EV demand may have just stalled, particularly given its high overall adoption rate. The District also has the second-highest public transportation usage among workers, according to a LendingTree study, which likely has an effect.
States with smallest percentage change in EV registrations
| Rank | State | Registrations, 2022 | Registrations, 2023 | % change in registrations |
|---|---|---|---|---|
| 1 | District of Columbia | 26,300 | 29,900 | 13.7% |
| 2 | South Dakota | 12,500 | 14,900 | 19.2% |
| 3 | Hawaii | 58,000 | 69,300 | 19.5% |
South Dakota (19.2%) had the next-smallest EV growth, with Hawaii (19.5%) in third. Like the District, Hawaii is among the top states for overall EV adoption rates, ranking fifth.
On the other hand, Oklahoma saw the biggest jump in EV registrations, rising 50.0% from 74,800 to 112,200. New Jersey (36.5%) and New York (33.0%) follow distantly.
Full rankings: States with smallest/largest percentage change in EV registrations
| Rank | State | Registrations, 2022 | Registrations, 2023 | % change in registrations |
|---|---|---|---|---|
| 1 | District of Columbia | 26,300 | 29,900 | 13.7% |
| 2 | South Dakota | 12,500 | 14,900 | 19.2% |
| 3 | Hawaii | 58,000 | 69,300 | 19.5% |
| 4 | Oregon | 208,400 | 250,100 | 20.0% |
| 5 | Iowa | 59,700 | 72,300 | 21.1% |
| 6 | California | 2,778,700 | 3,370,500 | 21.3% |
| 7 | Alaska | 11,700 | 14,200 | 21.4% |
| 8 | Kansas | 55,400 | 67,300 | 21.5% |
| 9 | New Mexico | 48,600 | 59,500 | 22.4% |
| 10 | Maine | 39,600 | 48,600 | 22.7% |
| 11 | Arizona | 237,000 | 291,100 | 22.8% |
| 11 | Indiana | 128,700 | 158,100 | 22.8% |
| 13 | Wisconsin | 130,900 | 161,000 | 23.0% |
| 14 | Virginia | 276,700 | 341,100 | 23.3% |
| 15 | Washington | 405,700 | 500,500 | 23.4% |
| 16 | Idaho | 45,900 | 56,800 | 23.7% |
| 17 | Vermont | 27,300 | 33,800 | 23.8% |
| 17 | Arkansas | 38,200 | 47,300 | 23.8% |
| 19 | Wyoming | 8300 | 10,300 | 24.1% |
| 20 | New Hampshire | 42,900 | 53,300 | 24.2% |
| 21 | Illinois | 336,700 | 418,400 | 24.3% |
| 21 | Kentucky | 67,800 | 84,300 | 24.3% |
| 23 | Nebraska | 34,800 | 43,300 | 24.4% |
| 24 | West Virginia | 21,600 | 27,000 | 25.0% |
| 25 | Missouri | 123,400 | 154,700 | 25.4% |
| 26 | Minnesota | 141,500 | 177,700 | 25.6% |
| 27 | Connecticut | 99,600 | 125,300 | 25.8% |
| 28 | Ohio | 217,600 | 274,200 | 26.0% |
| 29 | Tennessee | 124,900 | 157,500 | 26.1% |
| 30 | Michigan | 180,200 | 227,500 | 26.2% |
| 31 | Maryland | 215,200 | 272,100 | 26.4% |
| 32 | Nevada | 100,800 | 127,600 | 26.6% |
| 33 | Utah | 107,500 | 136,200 | 26.7% |
| 33 | Delaware | 27,700 | 35,100 | 26.7% |
| 35 | North Carolina | 239,700 | 304,500 | 27.0% |
| 36 | Montana | 22,100 | 28,200 | 27.6% |
| 37 | Rhode Island | 26,300 | 33,600 | 27.8% |
| 37 | Massachusetts | 238,500 | 304,900 | 27.8% |
| 39 | North Dakota | 7800 | 10,000 | 28.2% |
| 40 | Alabama | 63,900 | 82,100 | 28.5% |
| 40 | Mississippi | 26,300 | 33,800 | 28.5% |
| 42 | Georgia | 225,400 | 290,400 | 28.8% |
| 43 | South Carolina | 87,000 | 113,000 | 29.9% |
| 43 | Colorado | 215,700 | 280,300 | 29.9% |
| 45 | Pennsylvania | 272,400 | 354,500 | 30.1% |
| 46 | Louisiana | 40,200 | 52,400 | 30.3% |
| 47 | Florida | 552,500 | 726,700 | 31.5% |
| 48 | Texas | 553,600 | 730,500 | 32.0% |
| 49 | New York | 404,100 | 537,600 | 33.0% |
| 50 | New Jersey | 256,400 | 349,900 | 36.5% |
| 51 | Oklahoma | 74,800 | 112,200 | 50.0% |
Consumers want EVs but worry about infrastructure
While consumers want EVs, infrastructure concerns hold many back. In fact, just 13% of Americans own an electric vehicle — but 30% would prefer to own one over a nonelectric vehicle.
Gen Zers ages 18 to 28 (21%) are the most likely age group to own EVs, followed by millennials ages 29 to 44 (19%). Just 9% of Gen Xers ages 45 to 60 and 2% of baby boomers ages 61 to 79 say similarly. Perhaps surprisingly, Republicans (17%) are more likely to own EVs than Democrats (12%).
Younger Americans are more likely to prefer an EV over a nonelectric vehicle. Democrats (39%) are also significantly more likely to feel this way than Republicans (27%).
Regardless of their preferences, 26% of Americans are less inclined to purchase an EV due to the infrastructure in their area. And 22% say they or someone they know has been directly impacted by inadequate EV infrastructure. With that in mind, 44% say improvements to EV infrastructure would make them more likely to consider purchasing one.
“We’re likely to see continuing interest in EVs in states that maintain and expand EV ownership incentives and develop better EV infrastructure,” Bhatt says. “We’re probably less likely to see an increase in EV adoption in areas that don’t have EV infrastructure or incentives.”
Americans believe government should address EV infrastructure
A lack of infrastructure has many Americans turning to the White House for answers. In fact, 65% of Americans say the previous administration didn’t do enough to effectively address EV infrastructure expansion.
Democrats (45%) are more likely to feel satisfied with the previous administration’s EV expansion than Republicans (34%).
The Biden administration’s expansion attempts include the Bipartisan Infrastructure Law in November 2021, which dedicated $7.5 billion to building EV charging stations across the U.S. — though only seven had opened as of March 2024.
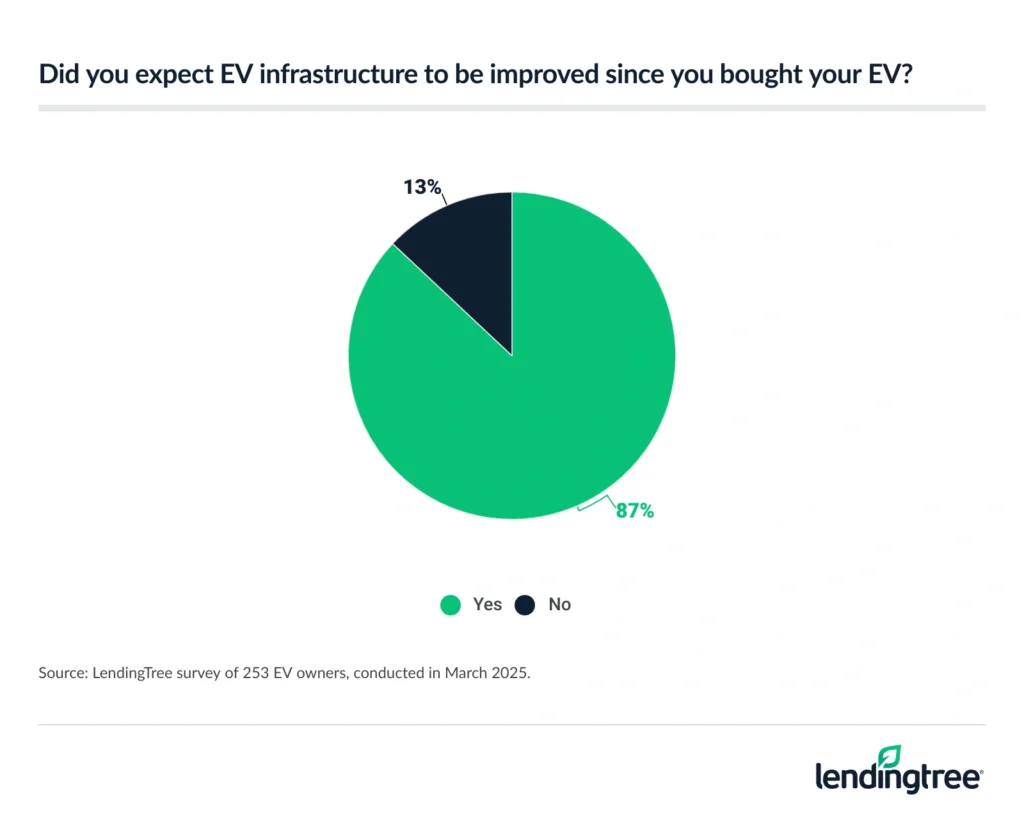
That leaves many EV owners disappointed, with 87% saying they expected EV infrastructure to improve since they purchased their vehicle.
When asked what the current administration should do, 40% said they wanted expanded infrastructure, while 30% wanted reduced infrastructure. Republicans (42%) are more likely to want reduced infrastructure, while Democrats (49%) are more likely to call for expansion.
“The new administration has been vocal about its priorities,” Bhatt says. “They haven’t focused on EV infrastructure very much, other than hinting at possible funding cuts. If you own an EV or are interested in purchasing one, it may be a while before you start to see much more improvement in EV infrastructure.”
Grappling with infrastructure while going electric: Top expert tips
Everyone’s situation is different. If you can charge your car at home and only use it to get to work and run errands, Bhatt says an EV may be a great choice — regardless of the infrastructure in your area.
On the other hand, if you don’t have convenient access to charging at home or work or regularly drive long distances, the availability of charging stations in your area is another factor to consider. If you’re considering going electric but have infrastructure concerns, Bhatt offers the following advice:
- Find out if your state or utility company offers tax credits or rebates for installing a home charging station. In some states, utility companies reduce your rate for charging your vehicle during off-peak times.
- As you weigh your options, keep an eye out for charging stations at places you frequent, like your grocery store or a parking lot near your office. These are convenient alternatives if you can’t charge up at home.
- Factor all the costs of EV ownership into your budget. “You may have to pay more up front for an EV, and you are likely to get a lower trade-in value when it’s time to replace the vehicle,” Bhatt says. “But the money you save on fuel and maintenance may still make it a better deal than a gas car over the long run, or at least a comparable investment.”
Methodology
LendingTree researchers analyzed U.S. Department of Energy Alternative Fuels Data Center (AFDC) data to create electric vehicle (EV) infrastructure rankings by state, utilizing a composite scoring system.
The categories and the weight assigned to each were:
- The number of EV charging ports per 10,000 vehicles in each state as of Feb. 18, 2025 (30%)
- The EV adoption rate in each state as of 2023 (30%)
- The number of EV laws and incentives per 100,000 vehicles in each state as of Feb. 18, 2025 (25%)
- The percentage change in EV registrations in each state from 2022 to 2023 (15%)
The states were ranked individually in each category, and these rankings were averaged using their weights to create composite rankings.
To determine the number of EV charging ports per 10,000 vehicles, a state’s number of charging ports was divided by the state’s number of light-duty vehicle registrations. The result was then multiplied by 10,000.
To determine adoption rates, we added a state’s electric, plug-in hybrid and hybrid electric vehicle registrations and divided them by the state’s total light-duty vehicle registrations.
The number of EV laws and incentives was calculated by adding the total in each state across four vehicle categories — electric, plug-in hybrid, hybrid and neighborhood. The result was then multiplied by 100,000 to get a per-100,000-vehicles calculation.
Lastly, we calculated each state’s percentage change in EV registrations from 2022 to 2023.
Additionally, LendingTree commissioned QuestionPro to conduct an online survey of 2,000 U.S. consumers ages 18 to 79 from March 4 to 6, 2025. The survey was administered using a nonprobability-based sample, and quotas were used to ensure the sample base represented the overall population. Researchers reviewed all responses for quality control.
We defined generations as the following ages in 2025:
- Generation Z: 18 to 28
- Millennial: 29 to 44
- Generation X: 45 to 60
- Baby boomer: 61 to 79