Electric Vehicle Registrations Continually Rise More Than 20%, but Demand for Larger Cars Dents Climate Impact
Electric vehicle registrations have jumped by no less than 23.1% over the past four years, according to the latest data via the U.S. Department of Energy Alternative Fuels Data Center.
With gas prices all over the place, electric and hybrid vehicles have become both environmentally conscious and good for the wallet. However, Americans’ increasing love of large vehicles — to the tune of trucks gaining 57.2% of the market share — means that more electric trucks and SUVs can’t come fast enough.
The latest LendingTree study analyzes federal data to show the states where electric vehicles are most popular and what models are best-sellers, among other things.
- The number of registered electric vehicles rose by 23.1% between 2019 and 2020. This is the fourth year in a row with year-over-year changes of at least 20%. Over those four years, gas vehicle registrations never grew by more than 1.1%.
- California has the highest share of electric vehicles. 4.0% of vehicles registered in California are electric, followed by 3.0% in Hawaii. Five states tie at the bottom at 0.2% — Alabama, Mississippi, North Dakota, South Dakota and West Virginia.
- Tesla Model 3s account for a large portion of the growth of purchased electric vehicles. In 2018, 38.7% of newly purchased electric vehicles were Tesla Model 3s. That percentage rose to 47.4% in 2019.
- Hybrid cars are starting to make a comeback. There were nearly 401,000 hybrid car sales in 2019 — the highest since 2014. At their peak in 2013, hybrid cars reached nearly 500,000 sales, but that number fell to more than 343,000 in 2018.
- While many Americans are going electric, consumers still driving gas cars are making increasingly worse environmental choices. Automakers are now producing more SUVs and trucks than sedans. In 2010, 37.2% of vehicles produced were trucks — a figure that’s increased to 57.2% in 2019. Trucks and SUVs typically provide lower gas mileage and higher emissions than sedans.
Electric vehicle registrations grew by 23.1% between 2019 and 2020
Motor vehicle registrations dropped 0.2% between 2019 and 2020, according to an analysis of U.S. Department of Transportation Federal Highway Administration data. Meanwhile, electric vehicle registrations spiked 23.1% in the same period, according to data via the Alternative Fuels Data Center.
Between 2016 and 2020, registrations for fully electric cars rose at least 20% each year, at an average of 27.4%. In the same four-year period, registrations for plug-in hybrids and electric hybrids grew an average of 18.8% and 6.1%, respectively.
Here’s a year-by-year breakdown of the percentage change in registrations by fuel type:
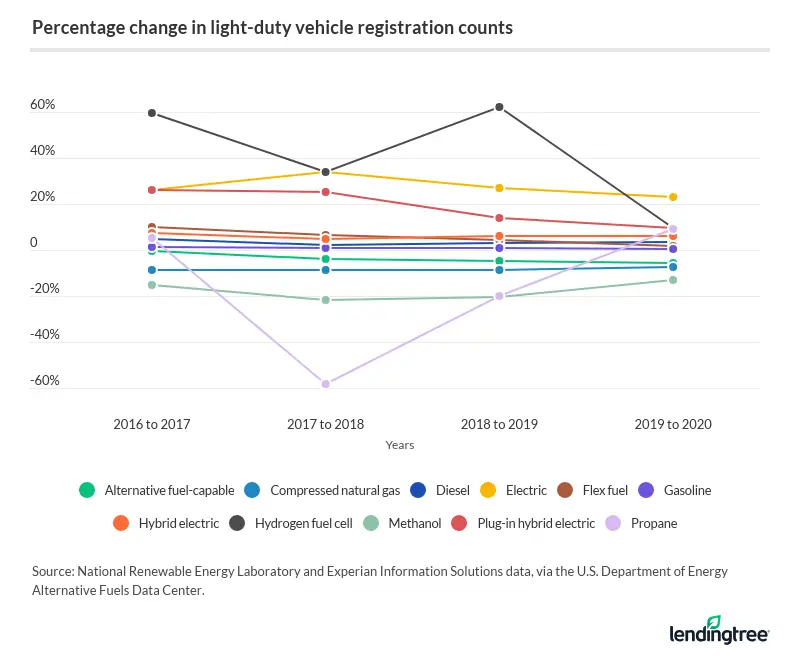
Gas vehicle registrations haven’t grown by more than 1.1% since 2016. But it’s harder to see a dramatic change here as more than 274 million gas vehicles are registered, versus the nearly 1.5 million with alternative power sources.
Hydrogen fuel cell vehicles register the highest yearly increase
The annual registration change for hydrogen-powered cars has been wild, from 62.0% growth between 2018 and 2019 to 9.4% between 2019 and 2020.
This fluctuation happened in part due to financial incentives offered by governments and because there is only a small base of hydrogen-powered vehicles, meaning any change is big. In February 2019, there were about 6,500 in use, compared with the nearly 276.5 million vehicles registered in total that year.
Contributing to their rarity: You can buy or lease these cars only in states with hydrogen refueling stations — California and Hawaii.
California has the highest share of electric vehicles
Just more than 1% — 1.4%, to be exact — of vehicles registered in the U.S. are electric, according to a LendingTree analysis of data via the Alternative Fuels Data Center. Bringing the average up are three of the westernmost states: California (4.0%), Hawaii (3.0%) and Washington (2.4%).
Residents in those three states face some of the highest gas prices in the nation, with California leading at $5.54 a gallon as of Aug. 4, 2022. That’s $1.40 more a gallon than the national average of $4.14. The five states with the lowest percentage of electric vehicle (EV) registrations — all at 0.2% — had average gas prices of $4.24 a gallon or less. Gas prices contributed to a recent LendingTree study that determined the best and worst states to own an EV.
With the right equipment, EVs can charge from the power grid — and give it back. A car could serve as a backup source during peak energy use, alleviating demand on bigger infrastructure.
Here’s a look at the share of electric vehicles by state:
Tesla Model 3s are the best-selling EVs by far
Tesla Model 3s commanded 38.7% of new EV purchases in 2018 and 47.4% in 2019, according to an analysis of data via the Alternative Fuels Data Center. Despite being introduced in 2017, the Model 3 has accounted for 20.5% of all EV sales since 2011. Its huge demand makes it the only EV model with a depreciation rate better than gas-powered vehicles.
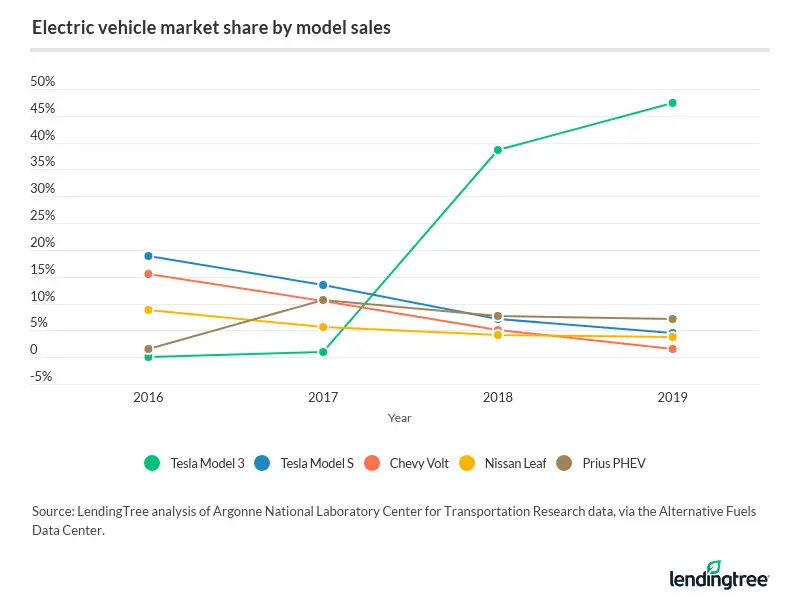
Other top models, including the Tesla Model S, Chevy Volt, Nissan Leaf and Prius PHEV, saw declining market shares. But this is a snapshot of the EV market only. In the larger picture, each model must compete with other EVs and transportation options, including hybrids. If you’re tempted by the most popular EV, here’s a Tesla financing review.
If your home outlet is powered by nonrenewable resources, you may wonder whether an EV helps the environment. Power plants are generally more efficient than a single vehicle engine, so the likely answer is that an EV is still more green.
Hybrid cars are making a comeback
Gas stations are everywhere, but charging infrastructure is still in the works. That means hybrids offer some benefits of going electric — along with a gas-fueled safety net.
Hybrid car sales peaked in 2013, with the Toyota Prius leading the charge, accounting for 44.8% of the 495,535 hybrids sold. Demand declined for several years after that, but 2019 saw a reinvigorated number: 400,746 hybrid car sales.
Source: Argonne National Laboratory Center for Transportation Research data, via the Alternative Fuels Data Center.Americans’ accelerating appetite for big cars offsets EV-driven benefits
Environmental benefits from some drivers going green are somewhat negated by America’s growing use of large vehicles. American drivers have always shown love to big cars — the best-selling vehicle in the U.S. for the past 40 consecutive years has been the Ford F-Series pickup truck — but this affection is becoming more potent.
In 2010, 37.2% of U.S. vehicles produced were trucks. In 2019, it was 57.2%. Trucks and SUVs typically have worse miles per gallon (MPG) and emissions than smaller cars.
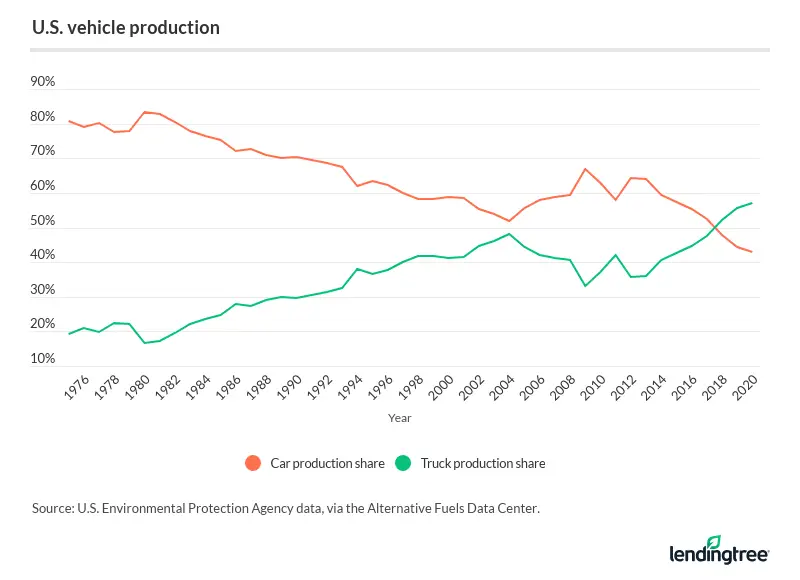
Some good news is that established and new automakers are starting to produce more EV trucks and SUVs. The Ford Lightning, Rivian R1T and Tesla Model Y are popular models.
Methodology
To explore how demand for electric cars has changed over time, LendingTree researchers analyzed data via the U.S. Department of Energy Alternative Fuels Data Center.
Researchers analyzed National Renewable Energy Laboratory and Experian Information Solutions data (via the Alternative Fuels Data Center) to determine the share of electric vehicles by state.
Get auto loan offers from up to 5 lenders in minutes