Home Insurance Rate Hikes Are Outpacing Both Inflation and Income Growth


Homeowners won’t be surprised to learn that home insurance rates have been rising — far faster, in fact, than inflation and income growth in recent years. LendingTree research finds that, from 2020 through 2025, regulator-approved home insurance rates rose 45.8% nationally, compared with a 26.1% inflation rate. That’s a notable 19.7 percentage point gap, or nearly double (about 1.8 times) inflation.
Below, find the full details, including the states with the widest and narrowest gaps between home insurance rate increases and inflation.
- Home insurance rates increased significantly faster than inflation from 2020 through 2025. Nationally, regulator-approved home insurance rate hikes totaled 45.8% over this period, compared with a cumulative 26.1% increase in the consumer price index (CPI). That’s a 19.7 percentage point gap, meaning approved home insurance rate increases were about 1.8 times the cumulative inflation rate.
- The widest annual gaps between home insurance rate hikes and inflation occurred in recent years. In 2024, home insurance rates increased 12.5%, while inflation was 2.9% — a 9.6 percentage point gap. In 2023, those increases were 10.7% and 3.4%, respectively — a 7.3 percentage point gap.
- Home insurance rate increases exceeded inflation in nearly every state from 2020 through 2025. Colorado had the biggest gap, with home insurance rate changes outpacing inflation by 74.4 percentage points. Iowa (69.7) and Minnesota (61.9) followed. Just five states saw inflation outpace home insurance rate hikes, led by West Virginia (-8.7 percentage points), Vermont (-2.7) and Maine (-2.3).
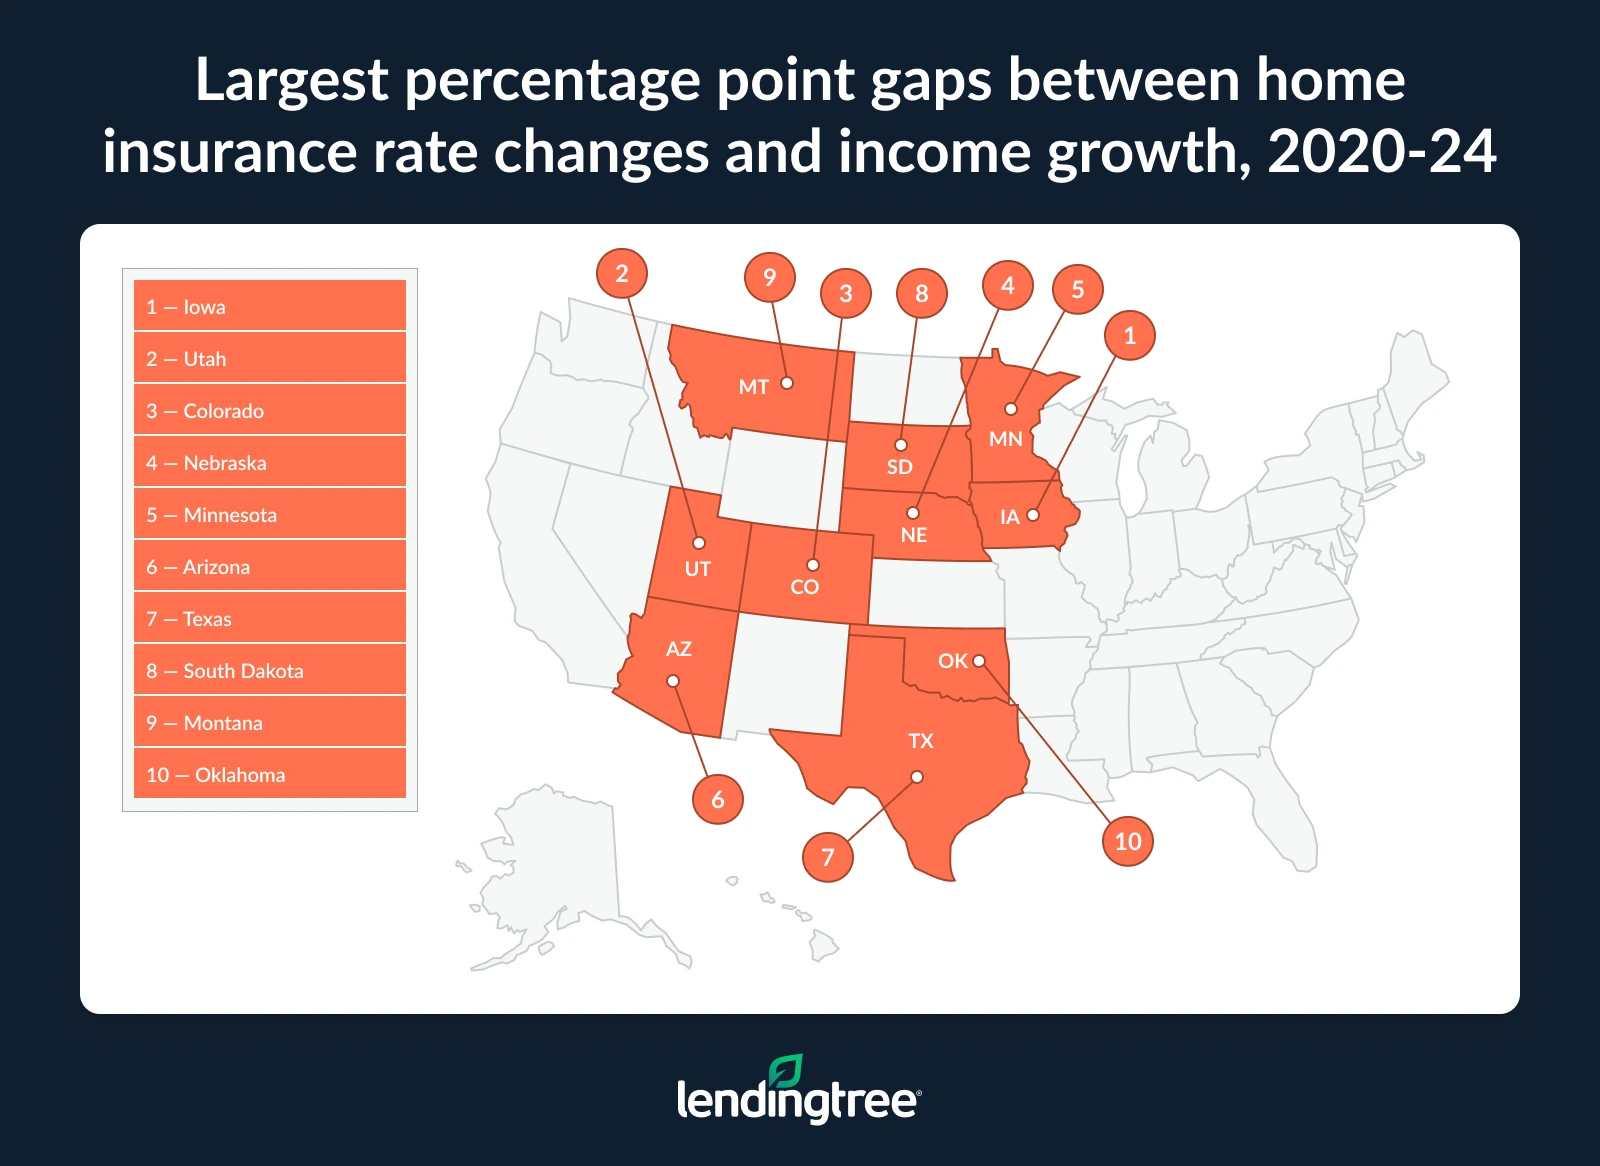
- It’s not just inflation, as home insurance rate hikes are also outpacing household income growth. Between 2020 and 2024, home insurance rates grew more than median income did in all but nine states, with the largest gaps in Iowa (49.5 percentage point difference), Utah (43.8) and Colorado (42.8). Meanwhile, Vermont (-11.4), South Carolina (-9.0) and Maine (-8.3) are among the states where household income growth outpaced home insurance rate increases.
Home insurance rate increases outpace inflation
Regulator-approved home insurance rate hikes outpaced inflation from 2020 through 2025 — and substantially, at that. Across the nation, rate hikes totaled 45.8% over this six-year period, while inflation across the same period totaled 26.1%. That’s a 19.7 percentage point difference, meaning that insurance rate increases outstripped the cumulative inflation rate by 1.8 times.
“This trend has put strains on family budgets across the spectrum,” says Rob Bhatt, LendingTree home insurance expert and licensed insurance agent. While low- and moderate-income families may feel an even tighter pinch since they have less financial cushion, “most people have been affected by this in one way or another,” Bhatt says.
“Homeowners insurance is an essential need,” Bhatt affirms — and if you’re like the majority of homeowners with a mortgage, the lending institution requires it. That means that these rising costs can cut into the funds that families have for other needs, explains Bhatt, including groceries, utilities and the cost of the mortgage payment itself.
Increases have been bigger recently, but they may be stabilizing
The widest annual gaps between home insurance rate hikes and inflation occurred in recent times. The year 2024 saw the widest gap, with homeowners insurance rates increasing 12.5% as inflation was 2.9%, a 9.6 percentage point gap that means insurance rates skyrocketed at around 4.3 times the inflation rate. Meanwhile, 2023 saw home insurance rates spike by 10.7% compared to a 3.4% inflation rate, a 7.3 percentage point gap, meaning home insurance hikes outstripped inflation by about 3.1 times.
In 2025, however, the trend slackened a bit when the rates of regulator-approved homeowners insurance policies rose a relatively low 5.9%.
Home insurance rate changes vs. inflation, 2020 through 2025
2020
- Home insurance rate change: 1.9%
- Inflation rate: 1.4%
2021
- Home insurance rate change: 2.7%
- Inflation rate: 7.0%
2022
- Home insurance rate change: 5.1%
- Inflation rate: 6.5%
2023
- Home insurance rate change: 10.7%
- Inflation rate: 3.4%
2024
- Home insurance rate change: 12.5%
- Inflation rate: 2.9%
2025
- Home insurance rate change: 5.9%
- Inflation rate: 2.7%
According to Bhatt, a combination of factors has contributed to this intense recent rise. “The first,” he says, “has been an uptick in large-scale natural disasters, including hurricanes, extreme wind events and wildfires.” And because of the way costs are shared across insured parties, disasters can increase prices even in less-prone areas.
“Meanwhile,” Bhatt goes on, “the costs of building materials and labor have also gone up at higher-than-normal paces. Insurance companies have had to repair or rebuild more homes than normal, and the cost of rebuilding each one is more expensive than it was before 2020. Unfortunately, insurance companies raise their rates to account for this type of growth in their expenses.”
There is, however, “one bit of good news,” Bhatt says. “There are signs that home insurance prices may be stabilizing. Inflation has cooled, and prior rate hikes may be giving insurance companies enough revenue to cover their growing claims costs.”
In this economy, even seeing insurance rates flatten for a few years could provide relief to homeowners, says Bhatt — though another spike in inflation or more extreme weather events could always upset this tenuous balance.
Home insurance rate hikes outpace inflation the most in Colorado
While there’s always significant state-to-state variability in such trends, this one didn’t miss too much of the U.S. Home insurance rate increases exceeded inflation from 2020 through 2025 in 44 U.S. states, as well as the District of Columbia.
Colorado, however, had the biggest gap. There, home insurance rates — which catapulted upward 100.8% over the six-year studied period — outpaced inflation by 74.4 percentage points. Next up was Iowa, which saw a 69.7 percentage point difference between the two increases, with Minnesota coming in third at 61.9 percentage points.
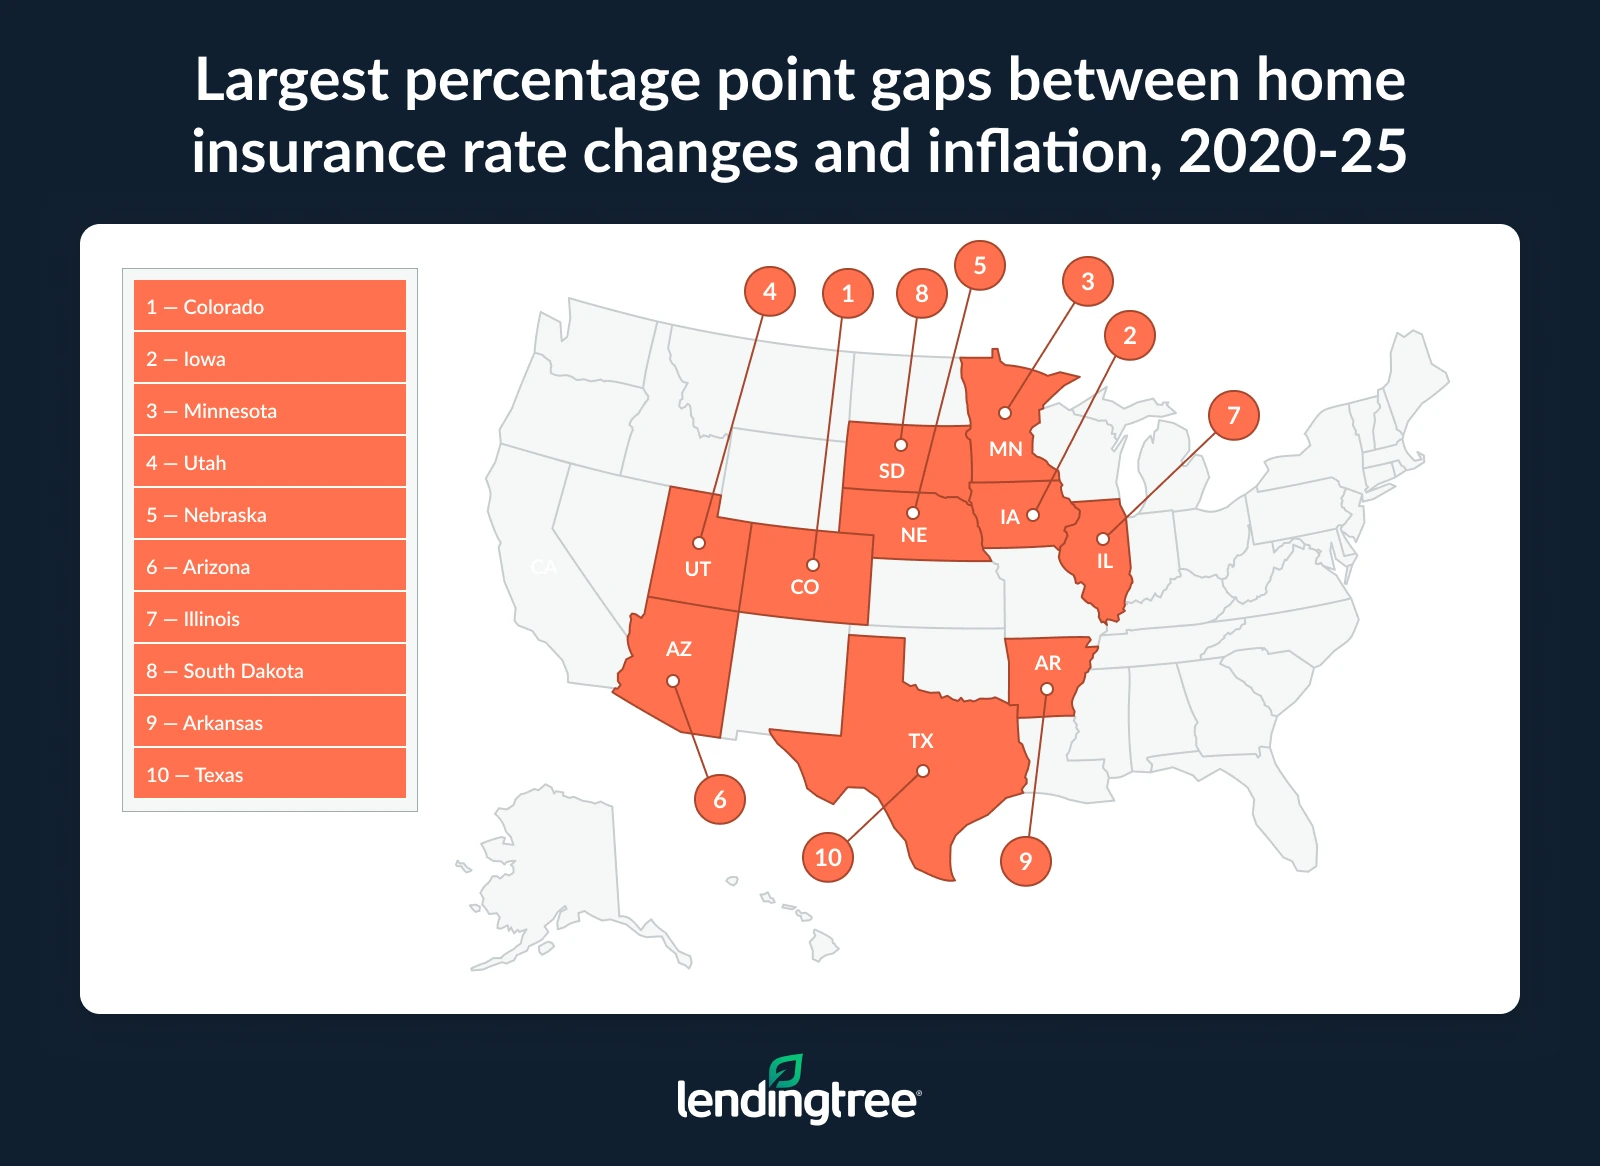
At the other end of the spectrum, the five states where inflation outpaced home insurance rate hikes were led by West Virginia, with an 8.7 percentage point difference in the opposite direction. It was followed by Vermont (-2.7 percentage points), Maine (-2.3 percentage points), Alaska (-1.0 percentage points) and New York (-0.5 percentage points).
The algorithms underlying insurance rates are complex, and it can be difficult to ascertain why certain states fared so differently from others in this regard. That said, it’s noteworthy that none of the states where inflation outpaced homeowners insurance rate hikes are in areas typically prone to hurricanes, wildfires and other major, costly weather-related disasters.
“The New England states haven’t been hit as hard by natural disasters as most other parts of the country, and this may be why home insurance rates have remained stable in Vermont and Maine,” Bhatt says. While West Virginia is close to places that have been hit heavily — namely, western North Carolina, which saw devastating flooding in 2024 during Hurricane Helene — the state itself “escaped the brunt of these events,” Bhatt notes.
Full rankings: Where home insurance rates rose faster than inflation, 2020 through 2025
| Rank | State | Home insurance rate hike | Inflation rate | % point gap | Multiple |
|---|---|---|---|---|---|
| 1 | Colorado | 100.8% | 26.4% | 74.4 | 3.8x |
| 2 | Iowa | 96.0% | 26.3% | 69.7 | 3.7x |
| 3 | Minnesota | 88.2% | 26.3% | 61.9 | 3.4x |
| 4 | Utah | 77.2% | 26.4% | 50.8 | 2.9x |
| 5 | Nebraska | 72.2% | 26.3% | 45.9 | 2.7x |
| 6 | Arizona | 71.0% | 26.4% | 44.6 | 2.7x |
| 7 | Illinois | 68.0% | 25.7% | 42.3 | 2.6x |
| 8 | South Dakota | 62.8% | 26.3% | 36.5 | 2.4x |
| 9 | Arkansas | 56.2% | 23.8% | 32.4 | 2.4x |
| 10 | Texas | 55.9% | 23.8% | 32.1 | 2.3x |
| 11 | Oklahoma | 54.5% | 23.8% | 30.7 | 2.3x |
| 12 | Oregon | 56.5% | 25.9% | 30.6 | 2.2x |
| 13 | Montana | 56.5% | 26.4% | 30.1 | 2.1x |
| 14 | Washington | 55.4% | 25.9% | 29.5 | 2.1x |
| 15 | California | 53.7% | 25.9% | 27.8 | 2.1x |
| 16 | Idaho | 52.8% | 26.4% | 26.4 | 2.0x |
| 17 | Rhode Island | 45.6% | 22.3% | 23.3 | 2.0x |
| 18 | Wisconsin | 48.7% | 25.7% | 23.0 | 1.9x |
| 19 | Florida | 49.5% | 27.9% | 21.6 | 1.8x |
| 20 | Ohio | 46.4% | 25.7% | 20.7 | 1.8x |
| 21 | Maryland | 47.3% | 27.9% | 19.4 | 1.7x |
| 21 | New Mexico | 45.8% | 26.4% | 19.4 | 1.7x |
| 23 | Missouri | 45.5% | 26.3% | 19.2 | 1.7x |
| 24 | North Carolina | 46.9% | 27.9% | 19.0 | 1.7x |
| 25 | Indiana | 44.1% | 25.7% | 18.4 | 1.7x |
| 26 | Louisiana | 41.5% | 23.8% | 17.7 | 1.7x |
| 27 | Kentucky | 46.3% | 28.9% | 17.4 | 1.6x |
| 28 | Connecticut | 39.4% | 22.3% | 17.1 | 1.8x |
| 29 | Kansas | 42.6% | 26.3% | 16.3 | 1.6x |
| 30 | Michigan | 40.8% | 25.7% | 15.1 | 1.6x |
| 31 | Tennessee | 42.9% | 28.9% | 14.0 | 1.5x |
| 32 | North Dakota | 39.9% | 26.3% | 13.6 | 1.5x |
| 33 | Virginia | 41.4% | 27.9% | 13.5 | 1.5x |
| 34 | Alabama | 41.2% | 28.9% | 12.3 | 1.4x |
| 34 | Georgia | 40.2% | 27.9% | 12.3 | 1.4x |
| 36 | Pennsylvania | 33.4% | 26.0% | 7.4 | 1.3x |
| 37 | Massachusetts | 29.6% | 22.3% | 7.3 | 1.3x |
| 38 | Hawaii | 32.8% | 25.9% | 6.9 | 1.3x |
| 39 | New Jersey | 32.1% | 26.0% | 6.1 | 1.2x |
| 40 | Delaware | 33.9% | 27.9% | 6.0 | 1.2x |
| 41 | Mississippi | 34.6% | 28.9% | 5.7 | 1.2x |
| 42 | District of Columbia | 32.9% | 27.9% | 5.0 | 1.2x |
| 43 | New Hampshire | 26.9% | 22.3% | 4.6 | 1.2x |
| 44 | Nevada | 30.4% | 26.4% | 4.0 | 1.2x |
| 45 | South Carolina | 28.9% | 27.9% | 1.0 | 1.0x |
| 46 | New York | 25.5% | 26.0% | -0.5 | 1.0x |
| 47 | Alaska | 24.9% | 25.9% | -1.0 | 1.0x |
| 48 | Maine | 20.0% | 22.3% | -2.3 | 0.9x |
| 49 | Vermont | 19.6% | 22.3% | -2.7 | 0.9x |
| 50 | West Virginia | 19.2% | 27.9% | -8.7 | 0.7x |
Full rankings: Where home insurance rates rose faster than inflation, 2025
| Rank | State | Home insurance rate hike | Inflation rate | % point gap | Multiple |
|---|---|---|---|---|---|
| 1 | Colorado | 18.3% | 2.4% | 15.9 | 7.6x |
| 2 | Minnesota | 17.0% | 2.4% | 14.6 | 7.1x |
| 3 | Iowa | 14.7% | 2.4% | 12.3 | 6.1x |
| 4 | Illinois | 14.1% | 2.8% | 11.3 | 5.0x |
| 5 | Delaware | 10.8% | 2.3% | 8.5 | 4.7x |
| 6 | South Carolina | 9.7% | 2.3% | 7.4 | 4.2x |
| 7 | Kentucky | 10.2% | 2.9% | 7.3 | 3.5x |
| 8 | Mississippi | 10.1% | 2.9% | 7.2 | 3.5x |
| 9 | Arkansas | 8.5% | 1.5% | 7.0 | 5.7x |
| 10 | District of Columbia | 8.8% | 2.3% | 6.5 | 3.8x |
| 11 | Hawaii | 9.2% | 3.1% | 6.1 | 3.0x |
| 12 | Alaska | 8.8% | 3.1% | 5.7 | 2.8x |
| 13 | Tennessee | 8.3% | 2.9% | 5.4 | 2.9x |
| 14 | Nevada | 7.7% | 2.4% | 5.3 | 3.2x |
| 15 | Georgia | 7.3% | 2.3% | 5.0 | 3.2x |
| 16 | Michigan | 7.6% | 2.8% | 4.8 | 2.7x |
| 17 | Ohio | 7.3% | 2.8% | 4.5 | 2.6x |
| 17 | Wisconsin | 7.3% | 2.8% | 4.5 | 2.6x |
| 19 | Alabama | 7.2% | 2.9% | 4.3 | 2.5x |
| 20 | Oklahoma | 5.5% | 1.5% | 4.0 | 3.7x |
| 21 | South Dakota | 6.3% | 2.4% | 3.9 | 2.6x |
| 21 | New Jersey | 7.5% | 3.6% | 3.9 | 2.1x |
| 21 | North Carolina | 6.2% | 2.3% | 3.9 | 2.7x |
| 24 | Nebraska | 6.0% | 2.4% | 3.6 | 2.5x |
| 25 | Connecticut | 5.4% | 2.5% | 2.9 | 2.2x |
| 26 | Kansas | 4.8% | 2.4% | 2.4 | 2.0x |
| 27 | North Dakota | 4.7% | 2.4% | 2.3 | 2.0x |
| 28 | Louisiana | 3.3% | 1.5% | 1.8 | 2.2x |
| 29 | Indiana | 4.4% | 2.8% | 1.6 | 1.6x |
| 29 | Virginia | 3.9% | 2.3% | 1.6 | 1.7x |
| 31 | Missouri | 3.8% | 2.4% | 1.4 | 1.6x |
| 32 | California | 4.4% | 3.1% | 1.3 | 1.4x |
| 33 | Arizona | 3.6% | 2.4% | 1.2 | 1.5x |
| 34 | Idaho | 3.5% | 2.4% | 1.1 | 1.5x |
| 35 | New York | 4.6% | 3.6% | 1.0 | 1.3x |
| 36 | Maryland | 3.2% | 2.3% | 0.9 | 1.4x |
| 37 | Utah | 3.0% | 2.4% | 0.6 | 1.3x |
| 37 | Oregon | 3.7% | 3.1% | 0.6 | 1.2x |
| 39 | Washington | 3.5% | 3.1% | 0.4 | 1.1x |
| 39 | Rhode Island | 2.9% | 2.5% | 0.4 | 1.2x |
| 41 | Vermont | 2.7% | 2.5% | 0.2 | 1.1x |
| 42 | New Mexico | 2.4% | 2.4% | 0.0 | 1.0x |
| 42 | Massachusetts | 2.5% | 2.5% | 0.0 | 1.0x |
| 44 | Maine | 2.3% | 2.5% | -0.2 | 0.9x |
| 45 | Texas | 0.6% | 1.5% | -0.9 | 0.4x |
| 46 | New Hampshire | 1.3% | 2.5% | -1.2 | 0.5x |
| 47 | West Virginia | 0.9% | 2.3% | -1.5 | 0.4x |
| 48 | Florida | 0.4% | 2.3% | -1.9 | 0.2x |
| 49 | Montana | 0.5% | 2.4% | -2.0 | 0.2x |
| 50 | Pennsylvania | 1.2% | 3.6% | -2.4 | 0.3x |
Home insurance rate changes also outpace income growth
While it’s hard enough for homeowners to keep up as insurance outpaces inflation, in the majority of states, the rising cost of home insurance is also outpacing income growth. (Note: The data for this section is taken from 2020 through 2024, rather than through 2025 like the data used in the sections above.)
During the studied period, in all but nine states, the percentage increase in median household income fell short of the regulator-approved home insurance rate change. The gap was widest in Iowa, where there was a 49.5 percentage point difference between the insurance increase (70.9%) and the median household income bump (21.4%). Utah and Colorado followed, with percentage point differences of 43.8 and 42.8, respectively.
Obviously, this trend will be duly troubling for many homeowners.
“Ideally, you want your income to grow faster than inflation,” Bhatt explains. “That’s how you get ahead, so to speak, on your finances.”
While in some of these states, income increases may outpace inflation, the insurance rate hikes can still diminish your gains from a salary increase, Bhatt explains.
That said, there are a few states that enjoyed household income growth that outstripped the home insurance rate increases. In Vermont, where household income increased 27.9% between 2020 and 2024 — one of the higher increases across the nation — the percentage point difference was -11.4. South Carolina follows at -9.0, with Maine coming in third at -8.3.
Still, when considering 2024 alone, even more states saw the home insurance increase exceed median income growth — 48 states and the District of Columbia, to be exact. (The exception was Florida, where a 4.0% median household income increase outpaced a 1.1% increase in home insurance prices, a percentage point difference of -2.9.)
The states that saw the worst single-year discrepancies here were Iowa (where home insurance rose 27.1% in 2024 compared to just a 2.6% income increase), followed by Nebraska (a 20.6 percentage point gap) and Minnesota (20.5 percentage points).
Full rankings: Where home insurance rate changes outpaced median household income growth, 2020 through 2024
| Rank | State | Home insurance rate hike | % increase in median household income | % point gap | Multiple |
|---|---|---|---|---|---|
| 1 | Iowa | 70.9% | 21.4% | 49.5 | 3.3x |
| 2 | Utah | 72.1% | 28.3% | 43.8 | 2.5x |
| 3 | Colorado | 69.7% | 26.9% | 42.8 | 2.6x |
| 4 | Nebraska | 62.5% | 21.4% | 41.1 | 2.9x |
| 5 | Minnesota | 60.8% | 21.4% | 39.4 | 2.8x |
| 6 | Arizona | 65.1% | 30.0% | 35.1 | 2.2x |
| 7 | Texas | 54.9% | 23.0% | 31.9 | 2.4x |
| 8 | South Dakota | 53.1% | 25.4% | 27.7 | 2.1x |
| 9 | Montana | 55.8% | 28.2% | 27.6 | 2.0x |
| 10 | Oklahoma | 46.5% | 20.8% | 25.7 | 2.2x |
| 11 | Illinois | 47.2% | 21.9% | 25.3 | 2.2x |
| 12 | Oregon | 50.9% | 26.4% | 24.5 | 1.9x |
| 13 | Maryland | 42.7% | 19.1% | 23.6 | 2.2x |
| 14 | Washington | 50.1% | 27.4% | 22.7 | 1.8x |
| 15 | California | 47.3% | 26.0% | 21.3 | 1.8x |
| 16 | Arkansas | 44.0% | 22.8% | 21.2 | 1.9x |
| 17 | Florida | 48.9% | 29.2% | 19.7 | 1.7x |
| 18 | Louisiana | 37.0% | 19.6% | 17.4 | 1.9x |
| 19 | New Mexico | 42.3% | 25.0% | 17.3 | 1.7x |
| 20 | Missouri | 40.2% | 23.4% | 16.8 | 1.7x |
| 21 | Rhode Island | 41.5% | 24.9% | 16.6 | 1.7x |
| 22 | Wisconsin | 38.6% | 22.4% | 16.2 | 1.7x |
| 22 | North Dakota | 33.6% | 17.4% | 16.2 | 1.9x |
| 24 | Idaho | 47.6% | 32.1% | 15.5 | 1.5x |
| 25 | Kansas | 36.1% | 21.6% | 14.5 | 1.7x |
| 26 | Indiana | 38.0% | 23.6% | 14.4 | 1.6x |
| 27 | Virginia | 36.1% | 22.0% | 14.1 | 1.6x |
| 28 | Ohio | 36.4% | 22.8% | 13.6 | 1.6x |
| 29 | Connecticut | 32.3% | 19.9% | 12.4 | 1.6x |
| 30 | Kentucky | 32.8% | 22.0% | 10.8 | 1.5x |
| 31 | North Carolina | 38.4% | 27.8% | 10.6 | 1.4x |
| 32 | Pennsylvania | 31.8% | 22.5% | 9.3 | 1.4x |
| 33 | Alabama | 31.7% | 23.0% | 8.7 | 1.4x |
| 34 | Michigan | 30.9% | 23.0% | 7.9 | 1.3x |
| 35 | Tennessee | 31.9% | 26.9% | 5.0 | 1.2x |
| 36 | Georgia | 30.7% | 26.3% | 4.4 | 1.2x |
| 37 | Massachusetts | 26.5% | 23.2% | 3.3 | 1.1x |
| 38 | New Jersey | 22.9% | 21.5% | 1.4 | 1.1x |
| 39 | District of Columbia | 22.1% | 20.9% | 1.2 | 1.1x |
| 40 | Hawaii | 21.7% | 20.7% | 1.0 | 1.0x |
| 41 | Mississippi | 22.2% | 21.4% | 0.8 | 1.0x |
| 42 | New York | 20.0% | 20.9% | -0.9 | 1.0x |
| 43 | New Hampshire | 25.2% | 27.1% | -1.9 | 0.9x |
| 44 | Delaware | 20.8% | 22.9% | -2.1 | 0.9x |
| 45 | Alaska | 14.8% | 19.3% | -4.5 | 0.8x |
| 46 | Nevada | 21.0% | 26.1% | -5.1 | 0.8x |
| 47 | West Virginia | 18.2% | 24.1% | -5.9 | 0.8x |
| 48 | Maine | 17.3% | 25.6% | -8.3 | 0.7x |
| 49 | South Carolina | 17.4% | 26.4% | -9.0 | 0.7x |
| 50 | Vermont | 16.5% | 27.9% | -11.4 | 0.6x |
Full rankings: Where home insurance rate changes outpaced median household income growth, 2024
| Rank | State | Home insurance rate hike | % increase in median household income | % point gap | Multiple |
|---|---|---|---|---|---|
| 1 | Iowa | 27.1% | 2.6% | 24.5 | 10.4x |
| 2 | Nebraska | 22.6% | 2.0% | 20.6 | 11.3x |
| 3 | Minnesota | 22.2% | 1.7% | 20.5 | 13.1x |
| 4 | Montana | 22.3% | 3.7% | 18.6 | 6.0x |
| 5 | North Dakota | 18.9% | 0.9% | 18.0 | 21.0x |
| 6 | Washington | 21.3% | 3.4% | 17.9 | 6.3x |
| 7 | Utah | 21.3% | 3.7% | 17.6 | 5.8x |
| 8 | Missouri | 18.0% | 2.6% | 15.4 | 6.9x |
| 9 | South Dakota | 19.0% | 3.7% | 15.3 | 5.1x |
| 10 | Wisconsin | 15.7% | 2.4% | 13.3 | 6.5x |
| 11 | Kansas | 14.7% | 2.3% | 12.4 | 6.4x |
| 12 | Colorado | 15.1% | 3.2% | 11.9 | 4.7x |
| 13 | Illinois | 13.8% | 2.1% | 11.7 | 6.6x |
| 14 | California | 14.5% | 2.9% | 11.6 | 5.0x |
| 15 | Pennsylvania | 14.0% | 2.5% | 11.5 | 5.6x |
| 16 | Indiana | 14.1% | 2.7% | 11.4 | 5.2x |
| 17 | Ohio | 13.6% | 2.5% | 11.1 | 5.4x |
| 18 | Idaho | 15.0% | 4.2% | 10.8 | 3.6x |
| 18 | Connecticut | 13.0% | 2.2% | 10.8 | 5.9x |
| 20 | Rhode Island | 12.2% | 1.6% | 10.6 | 7.6x |
| 20 | Kentucky | 12.7% | 2.1% | 10.6 | 6.0x |
| 22 | Maryland | 12.1% | 2.0% | 10.1 | 6.1x |
| 23 | Arizona | 14.0% | 4.0% | 10.0 | 3.5x |
| 23 | Hawaii | 12.1% | 2.1% | 10.0 | 5.8x |
| 25 | Arkansas | 13.2% | 3.4% | 9.8 | 3.9x |
| 25 | New Mexico | 12.9% | 3.1% | 9.8 | 4.2x |
| 27 | Michigan | 11.6% | 2.4% | 9.2 | 4.8x |
| 28 | Georgia | 12.4% | 3.6% | 8.8 | 3.4x |
| 29 | Virginia | 11.1% | 2.4% | 8.7 | 4.6x |
| 30 | Mississippi | 11.1% | 2.8% | 8.3 | 4.0x |
| 31 | Louisiana | 9.2% | 1.2% | 8.0 | 7.7x |
| 32 | New Jersey | 10.2% | 2.5% | 7.7 | 4.1x |
| 32 | New Hampshire | 11.3% | 3.6% | 7.7 | 3.1x |
| 32 | West Virginia | 10.6% | 2.9% | 7.7 | 3.7x |
| 35 | Alabama | 10.8% | 3.2% | 7.6 | 3.4x |
| 36 | Oklahoma | 9.8% | 2.3% | 7.5 | 4.3x |
| 37 | Oregon | 10.0% | 3.2% | 6.8 | 3.1x |
| 38 | Tennessee | 10.3% | 3.7% | 6.6 | 2.8x |
| 39 | Texas | 8.9% | 2.9% | 6.0 | 3.1x |
| 40 | Delaware | 7.8% | 2.5% | 5.3 | 3.1x |
| 41 | North Carolina | 8.3% | 3.6% | 4.7 | 2.3x |
| 41 | Massachusetts | 7.3% | 2.6% | 4.7 | 2.8x |
| 41 | South Carolina | 8.5% | 3.8% | 4.7 | 2.2x |
| 44 | Vermont | 8.5% | 4.1% | 4.4 | 2.1x |
| 45 | District of Columbia | 7.3% | 3.4% | 3.9 | 2.1x |
| 46 | New York | 5.3% | 1.7% | 3.6 | 3.1x |
| 46 | Maine | 7.7% | 4.1% | 3.6 | 1.9x |
| 48 | Alaska | 7.3% | 3.9% | 3.4 | 1.9x |
| 49 | Nevada | 4.6% | 3.6% | 1.0 | 1.3x |
| 50 | Florida | 1.1% | 4.0% | -2.9 | 0.3x |
Combating home insurance rate hikes on a tighter budget: Top expert tips
It can be difficult to tighten your belt when so many basic expenses seem to require bigger and bigger bites. Still, there are ways to stack the odds in your favor, even with insurance rate hikes.
- Consider raising your deductibles. Yes, a higher deductible means more money out of pocket in the event of a disaster, but it can help keep your monthly cost relatively low. “Choosing the highest amount you’d be able to reasonably afford after a disaster may lower your insurance rate,” Bhatt says. Just be careful not to put yourself in a position where you could be facing a deductible you truly can’t afford.
- Shop around. It’s common advice — but that’s because it works. “Each company uses a different system to set rates,” Bhatt says. That means “it’s good to compare quotes from a few companies every few years to see if a different company can give you a better deal.”
- Avoid minor insurance claims. “Insurance companies get skittish over claims of any size,” Bhatt says. “After all, claims mean they have to pay out, and insurance companies are feeling the pinch just like everyone else.” Just a single claim usually results in a rate increase, Bhatt says, and your company may even drop you if you have multiple claims in a relatively short period, or if they catch you falsifying claims. Thus, Bhatt says, “paying for small repairs out of your own pocket may save you insurance frustration in the long run.”
- Don’t go uninsured. It might seem tempting to just drop the bill entirely as home insurance costs soar. But for most Americans, their home is the single biggest asset in the family’s entire portfolio. While 12.2 million U.S. owner-occupied homes are uninsured, when the worst happens, you don’t want yours to be among them.
Methodology
LendingTree researchers analyzed home insurance rate changes using S&P Global RateWatch data, which reflects regulator-approved rate increases. State-level insurance rate changes were calculated by averaging the rate changes among each state’s largest insurers as captured in RateWatch.
Annual figures reflect regulator-approved rate changes for that specific year, while cumulative figures reflect compounded changes from 2020 through 2025. For comparisons involving household income, cumulative insurance rate changes reflect the 2020-through-2024 period. Wyoming was excluded due to insufficient RateWatch data.
Inflation data came from the U.S. Bureau of Labor Statistics (BLS) consumer price index (CPI). National CPI inflation rates reflect the 12-month December-to-December change, and cumulative inflation reflects the compounded December-to-December change over the period analyzed.
Because state-level inflation data wasn’t available, the analysis used BLS regional and division CPI 12-month change data as a proxy. States were matched to their corresponding region or division for December 2020 through December 2025.
To compare home insurance rate changes with household income growth, LendingTree used U.S. Census Bureau American Community Survey (ACS) with five-year estimates data for median household income. Household income growth was calculated as the percentage change in median household income from 2020 to 2024, and separately for the year-over-year change reported for 2024. These figures were then compared with cumulative home insurance rate changes over the same time windows.