Across US, Speeding Tickets Drive Up Insurance Costs by Over $500 a Year


Getting a ticket while driving hurts — and not just because you have to pay a fine. Your auto insurance premiums are bound to go up, too.
According to this LendingTree study, a speeding ticket for going 11 to 15 mph over the limit raises rates by an average of 22.7%. That breaks down to $524.74 more a year, or $43.73 a month.
Here’s a closer look.
Key findings
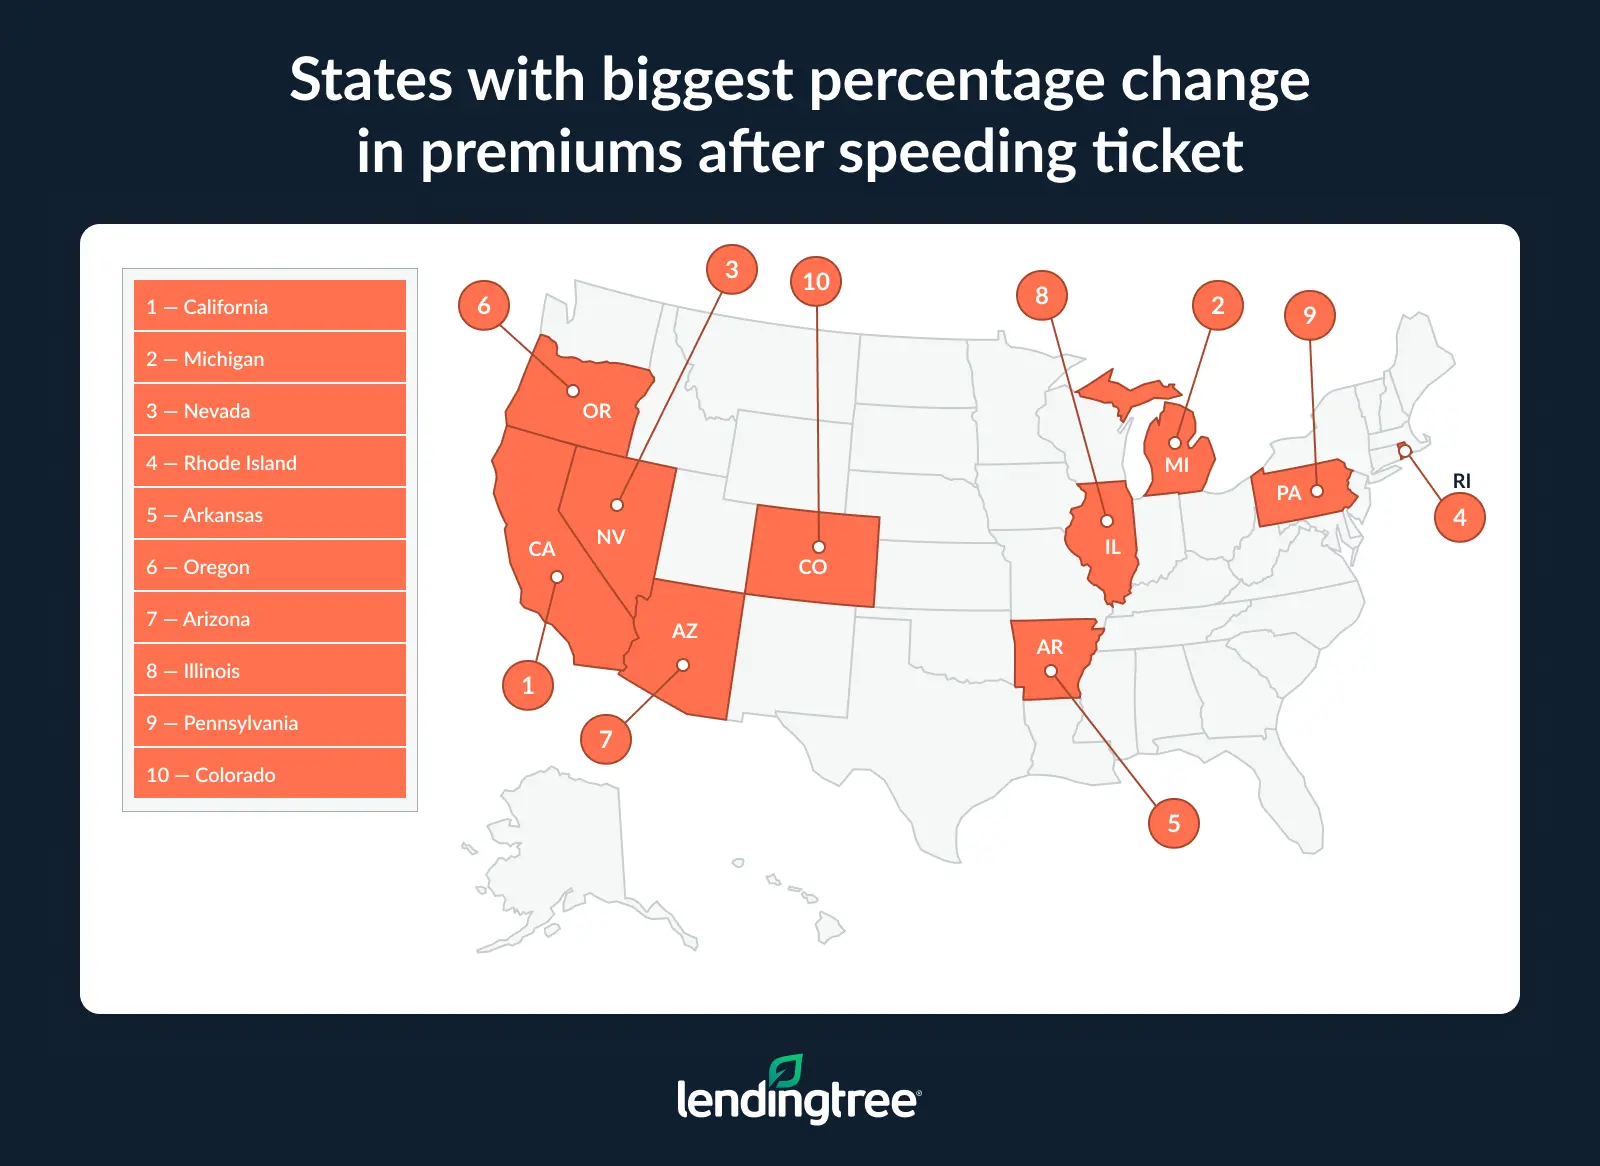
- Across the U.S., drivers pay an average of 22.7% more for auto insurance after receiving a speeding ticket for going 11 to 15 mph over the limit. Rates after a speeding ticket jump the most in California, rising 42.0%, from $2,392.91 to $3,397.64. Michigan (35.8%) and Nevada (31.3%) follow.
- Put another way, a speeding ticket adds more than $500 on average to a driver’s insurance bill. Nationally, drivers pay $524.74 more a year — or $43.73 a month — after a speeding ticket. Over three years, that adds up to an extra $1,574.22 in premiums.
- Arizona and California are the only states where drivers’ auto insurance rates increase by an average of more than $1,000 annually after a speeding ticket. In these states, rates increase by an average of $1,071.41 and $1,004.73, respectively, after a speeding ticket. Vermont ($225.40), Hawaii ($261.58) and Maine ($289.50) are the only states where the increase is below $300.
- Younger drivers face the biggest financial hit after a speeding ticket. Though rate increases are similar across ages, higher base premiums mean younger drivers pay far more. A 20-year-old’s premium jumps an average of $1,183.67 a year following a ticket, compared with roughly $550 for drivers in their 50s and 60s.
Drivers pay 22.7% more on average for auto insurance after speeding
Speeding tickets hurt the wallet in more ways than one. Alongside a likely fine, drivers pay an average of 22.7% more for auto insurance after receiving a speeding ticket for going 11 to 15 mph over the limit.
By state, drivers in California see the biggest jump, with average rates rising 42.0%, from $2,392.91 to $3,397.64. Michigan follows, with an increase of 35.8% (from $2,462.40 to $3,344.00), while Nevada rounds out the top three at 31.3% (from $2,789.85 to $3,663.39).
On the other end of the list, Florida saw the smallest jump at 12.4%, with rates increasing from $3,411.14 to $3,832.57. Texas (12.5%) and North Carolina and New York (both at 13.4%) followed.
According to auto insurance expert and licensed insurance agent Rob Bhatt, there are a few reasons your rates will rise after a ticket.
“In the eyes of an insurance company, drivers with a speeding ticket are more likely to get into accidents than those with a clean driving record,” he says. “Higher crash risks translate into higher insurance rates. The rate increase you get for speeding or other moving violations is called a surcharge.”
A rate increase isn’t the only consequence you might face. Some states assign points after a speeding violation, with most states that have a points system adding two to four points to a driver’s license for speeding 10 to 15 mph over the limit. Of note, Hawaii, Kansas, Louisiana, Minnesota, Mississippi, Oregon, Rhode Island, Texas, Washington and Wyoming don’t use point systems. Meanwhile, Utah and Illinois use different scales than the rest of the states.
Full rankings: States with biggest % change in auto insurance premiums after speeding ticket
| Rank | State | Avg. annual premium before | Avg. annual premium after | % increase |
|---|---|---|---|---|
| 1 | California | $2,392.91 | $3,397.64 | 42.0% |
| 2 | Michigan | $2,462.40 | $3,344.00 | 35.8% |
| 3 | Nevada | $2,789.85 | $3,663.39 | 31.3% |
| 4 | Rhode Island | $2,641.63 | $3,439.50 | 30.2% |
| 5 | Arkansas | $2,978.86 | $3,876.21 | 30.1% |
| 6 | Oregon | $2,142.36 | $2,759.91 | 28.8% |
| 7 | Arizona | $3,808.67 | $4,880.08 | 28.1% |
| 8 | Illinois | $2,105.42 | $2,691.58 | 27.8% |
| 9 | Pennsylvania | $2,127.60 | $2,694.10 | 26.6% |
| 10 | Colorado | $3,280.88 | $4,149.88 | 26.5% |
| 11 | Minnesota | $2,256.33 | $2,851.33 | 26.4% |
| 12 | Tennessee | $1,941.00 | $2,450.82 | 26.3% |
| 13 | Iowa | $2,015.92 | $2,543.08 | 26.1% |
| 13 | Virginia | $1,718.50 | $2,166.60 | 26.1% |
| 15 | Kansas | $2,395.77 | $2,999.08 | 25.2% |
| 16 | Idaho | $1,630.64 | $2,040.64 | 25.1% |
| 17 | Alabama | $2,115.00 | $2,638.73 | 24.8% |
| 17 | Wisconsin | $1,867.33 | $2,329.67 | 24.8% |
| 19 | Missouri | $2,552.50 | $3,165.58 | 24.0% |
| 19 | Washington | $2,612.09 | $3,239.46 | 24.0% |
| 19 | New Hampshire | $1,539.40 | $1,908.20 | 24.0% |
| 22 | Ohio | $1,676.18 | $2,077.55 | 23.9% |
| 22 | Massachusetts | $1,709.62 | $2,118.69 | 23.9% |
| 24 | South Dakota | $1,999.50 | $2,468.08 | 23.4% |
| 25 | Wyoming | $1,323.00 | $1,630.33 | 23.2% |
| 26 | Louisiana | $4,006.50 | $4,933.50 | 23.1% |
| 26 | Maryland | $2,536.33 | $3,122.44 | 23.1% |
| 26 | Maine | $1,253.30 | $1,542.80 | 23.1% |
| 29 | Oklahoma | $2,284.80 | $2,810.10 | 23.0% |
| 30 | Indiana | $1,703.82 | $2,088.09 | 22.6% |
| 31 | Utah | $2,215.30 | $2,703.80 | 22.1% |
| 32 | North Dakota | $1,942.82 | $2,368.27 | 21.9% |
| 33 | New Mexico | $2,363.29 | $2,859.57 | 21.0% |
| 34 | Alaska | $1,872.33 | $2,264.17 | 20.9% |
| 35 | Connecticut | $2,711.90 | $3,272.40 | 20.7% |
| 36 | Mississippi | $2,107.73 | $2,532.64 | 20.2% |
| 37 | Nebraska | $2,252.75 | $2,689.50 | 19.4% |
| 38 | District of Columbia | $2,919.40 | $3,479.00 | 19.2% |
| 39 | West Virginia | $1,705.78 | $2,029.78 | 19.0% |
| 40 | South Carolina | $1,966.67 | $2,331.00 | 18.5% |
| 41 | Montana | $2,365.86 | $2,793.57 | 18.1% |
| 42 | Hawaii | $1,562.71 | $1,824.29 | 16.7% |
| 43 | Vermont | $1,353.90 | $1,579.30 | 16.6% |
| 44 | Delaware | $2,945.56 | $3,426.89 | 16.3% |
| 45 | Georgia | $2,693.71 | $3,129.29 | 16.2% |
| 46 | Kentucky | $2,234.09 | $2,576.55 | 15.3% |
| 47 | New Jersey | $3,188.45 | $3,620.36 | 13.5% |
| 48 | New York | $2,914.82 | $3,304.91 | 13.4% |
| 48 | North Carolina | $2,914.82 | $3,304.91 | 13.4% |
| 50 | Texas | $2,642.00 | $2,971.13 | 12.5% |
| 51 | Florida | $3,411.14 | $3,832.57 | 12.4% |
By year, that’s more than $500 extra
By dollars, a speeding ticket adds $524.74 on average to a driver’s annual insurance bill across the U.S. That breaks down to an additional $43.73 a month.
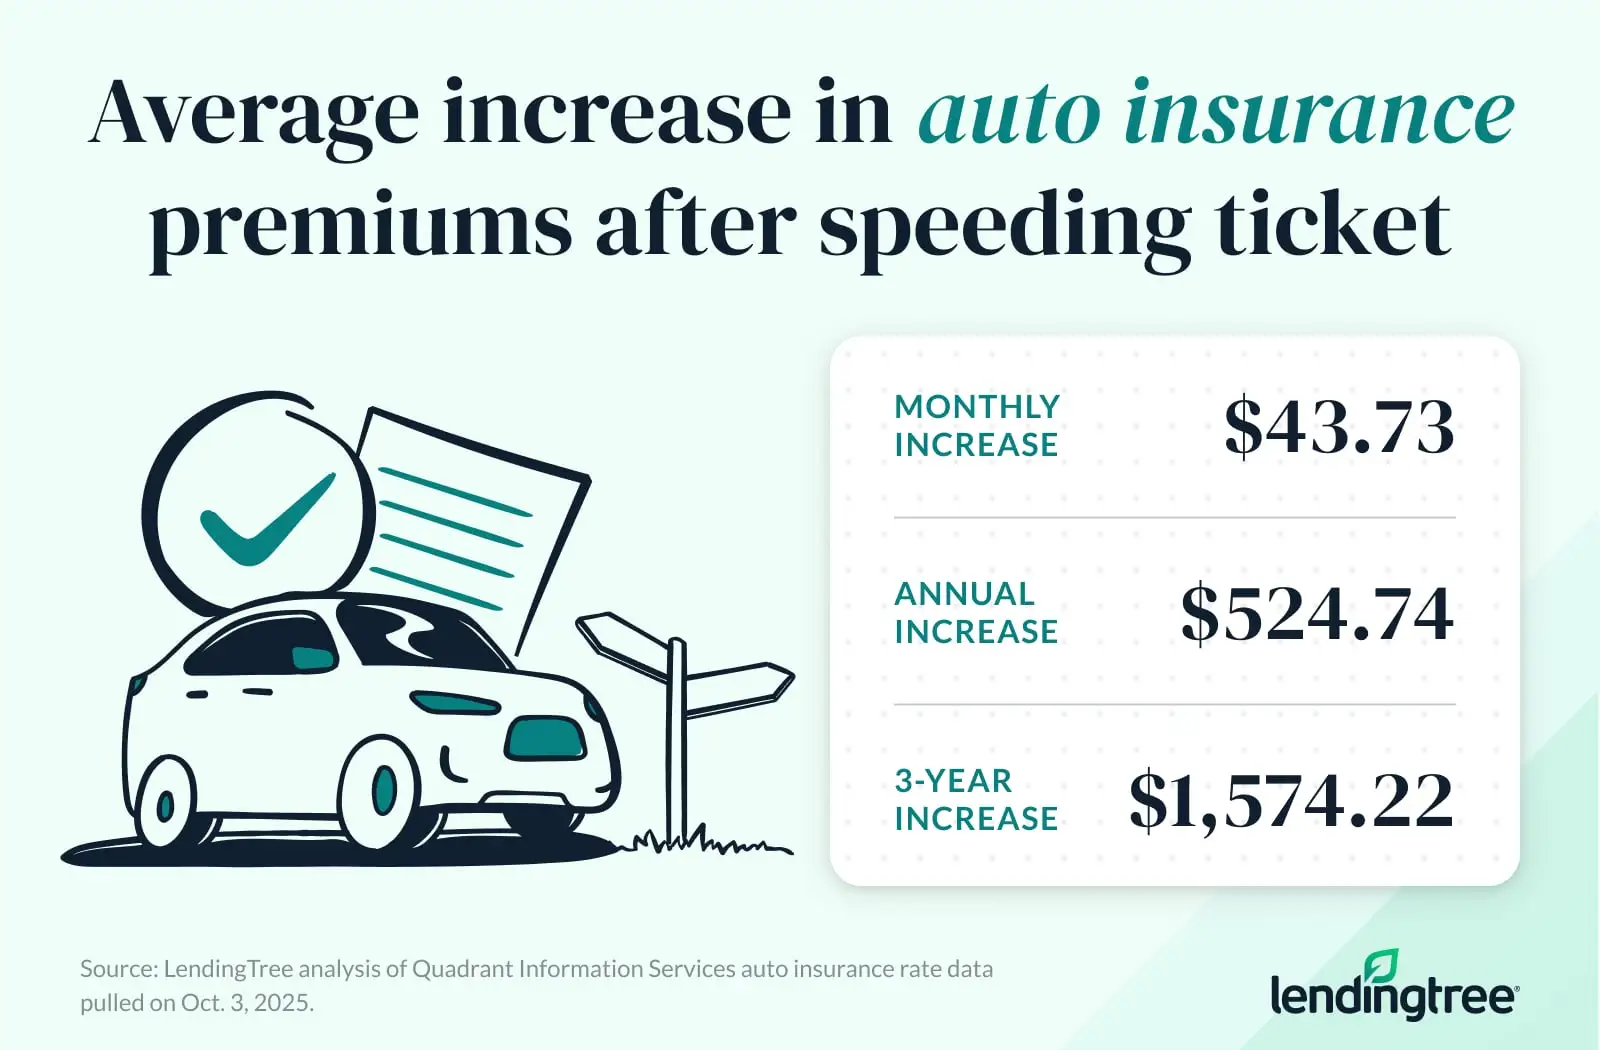
Over three years, the increase adds up to paying a significant $1,574.22 more in premiums.
Generally speaking, a speeding ticket stays on your record for three to five years — meaning it’ll stop affecting your insurance rate after that period has passed. That’s why we chose to highlight the three-year increase here as well.
Annually, rate hikes top $1,000 in Arizona and California
Notably, two Western states see rate increases of more than $1,000 annually. Following a speeding ticket, rates increase by an average of $1,071.41 in Arizona and $1,004.73 in California — the highest by state. They’re also the only states where rates increase by more than $3,000 in the three years after a ticket.
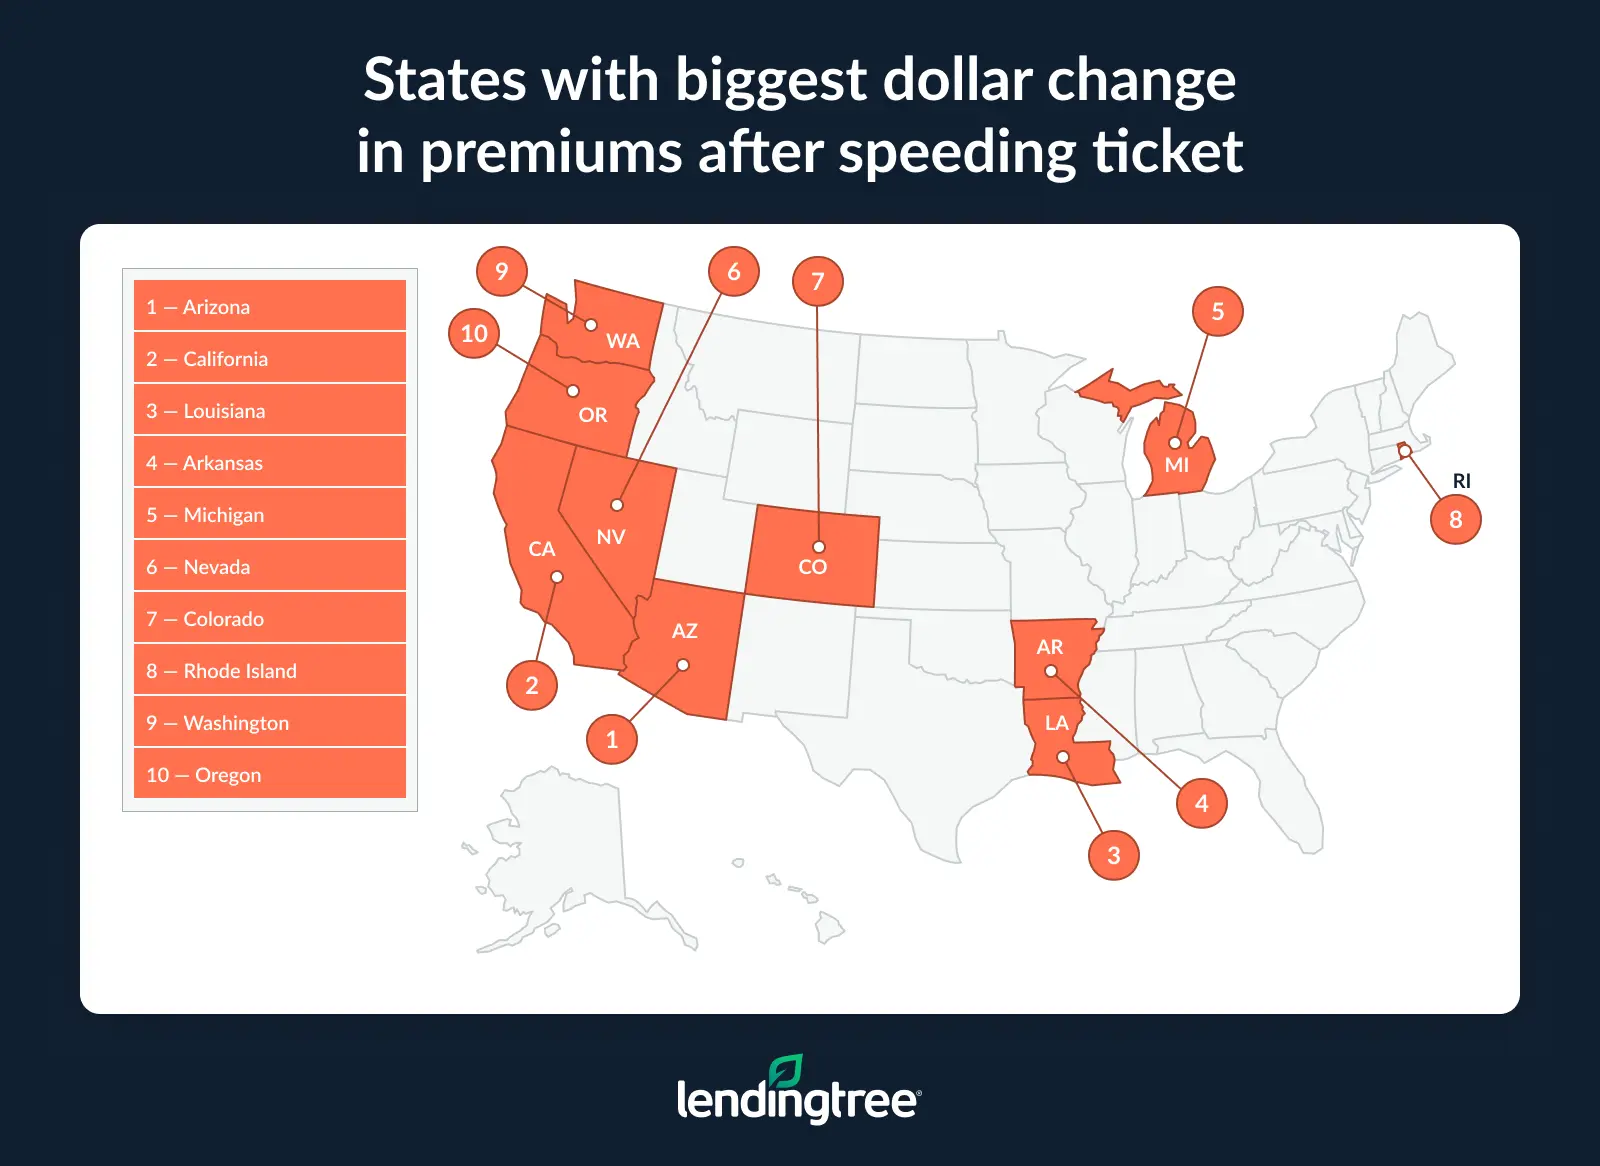
Meanwhile, Vermont ($225.40), Hawaii ($261.58) and Maine ($289.50) are the only states with annual increases below $300. Over a three-year period, just six states see increases of less than $1,000: Vermont, Hawaii, Maine, Wyoming, West Virginia and Texas.
Full rankings: States with biggest dollar increases in auto insurance premiums after speeding ticket
| Rank | State | Monthly increase after | Annual increase after | 3-year increase after |
|---|---|---|---|---|
| 1 | Arizona | $89.28 | $1,071.41 | $3,214.23 |
| 2 | California | $83.73 | $1,004.73 | $3,014.19 |
| 3 | Louisiana | $77.25 | $927.00 | $2,781.00 |
| 4 | Arkansas | $74.78 | $897.35 | $2,692.05 |
| 5 | Michigan | $73.47 | $881.60 | $2,644.80 |
| 6 | Nevada | $72.79 | $873.54 | $2,620.62 |
| 7 | Colorado | $72.42 | $869.00 | $2,607.00 |
| 8 | Rhode Island | $66.49 | $797.87 | $2,393.61 |
| 9 | Washington | $52.28 | $627.36 | $1,882.09 |
| 10 | Oregon | $51.46 | $617.55 | $1,852.64 |
| 11 | Missouri | $51.09 | $613.08 | $1,839.24 |
| 12 | Kansas | $50.28 | $603.31 | $1,809.93 |
| 13 | Minnesota | $49.58 | $595.00 | $1,785.00 |
| 14 | Illinois | $48.85 | $586.16 | $1,758.48 |
| 15 | Maryland | $48.84 | $586.11 | $1,758.33 |
| 16 | Pennsylvania | $47.21 | $566.50 | $1,699.50 |
| 17 | Connecticut | $46.71 | $560.50 | $1,681.50 |
| 18 | District of Columbia | $46.63 | $559.60 | $1,678.80 |
| 19 | Iowa | $43.93 | $527.16 | $1,581.48 |
| 20 | Oklahoma | $43.78 | $525.30 | $1,575.90 |
| 21 | Alabama | $43.64 | $523.73 | $1,571.19 |
| 22 | Tennessee | $42.48 | $509.82 | $1,529.45 |
| 23 | New Mexico | $41.36 | $496.28 | $1,488.84 |
| 24 | Utah | $40.71 | $488.50 | $1,465.50 |
| 25 | Delaware | $40.11 | $481.33 | $1,443.99 |
| 26 | South Dakota | $39.05 | $468.58 | $1,405.75 |
| 27 | Wisconsin | $38.53 | $462.33 | $1,387.00 |
| 28 | Virginia | $37.34 | $448.10 | $1,344.30 |
| 29 | Nebraska | $36.40 | $436.75 | $1,310.25 |
| 30 | Georgia | $36.30 | $435.57 | $1,306.72 |
| 31 | New Jersey | $35.99 | $431.91 | $1,295.73 |
| 32 | Montana | $35.64 | $427.71 | $1,283.14 |
| 33 | North Dakota | $35.45 | $425.45 | $1,276.35 |
| 34 | Mississippi | $35.41 | $424.91 | $1,274.73 |
| 35 | Florida | $35.12 | $421.43 | $1,264.28 |
| 36 | Idaho | $34.17 | $410.00 | $1,230.00 |
| 37 | Massachusetts | $34.09 | $409.07 | $1,227.21 |
| 38 | Ohio | $33.45 | $401.36 | $1,204.09 |
| 39 | Alaska | $32.65 | $391.83 | $1,175.50 |
| 40 | New York | $32.51 | $390.09 | $1,170.27 |
| 40 | North Carolina | $32.51 | $390.09 | $1,170.27 |
| 42 | Indiana | $32.02 | $384.27 | $1,152.81 |
| 43 | New Hampshire | $30.73 | $368.80 | $1,106.40 |
| 44 | South Carolina | $30.36 | $364.33 | $1,092.99 |
| 45 | Kentucky | $28.54 | $342.46 | $1,027.38 |
| 46 | Texas | $27.43 | $329.13 | $987.39 |
| 47 | West Virginia | $27.00 | $324.00 | $972.00 |
| 48 | Wyoming | $25.61 | $307.33 | $922.00 |
| 49 | Maine | $24.13 | $289.50 | $868.50 |
| 50 | Hawaii | $21.80 | $261.58 | $784.74 |
| 51 | Vermont | $18.78 | $225.40 | $676.20 |
Younger drivers face biggest rate hikes
By age, the percentage increase is similar across all groups. However, higher base premiums among younger drivers mean this age group pays far more overall. A 20-year-old’s premium jumps an average of $1,183.67 a year, going from $4,092.50 to $5,276.17. That’s a 28.9% increase.
Comparatively, a driver in their 60s has the lowest dollar increase. Though the percentage increase is a slightly higher 30.7%, their rates go from $1,783.08 to $2,331.17 — a jump of just $548.09.
Change in auto insurance premiums after speeding ticket by age
| Age | Avg. annual premium before | Avg. annual premium after | % difference | $ difference |
|---|---|---|---|---|
| 20 | $4,092.50 | $5,276.17 | 28.9% | $1,183.67 |
| 30 | $2,105.42 | $2,691.58 | 27.9% | $586.16 |
| 40 | $1,967.42 | $2,534.33 | 28.8% | $566.91 |
| 50 | $1,855.50 | $2,409.75 | 29.8% | $554.25 |
| 60 | $1,783.08 | $2,331.17 | 30.7% | $548.09 |
| 70 | $2,016.00 | $2,657.92 | 31.8% | $641.92 |
| 80 | $2,613.92 | $3,432.00 | 31.3% | $818.08 |
Bhatt says this difference likely boils down to how insurance companies determine rates.
“Insurance companies conduct a lot of research on crash rates,” he says. “Crashes cost insurance companies money in the form of claims payments. They generally account for these costs by charging higher rates to riskier drivers.”
Recovering from speeding ticket: Top expert tips
If you’re struggling to afford insurance, a speeding ticket can be a big blow. There are several things you can do to lower rates after the fact, though. We recommend the following:
- Take advantage of diversion programs. If your state offers any diversion programs, completing one can keep a speeding ticket off your record. “Having to spend time in a defensive driving class may seem like a pain, but it can save you money,” Bhatt says. “You may also pick up some useful driving tips.”
- Shop around. “A ticket usually doesn’t affect your insurance rate until your policy’s next renewal date,” he says. “That gives you time to get quotes from other companies to see if you can get a lower rate. Some companies raise their rates by lower amounts than others after a speeding ticket. Comparing quotes is a good way to find a company with the cheapest rates for your situation.”
- Consider raising your collision deductible. Check to see if you have this coverage on your policy. If so, raising the deductible is something that can help lower your rate anytime, whether you have a ticket or not.
- Avoid additional violations. “Your insurance rates will eventually come down after a speeding ticket, provided you avoid additional tickets and at-fault accidents,” Bhatt says. “In this respect, a speeding ticket is a wake-up call. It’s an alert to drive more carefully in the future.”
Methodology
LendingTree uses insurance rate data from Quadrant Information Services based on publicly sourced insurance company filings. Rates reflect an analysis of hundreds of thousands of car insurance quotes for a typical driver and are intended for comparative purposes only. Your rates may vary based on factors such as location, driving history, age, credit profile and insurer.
Unless otherwise noted, quotes represent a full coverage policy for a 30-year-old man with good credit and a clean driving record who drives a 2018 Honda CR-V EX.
Rates were compared before and after the driver received a first-time speeding violation for driving 11 to 15 mph over the posted limit to illustrate the impact of a minor speeding ticket on insurance premiums. The 11 to 15 mph range was selected based on findings from various national and statewide analyses, such as the Washington State Driving Behavior Analysis (2024), the Journal of Safety Research study on speeding behavior and risk factors via ScienceDirect (2021) and the National Highway Traffic Safety Administration (NHTSA). These studies identify driving 10 mph or more over the limit as a common and representative speeding behavior.
We also used the same methodology to analyze how the impact of a speeding ticket varies by driver age before and after a speeding ticket.
Minimum liability policies include only the state’s required minimum coverage limits.
Full coverage policies include collision, comprehensive and liability coverage with the following limits and deductibles:
- Bodily injury liability: $50,000 per person and $100,000 per accident
- Property damage liability: $50,000
- Uninsured and underinsured motorist bodily injury: $50,000 per person and $100,000 per accident
- Personal injury protection: Minimum limits, where required by law
- Collision: $500 deductible
- Comprehensive: $500 deductible
LendingTree researchers also gathered publicly available data on speeding violations and driver point systems from a variety of state government and traffic safety sources, including Departments of Motor Vehicles, Departments of Transportation and state legislative or administrative code databases. Data was accessed in October 2025.