Average Car Payment and Auto Loan Statistics: 2026
The average monthly payment for a new vehicle reached a record $770 in the first quarter of 2026, up 2.9% from a year earlier.
Average monthly payments for used vehicles and leased vehicles rose 1.5% and 3.2%, respectively, during the same period.
LendingTree analyzed payments, loan originations, term lengths, delinquencies and other data to provide a comprehensive snapshot of U.S. auto loan debt and lending trends.
Here are the key auto loan statistics for 2026.
- Average monthly payments for new, used and leased vehicles increased year over year. According to Experian, the average new-vehicle payment rose 2.9% from the first quarter of 2025 to the first quarter of 2026. During the same period, average payments for used vehicles and leased vehicles increased by 1.5% and 3.2%, respectively. Average monthly payments reached $770 for new vehicles, $531 for used vehicles and $619 for leased vehicles.
- New-vehicle prices increased, while used-car and truck prices declined. According to the U.S. Bureau of Labor Statistics (BLS) June 2026 consumer price index (CPI), new-vehicle prices rose 0.2% year over year, while used-car and truck prices fell 2.0%. Experian data shows that Americans borrow an average of $43,925 for new vehicles and $27,070 for used vehicles.
- Auto loan debt is the second-largest category of consumer debt after mortgages. According to the Federal Reserve Bank of New York, Americans owe $1.685 trillion in auto loan debt, representing 9.0% of total consumer debt.
- Americans originated $182.1 billion in new auto loans in the first quarter of 2026. According to the New York Fed, borrowers ages 18 to 49 accounted for $103.9 billion of that total, compared with $77.8 billion among borrowers ages 50 and older.
- Auto loan repayment terms remain lengthy. According to Experian, the average term is 69.5 months for new-vehicle loans, 67.7 months for used-vehicle loans and 36.7 months for leased vehicles.
- 90-day auto loan delinquency rates increased from a year earlier. According to the New York Fed, 5.6% of outstanding auto debt was at least 90 days delinquent in the first quarter of 2026, up 12.2% from a year earlier. Meanwhile, 7.7% of auto loans became 30 days past due in the first quarter of 2026, down 3.4% from the first quarter of 2025.
- Borrowers with prime and super-prime credit scores account for most retail vehicle financing. According to Experian, borrowers with credit scores of 661 or higher account for 68.4% of retail vehicle financing, compared with 15.8% for subprime and deep-subprime borrowers with credit scores of 600 or lower.
- The Ford F-150, Chevrolet Silverado 1500 and Toyota Camry were the vehicle models most frequently considered by consumers on the LendingTree platform in the first quarter of 2026. The F-150 ranked first for the second consecutive quarter.
Average monthly vehicle payments rise year over year
According to Experian data for the first quarter of 2026, the average monthly payment for new vehicles reached a record $770, up 2.9% from a year earlier. The average monthly payment for a used vehicle was $531, a 1.5% increase over the same period. Meanwhile, the average monthly payment on a new vehicle lease was $619, up 3.2% year over year.
Annual changes in average monthly car payments
| Vehicle purchase type | Q1 2025 | Q1 2026 | Difference ($) | Difference (%) |
|---|---|---|---|---|
| New vehicle | $748 | $770 | $22 | 2.9% |
| Used vehicle | $523 | $531 | $8 | 1.5% |
| New vehicle lease | $600 | $619 | $19 | 3.2% |
Borrowers with credit scores of 601 to 660 (nonprime) and 501 to 600 (subprime) make the highest average monthly payments on new vehicles, at $811 and $792, respectively.
Average monthly car payments by credit score range
| Credit score range | New vehicles | Used vehicles | New leased vehicles |
|---|---|---|---|
| All | $770 | $531 | $619 |
| 781 to 850 (super-prime) | $753 | $529 | $626 |
| 661 to 780 (prime) | $774 | $516 | $611 |
| 601 to 660 (nonprime) | $811 | $539 | $622 |
| 501 to 600 (subprime) | $792 | $551 | $614 |
| 300 to 500 (deep subprime) | $763 | $558 | $618 |
Use the LendingTree auto loan calculator to estimate your monthly vehicle payment.
New-vehicle prices rise while used-car and truck prices fall
According to the U.S. Bureau of Labor Statistics (BLS) June 2026 consumer price index (CPI), new-vehicle prices increased 0.2% year over year. Meanwhile, used-car and truck prices declined 2.0% from a year earlier, offering some relief for consumers shopping in the used-vehicle market.
Average new-vehicle loan approaches $44,000
According to Experian, the average auto loan amount in the first quarter of 2026 was $43,925 for new vehicles and $27,070 for used vehicles. The average new-vehicle loan increased from $43,582 in the previous quarter, while the average used-vehicle loan declined from $27,528.
Among new-vehicle buyers, borrowers in the prime credit tier (661 to 780) take out the largest loans, averaging $46,244. For used vehicles, borrowers in the super-prime credit tier (781 to 850) have the largest average loan amount, at $29,599.
Average auto loans by credit score range
| Credit score range | New vehicles | Used vehicles |
|---|---|---|
| All | $43,925 | $27,070 |
| 781 to 850 | $42,283 | $29,599 |
| 661 to 780 | $46,224 | $28,429 |
| 601 to 660 | $45,947 | $26,014 |
| 501 to 600 | $40,460 | $22,779 |
| 300 to 500 | $36,236 | $21,408 |
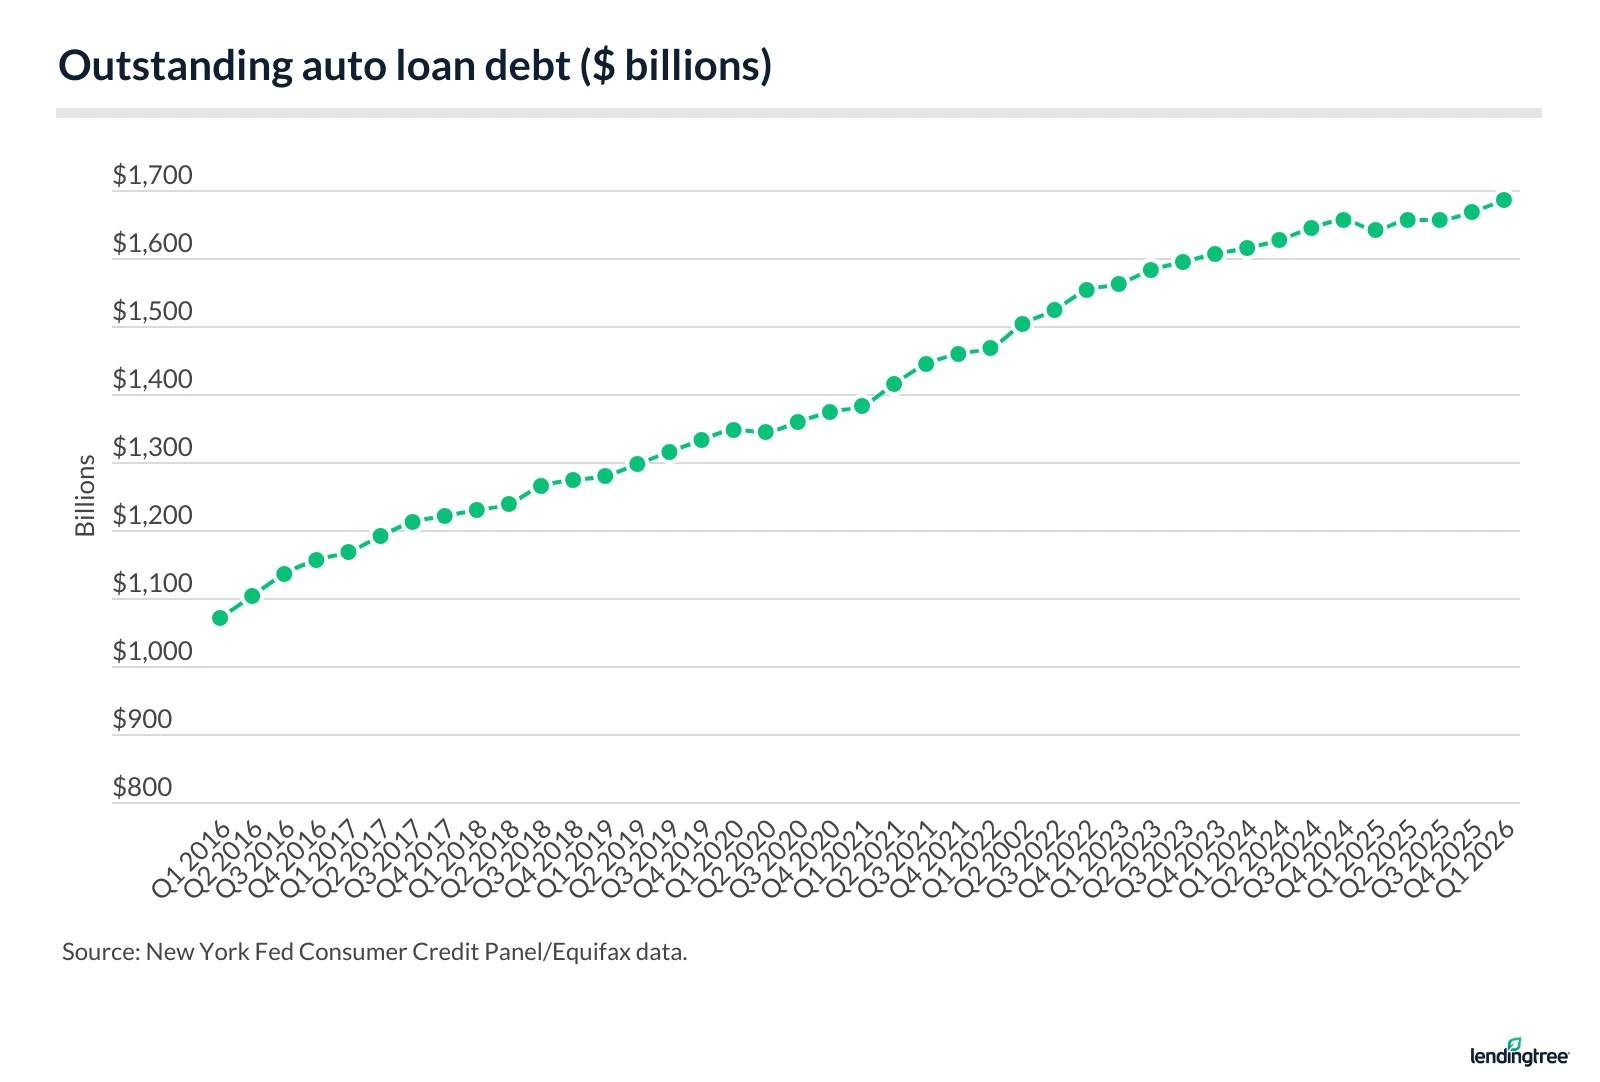
Americans owe $1.685 trillion in auto loan debt
According to the Federal Reserve Bank of New York, outstanding auto loan debt increased 57.3% between the first quarter of 2016 and the first quarter of 2026, rising from $1.071 trillion to $1.685 trillion.
During that period, a quarter-over-quarter decline occurred in the second quarter of 2020, the first full quarter affected by the COVID-19 pandemic. Another decline occurred between Q4 2024 and Q1 2025. Auto loan debt was unchanged between the second and third quarters of 2025 before resuming its upward trend in the fourth quarter of 2025 and first quarter of 2026.
Outstanding auto debt
| Quarter | Outstanding auto debt (trillions) |
|---|---|
| Q1 2026 | $1.685 |
| Q4 2025 | $1.667 |
| Q3 2025 | $1.655 |
| Q2 2025 | $1.655 |
| Q1 2025 | $1.642 |
| Q4 2024 | $1.655 |
| Q3 2024 | $1.644 |
| Q2 2024 | $1.626 |
| Q1 2024 | $1.616 |
| Q4 2023 | $1.607 |
| Q3 2023 | $1.595 |
| Q2 2023 | $1.582 |
| Q1 2023 | $1.562 |
| Q4 2022 | $1.552 |
| Q3 2022 | $1.524 |
| Q2 2022 | $1.502 |
| Q1 2022 | $1.469 |
| Q4 2021 | $1.458 |
| Q3 2021 | $1.443 |
| Q2 2021 | $1.415 |
| Q1 2021 | $1.382 |
| Q4 2020 | $1.374 |
| Q3 2020 | $1.360 |
| Q2 2020 | $1.343 |
| Q1 2020 | $1.346 |
| Q4 2019 | $1.331 |
| Q3 2019 | $1.315 |
| Q2 2019 | $1.297 |
| Q1 2019 | $1.280 |
| Q4 2018 | $1.274 |
| Q3 2018 | $1.265 |
| Q2 2018 | $1.238 |
| Q1 2018 | $1.229 |
| Q4 2017 | $1.221 |
| Q3 2017 | $1.213 |
| Q2 2017 | $1.190 |
| Q1 2017 | $1.167 |
| Q4 2016 | $1.157 |
| Q3 2016 | $1.135 |
| Q2 2016 | $1.103 |
| Q1 2016 | $1.071 |
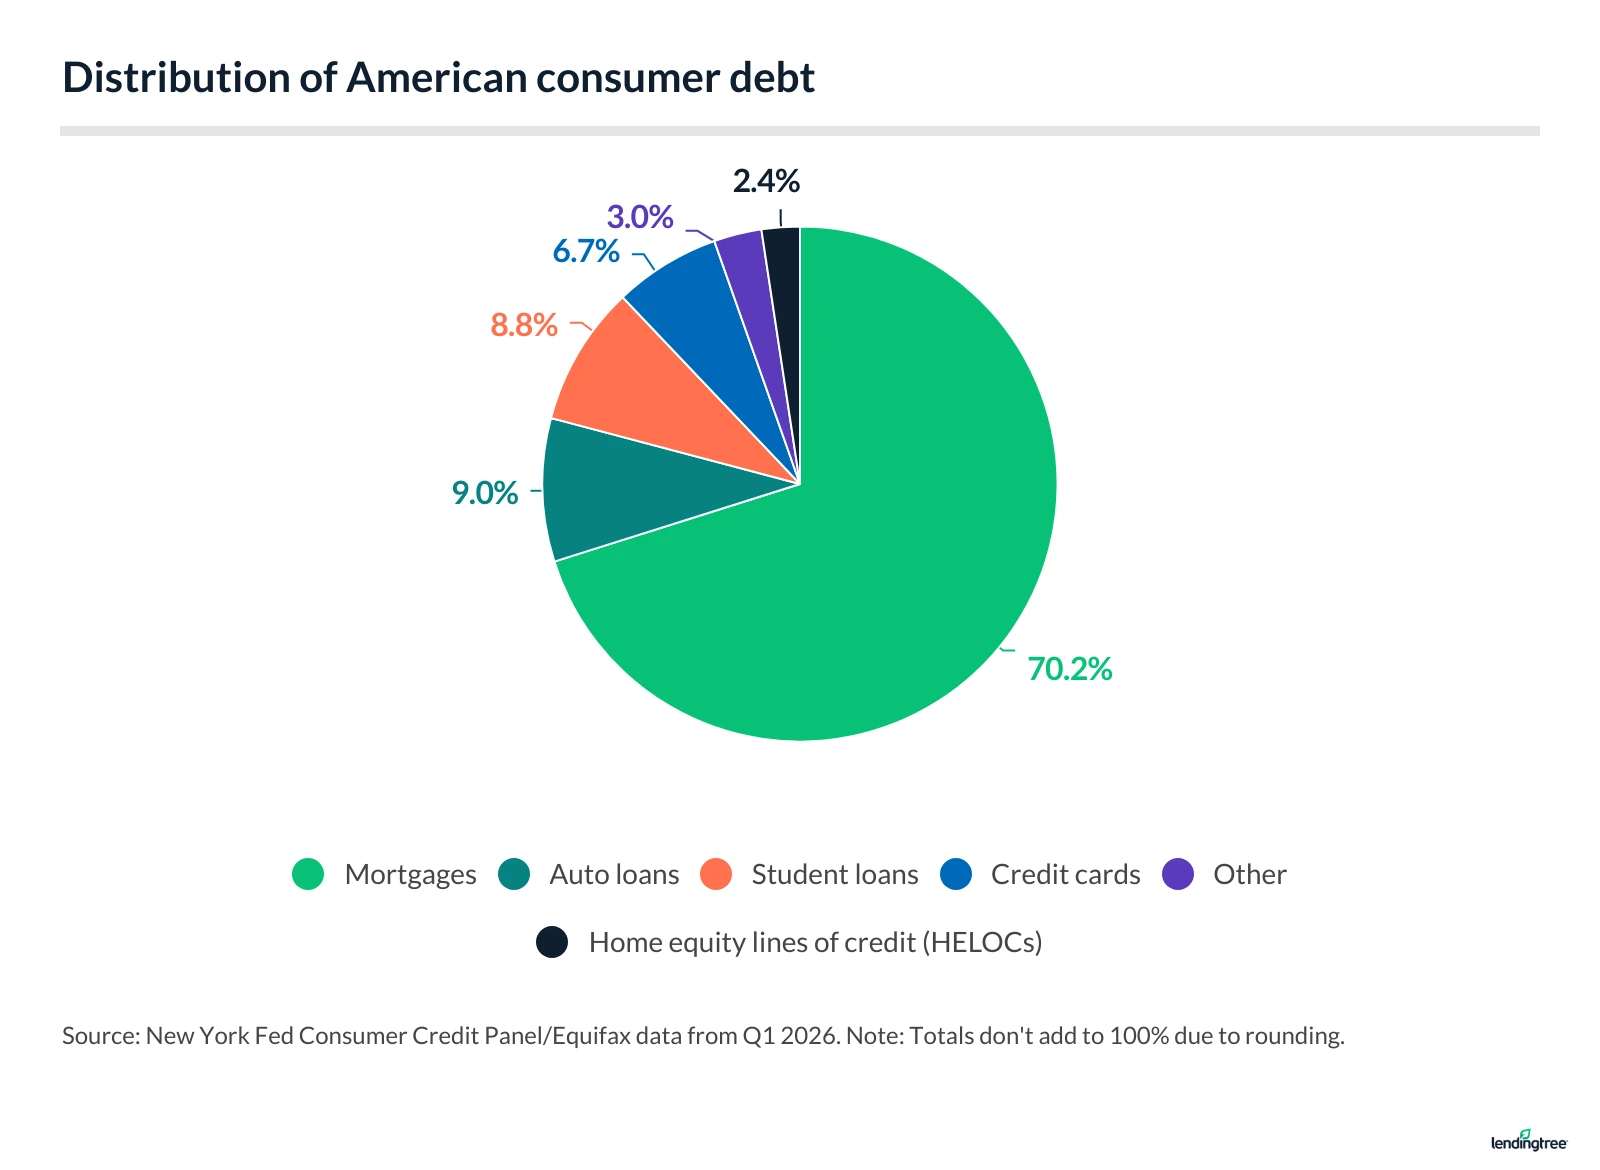
Auto loans account for 9.0% of consumer debt
According to the New York Fed, mortgages make up the largest share of U.S. consumer debt at 70.2%, while auto loans account for 9.0%. As of the first quarter of 2026, outstanding auto loan debt totaled $1.685 trillion, slightly exceeding the $1.658 trillion in student loan debt.
Americans originated $182.1 billion in auto loans in Q1 2026
Americans originated $123.9 billion in auto loans in the first quarter of 2016. By the first quarter of 2026, that figure had risen to $182.1 billion, according to the New York Fed.
The table below shows quarterly auto loan originations over the period:
Quarterly volume of auto loan originations
| Quarter | Auto loan originations (billions) |
|---|---|
| Q1 2026 | $182.1 |
| Q4 2025 | $180.8 |
| Q3 2025 | $183.9 |
| Q2 2025 | $187.9 |
| Q1 2025 | $165.6 |
| Q4 2024 | $175.1 |
| Q3 2024 | $184.2 |
| Q2 2024 | $179.1 |
| Q1 2024 | $165.5 |
| Q4 2023 | $164.9 |
| Q3 2023 | $179.3 |
| Q2 2023 | $179.0 |
| Q1 2023 | $161.7 |
| Q4 2022 | $186.2 |
| Q3 2022 | $185.4 |
| Q2 2022 | $198.8 |
| Q1 2022 | $176.6 |
| Q4 2021 | $180.5 |
| Q3 2021 | $198.8 |
| Q2 2021 | $201.9 |
| Q1 2021 | $152.7 |
| Q4 2020 | $161.6 |
| Q3 2020 | $168.2 |
| Q2 2020 | $135.9 |
| Q1 2020 | $150.3 |
| Q4 2019 | $158.6 |
| Q3 2019 | $159.1 |
| Q2 2019 | $155.6 |
| Q1 2019 | $139.1 |
| Q4 2018 | $144.3 |
| Q3 2018 | $157.6 |
| Q2 2018 | $151.2 |
| Q1 2018 | $130.9 |
| Q4 2017 | $137.2 |
| Q3 2017 | $150.6 |
| Q2 2017 | $148.4 |
| Q1 2017 | $132.4 |
| Q4 2016 | $142.0 |
| Q3 2016 | $149.8 |
| Q2 2016 | $148.9 |
| Q1 2016 | $123.9 |
Americans in their 30s and 40s originate the most auto loan debt
According to the New York Fed, borrowers in their 30s and 40s originated the largest amounts of auto loan debt in the first quarter of 2026, totaling $38.6 billion and $40.0 billion, respectively.
Borrowers in their 50s originated $38.3 billion in auto loan debt, while those in their 60s originated $25.3 billion. Consumers ages 18 to 29 also originated $25.3 billion, matching the total among borrowers in their 60s.
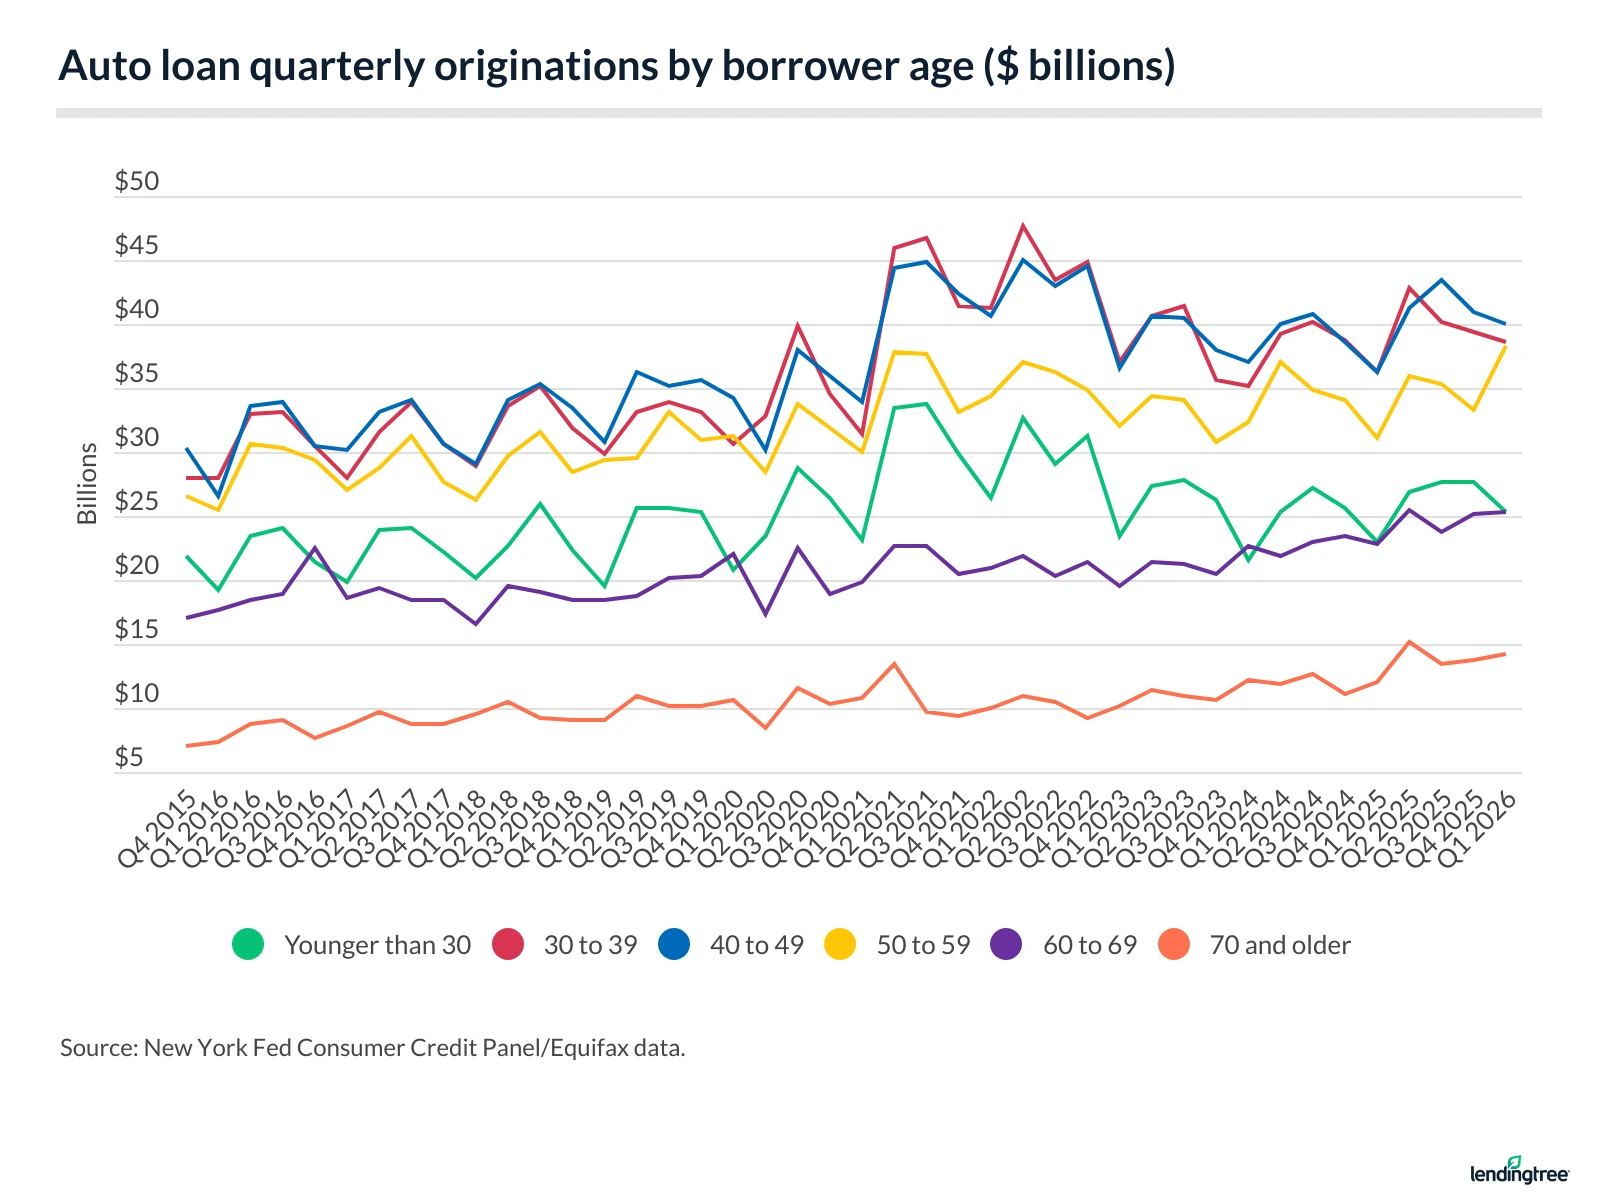
When combined, Americans ages 18 to 49 took out $103.9 billion in auto debt in Q1 2026. That compares with $77.8 billion for those 50 and older.
Borrowers with the highest credit scores account for the largest share of auto loan originations
Borrowers with the highest credit scores continue to account for the largest volume of auto loan originations. In the first quarter of 2026, borrowers with credit scores of 720 or higher originated $99.4 billion in auto loan debt. According to the New York Fed, all other credit tiers accounted for $82.6 billion.
Auto loan originations by credit score
| Quarter | Less than 620 | 620 to 659 | 660 to 719 | 720 to 759 | 760+ |
|---|---|---|---|---|---|
| Q1 2026 | $28.4 billion | $21.5 billion | $32.7 billion | $21.4 billion | $78.0 billion |
| Q4 2025 | $31.8 billion | $17.5 billion | $37.3 billion | $26.2 billion | $68.1 billion |
| Q3 2025 | $27.6 billion | $17.5 billion | $35.8 billion | $29.6 billion | $73.4 billion |
| Q2 2025 | $30.4 billion | $17.7 billion | $36.1 billion | $28.6 billion | $75.1 billion |
| Q1 2025 | $25.7 billion | $14.0 billion | $32.9 billion | $24.8 billion | $68.1 billion |
Average auto loan terms remain lengthy
According to Experian, the average term for a new-vehicle loan is 69.5 months. Used-vehicle loans are nearly as long, averaging 67.7 months despite their smaller loan amounts.
Average term lengths by credit score range
| Credit score range | New vehicle loans | Used vehicle loans | New leased vehicles |
|---|---|---|---|
| All | 69.5 | 67.7 | 36.7 |
| 781 to 850 | 65.0 | 66.1 | 36.2 |
| 661 to 780 | 72.5 | 68.9 | 36.9 |
| 601 to 660 | 75.5 | 68.7 | 37.4 |
| 501 to 600 | 74.6 | 66.9 | 37.3 |
| 300 to 500 | 73.5 | 65.8 | 37.0 |
New-vehicle loan terms are even longer among nonprime borrowers, exceeding six years on average. Borrowers with credit scores of 601 to 660 have the longest average new-vehicle loan term, at 75.5 months. By comparison, super-prime borrowers with credit scores of 781 to 850 have the shortest average term, at 65.0 months.
“That’s such a long time to be stuck paying for a depreciating asset,” LendingTree chief consumer finance analyst Matt Schulz says. “It can have an enormous impact on a family’s finances. That money going toward a car payment isn’t earning interest and funding your emergency savings, your retirement nest egg, a mortgage down payment or your kid’s college fund. Yes, our vehicles are important. In much of the country, you can’t get around without one. And, yes, we love fancy new cars, even new-to-us cars. They’re fun to drive and show off. However, once that initial glow wears off and you’re still making a big monthly payment on that vehicle after five-plus years, it may not seem worth it.”
The average term for a new-vehicle lease is 36.7 months.
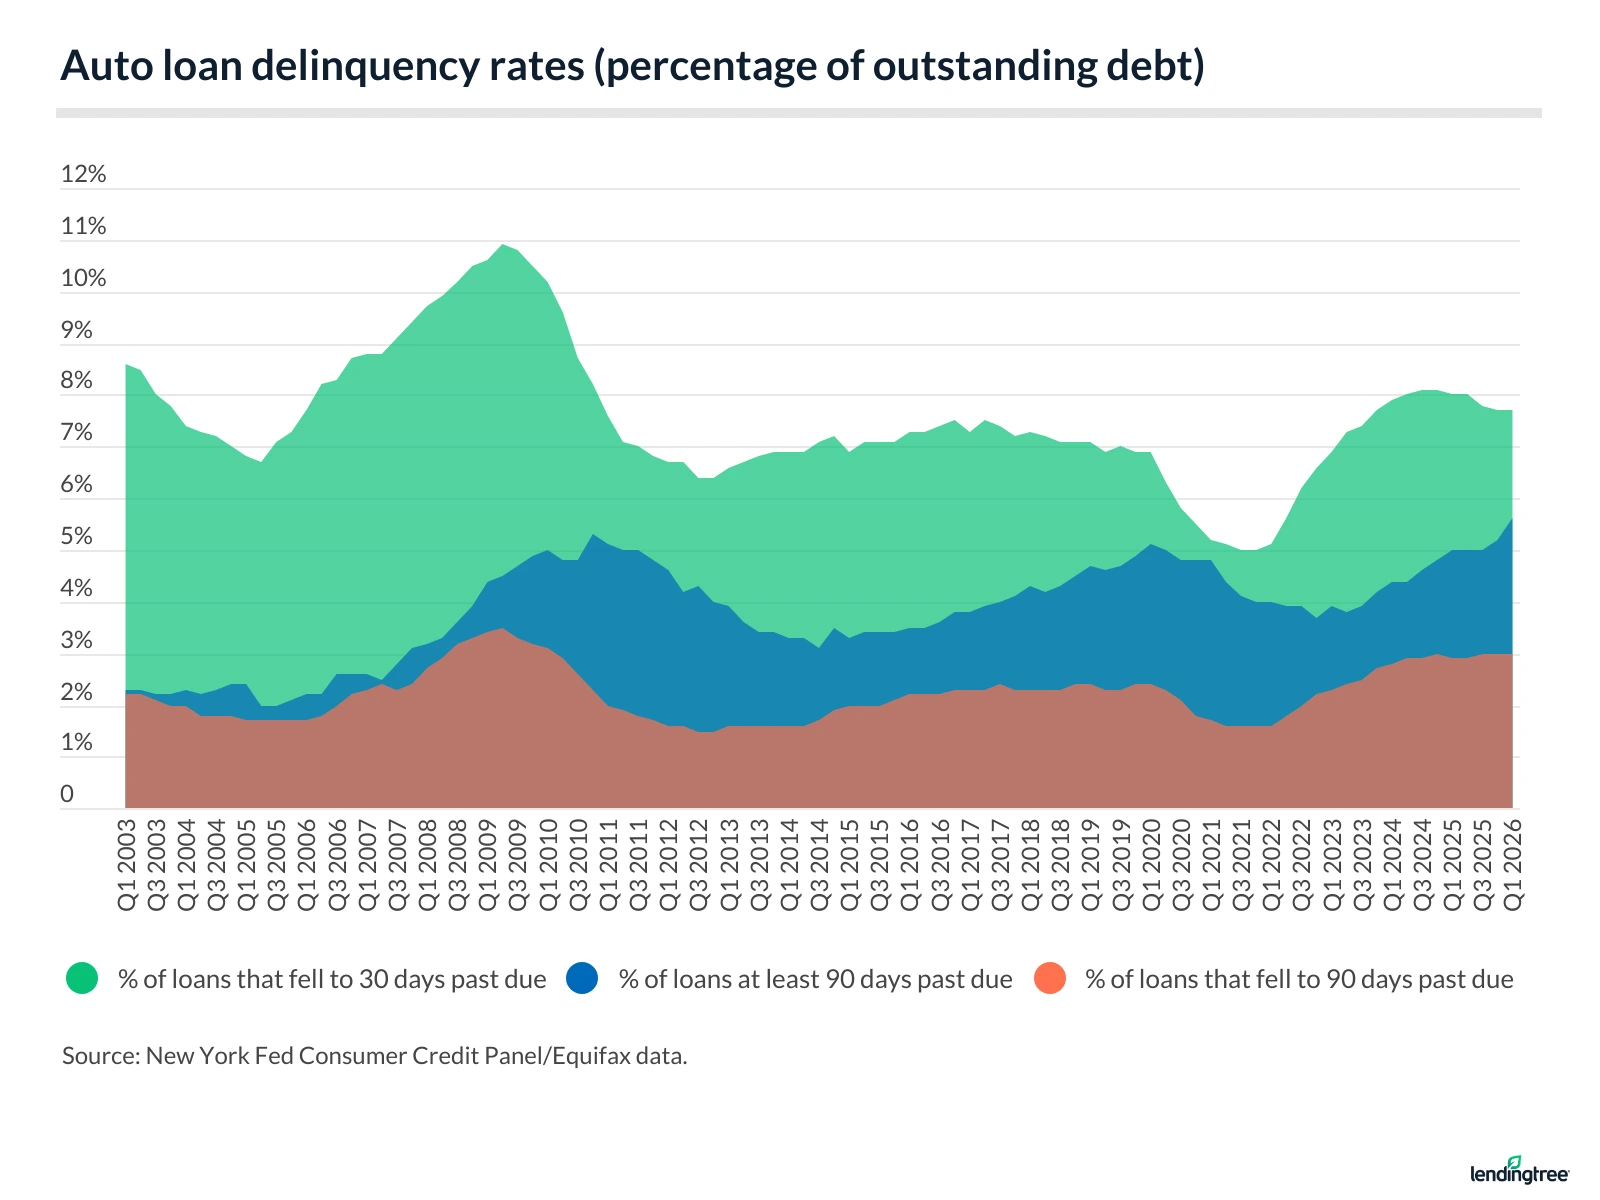
90-day auto loan delinquency rate reaches a record high
According to New York Fed data, the share of auto loan balances that were at least 90 days delinquent previously peaked at 5.3% in the fourth quarter of 2010. That rate reached 5.6% in the first quarter of 2026, surpassing the prior peak.
The share of auto loans transitioning into 30-day delinquency peaked at 10.9% in the second quarter of 2009. Beginning in 2011, the rate remained at or below 8.0% until it increased to 8.1% in the third and fourth quarters of 2024. It then eased to 8.0% in the first and second quarters of 2025 before falling to 7.7% in the fourth quarter of 2025 and the first quarter of 2026.
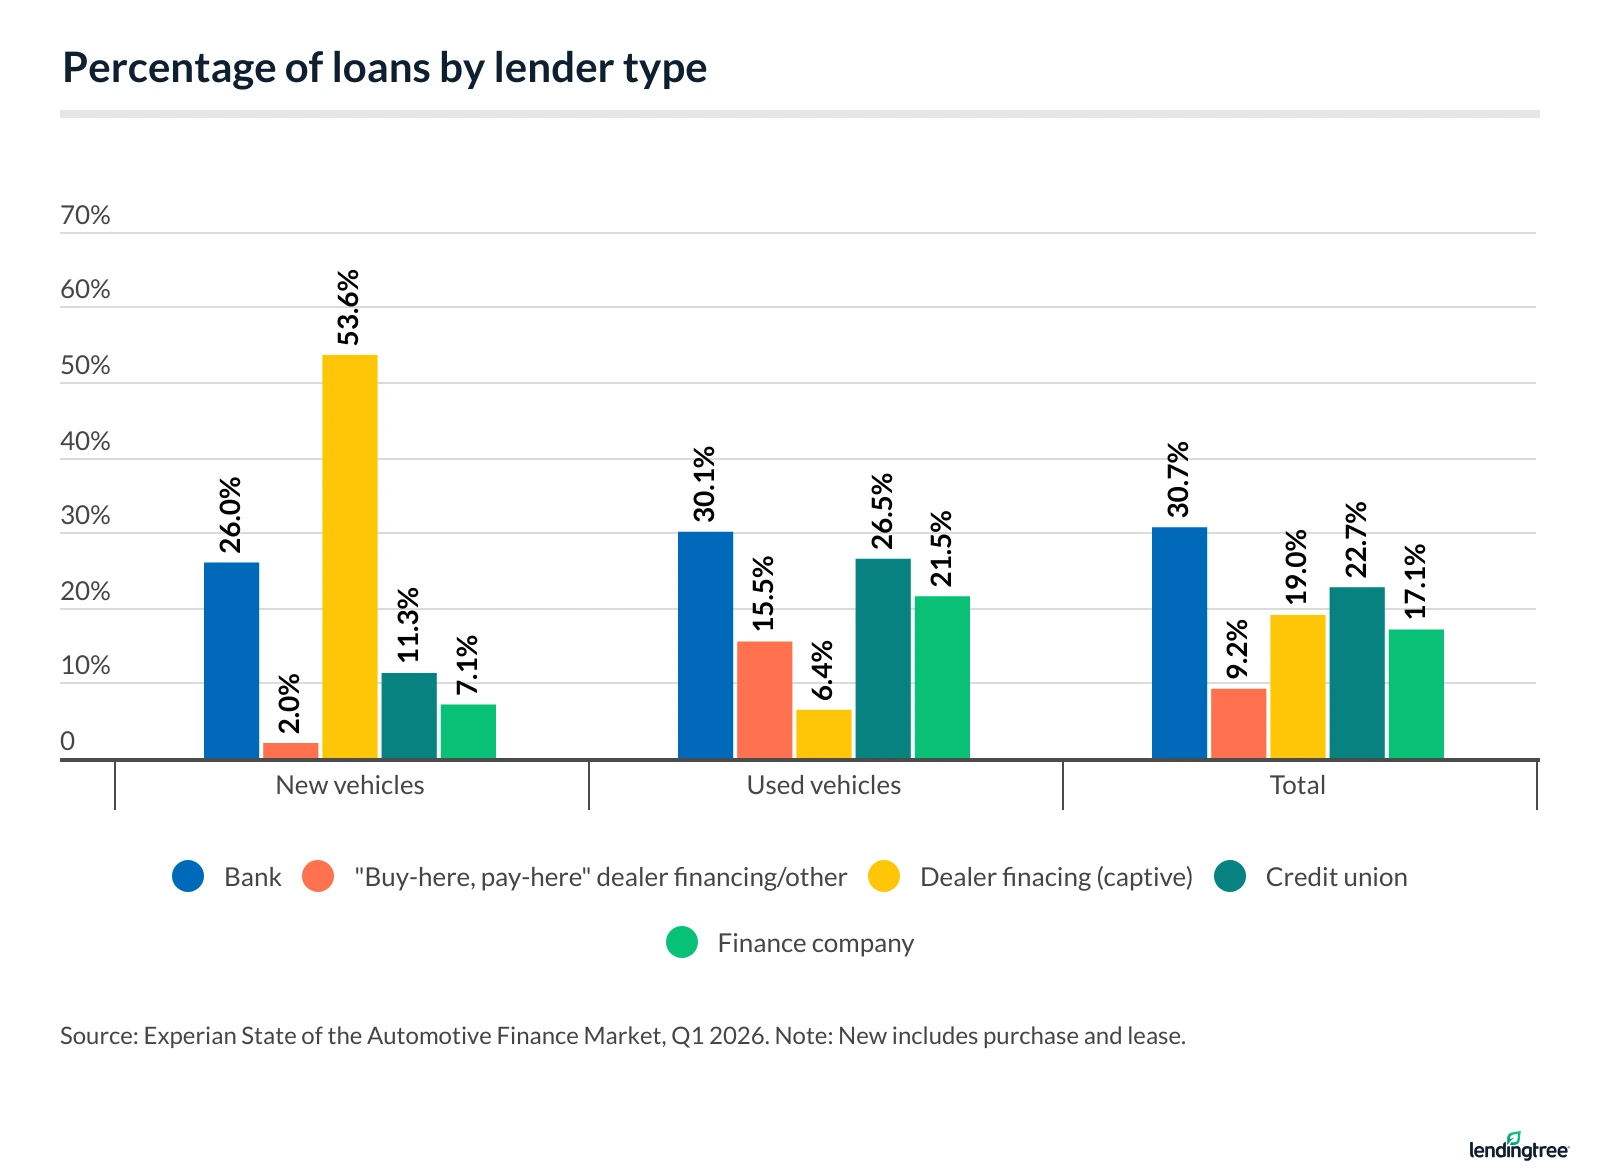
Banks and credit unions remain the leading sources of auto financing
As of the first quarter of 2026, banks held the largest share of the auto financing market at 30.7%, followed by credit unions at 22.7% and captive lenders — manufacturers’ financing arms — at 19.0%.
Buy-here, pay-here dealerships accounted for as much as 15.5% of the used-vehicle financing market. By comparison, captive lenders represented just 6.4% of used-vehicle financing.
Schulz — also the author of “Ask Questions, Save Money, Make More: How to Take Control of Your Financial Life” — cautions that buy-here, pay-here financing can carry significant risks. Vehicle prices may be higher, interest rates can resemble credit card rates rather than traditional auto loan rates, and borrowers may face additional fees. Some lenders also require more frequent payment schedules than the standard monthly payment. In some cases, dealers may require tracking devices that can help locate or repossess vehicles if payments are missed.
For many borrowers, these loans are best viewed as a last-resort financing option, though available choices often depend on credit history and credit score.
“Good credit means more good options, and that’s a big deal,” Schulz says. “You must shop around. If you finance through the car seller, you’re very likely to overpay. Use sites to compare auto loan offers easily. You could also visit multiple lenders online on your own — consider looking at credit unions if you do. Once you’ve found a deal you’re happy with, get preapproved by the lender. That preapproval gives you leverage over the car seller because they know you won’t be happy with a bad offer.”
Sources
- Experian
- U.S. Bureau of Labor Statistics
- Federal Reserve Bank of New York
- LendingTree
Get auto loan offers from up to 5 lenders in minutes