State of Home Insurance: 2025


If owning a home wasn’t expensive enough, homeowners across the country feel the sting of rising premiums. In fact, home insurance rates have spiked 40.4% cumulatively across the U.S. in six years, according to a LendingTree analysis.
Here’s what else we found in State of Home Insurance: 2025.
Key findings
- Home insurance rates climbed 40.4% cumulatively across the U.S. over six years. From 2019 through 2021, rates stayed relatively level, with 2021 seeing the biggest jump at 3.0%. Rates have since risen faster, with increases of 5.4%, 11.0% and 11.4% in 2022, 2023 and 2024, respectively. That’s a concerning trend for homeowners.
- In those same six years, home insurance rates rose the most in Colorado. Home insurance rates jumped by 76.6% cumulatively in Colorado from 2019 through 2024. Nebraska (72.3%) and Utah (70.6%) followed. The smallest cumulative increases were in Vermont (12.2%), Alaska (12.9%) and Maine (17.9%).
- Home insurance rates jumped 11.4% last year. The states with the biggest increases in 2024 were Montana and Nebraska, both at 22.1%. Minnesota and Washington followed at 19.5%. No state saw a decrease in its home insurance rates in 2024.
- The average annual cost of home insurance across the U.S. is $2,801. Two states have an average rate more than double the U.S. average: Oklahoma ($6,133) and Nebraska ($5,912). The lowest average rate is $632 in Hawaii — the only state under four figures. California ($1,260) and Vermont ($1,339) are the next closest.
Home insurance rates rise 40.4% over 6 years
From 2019 through 2024, home insurance rates rose by a staggering 40.4% cumulatively across the U.S.
The majority of those rate increases happened in the latter half of the period analyzed. Home insurance rates rose by just 2.0% in 2019.
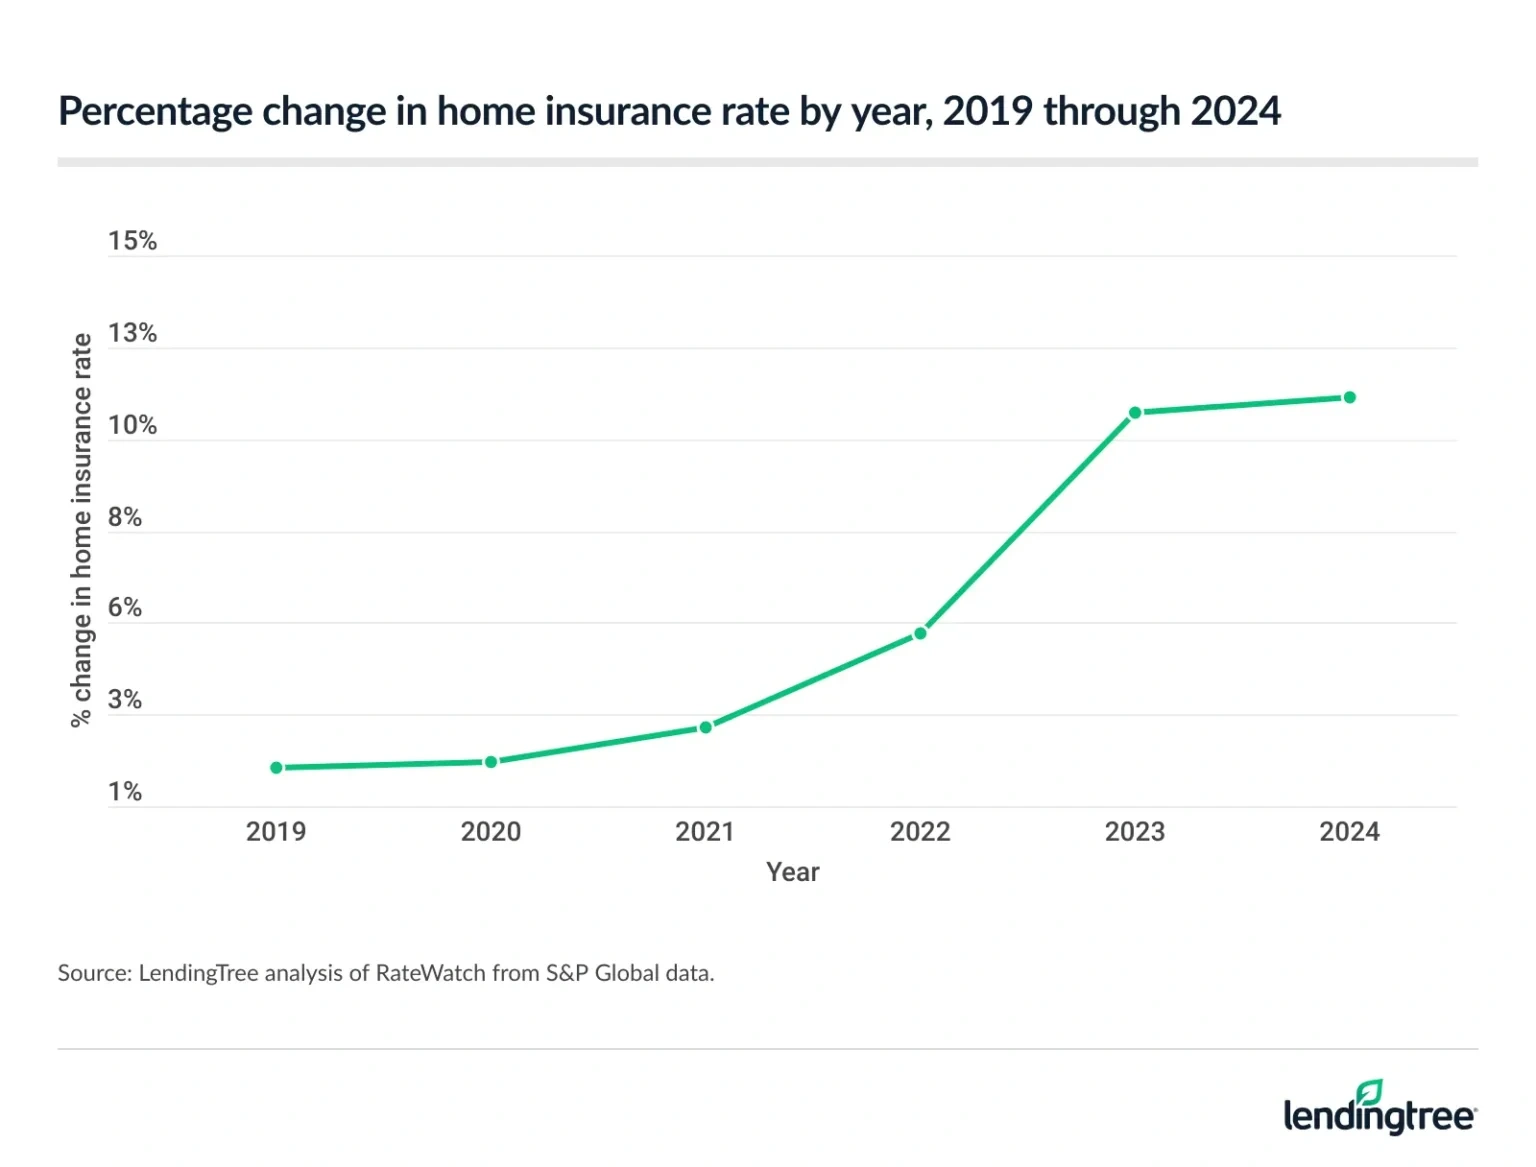
Percentage change in home insurance rate by year, 2019 through 2024
| Year | % change |
|---|---|
| 2024 | 11.4% |
| 2023 | 11.0% |
| 2022 | 5.4% |
| 2021 | 3.0% |
| 2020 | 2.1% |
| 2019 | 2.0% |
Meanwhile, rates rose by a much more significant 11.4% in 2024 — the highest by year in this period.
LendingTree home insurance expert and licensed insurance agent Rob Bhatt says this is consistent with industrywide trends during the first half of the decade.
“Insurance companies have been raising their rates to keep up with their escalating expenses,” he says. “The early 2020s saw an uptick in natural disasters and inflation. Insurance companies have had to rebuild more homes than normal, and the cost of rebuilding each one has become more expensive.”
LendingTree winter disasters study
Colorado sees biggest rate hike
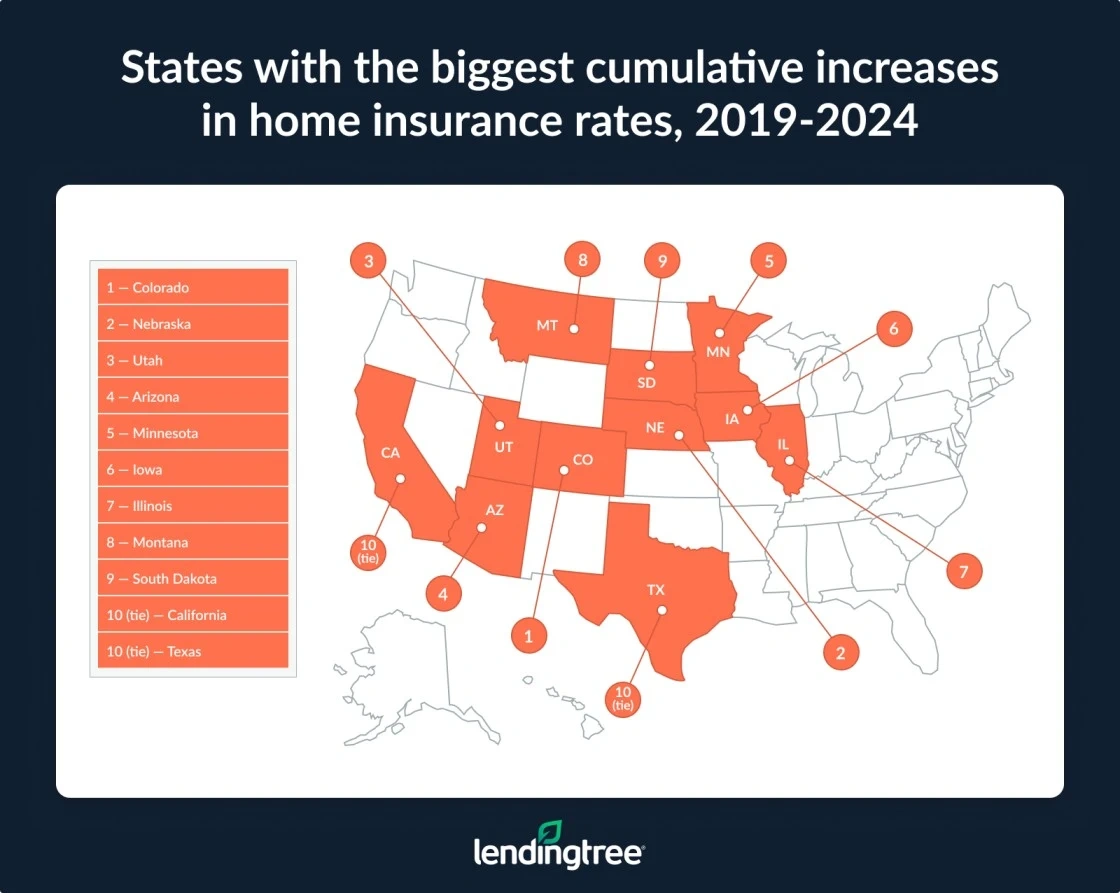
By state during these six years, Colorado saw the biggest jump. From 2019 through 2024, home insurance rates rose by a significant 76.6% (cumulatively) in Colorado.
Notably, Colorado experienced 24 billion-dollar disaster events in the period analyzed, according to the National Oceanic and Atmospheric Administration (NOAA). Nebraska (72.3%) and Utah (70.6%) ranked second and third, respectively. According to NOAA, Nebraska experienced 25 billion-dollar disasters and Utah experienced five from 2019 through 2024.
According to Salt Lake City-based KUTV, Utah is one of the states building the most in Wildland Urban Interface (WUI) areas, meaning new developments are encroaching on wildlands more prone to wildfires, floods and other disasters. This may increase home insurance claims.
Conversely, Vermont had the smallest home insurance rate jump from 2019 through 2024, at just 12.2% cumulatively. Alaska (12.9%) and Maine (17.9%) followed.
Full rankings: States with biggest/smallest cumulative increases in home insurance rates, 2019 through 2024
| Rank | State | Change |
|---|---|---|
| 1 | Colorado | 76.6% |
| 2 | Nebraska | 72.3% |
| 3 | Utah | 70.6% |
| 4 | Arizona | 70.1% |
| 5 | Minnesota | 65.4% |
| 6 | Iowa | 60.6% |
| 7 | Illinois | 59.5% |
| 8 | Montana | 57.8% |
| 9 | South Dakota | 56.8% |
| 10 | California | 55.3% |
| 10 | Texas | 55.3% |
| 12 | Florida | 55.0% |
| 13 | Oregon | 51.6% |
| 14 | Washington | 51.0% |
| 15 | Oklahoma | 50.8% |
| 16 | Maryland | 47.0% |
| 17 | Idaho | 45.7% |
| 18 | Arkansas | 45.3% |
| 19 | New Mexico | 45.0% |
| 20 | Missouri | 43.7% |
| 21 | Rhode Island | 43.3% |
| 22 | Indiana | 40.4% |
| 23 | Connecticut | 40.1% |
| 23 | Virginia | 40.1% |
| 25 | Kansas | 39.8% |
| 26 | Wisconsin | 38.7% |
| 27 | North Carolina | 38.2% |
| 28 | Ohio | 36.1% |
| 29 | Georgia | 35.8% |
| 30 | North Dakota | 35.4% |
| 31 | Alabama | 34.0% |
| 32 | Pennsylvania | 33.4% |
| 33 | Tennessee | 32.7% |
| 34 | Michigan | 32.4% |
| 35 | Kentucky | 31.9% |
| 36 | Louisiana | 31.8% |
| 37 | Massachusetts | 29.9% |
| 38 | New Hampshire | 27.2% |
| 39 | Mississippi | 24.9% |
| 40 | New Jersey | 24.4% |
| 41 | Delaware | 24.1% |
| 42 | Nevada | 23.7% |
| 43 | Hawaii | 23.2% |
| 44 | District of Columbia | 21.7% |
| 44 | New York | 21.7% |
| 46 | South Carolina | 18.5% |
| 47 | West Virginia | 18.2% |
| 48 | Maine | 17.9% |
| 49 | Alaska | 12.9% |
| 50 | Vermont | 12.2% |
Rates up 11.4% in past year
As briefly noted, home insurance rates jumped 11.4% year over year in 2024.
“Home insurance companies had significant expenses in 2023,” Bhatt says. “In seven states, they paid out more in claims than they earned in premiums. Like companies in other industries, they need to earn more than they spend to remain solvent. Unfortunately, they often have to raise their rates to accomplish this goal.”
By state, Montana and Nebraska experienced the highest jumps in 2024, both at 22.1%. Minnesota and Washington followed, both at 19.5%.
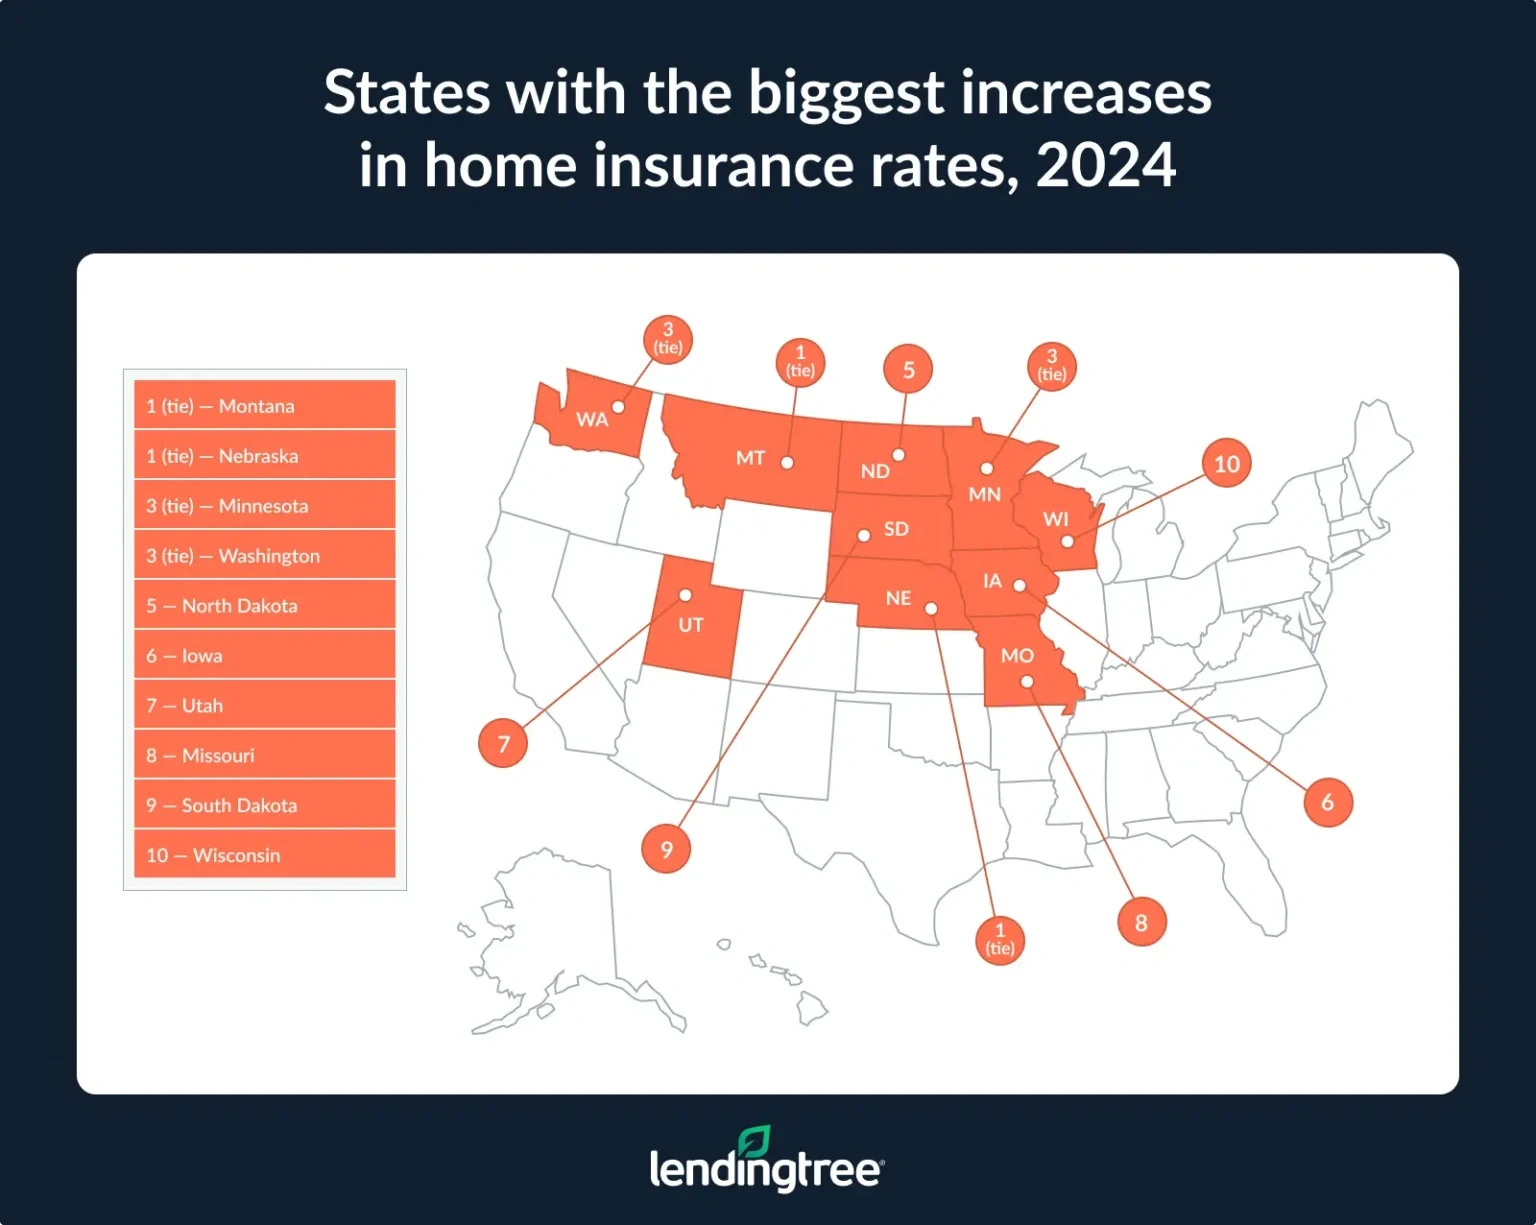
Meanwhile, Florida (1.7%), Texas (3.4%) and New York (3.8%) saw the smallest increases in 2024.
Full rankings: States with biggest/smallest increases in home insurance rates, 2024
| Rank | State | Change |
|---|---|---|
| 1 | Montana | 22.1% |
| 1 | Nebraska | 22.1% |
| 3 | Minnesota | 19.5% |
| 3 | Washington | 19.5% |
| 5 | North Dakota | 18.2% |
| 6 | Iowa | 17.7% |
| 7 | Utah | 17.4% |
| 8 | Missouri | 16.4% |
| 9 | South Dakota | 15.9% |
| 10 | Wisconsin | 15.5% |
| 11 | Connecticut | 14.7% |
| 12 | Illinois | 14.0% |
| 13 | California | 13.6% |
| 14 | Pennsylvania | 13.5% |
| 15 | Kansas | 13.2% |
| 16 | Indiana | 13.0% |
| 17 | Arizona | 12.6% |
| 18 | Arkansas | 12.4% |
| 19 | Colorado | 11.9% |
| 19 | Georgia | 11.9% |
| 19 | New Mexico | 11.9% |
| 22 | Rhode Island | 11.6% |
| 23 | Michigan | 11.4% |
| 24 | Hawaii | 11.3% |
| 24 | Kentucky | 11.3% |
| 26 | Mississippi | 11.2% |
| 27 | Ohio | 10.6% |
| 28 | Idaho | 10.5% |
| 28 | Maryland | 10.5% |
| 30 | Alabama | 10.4% |
| 31 | West Virginia | 10.3% |
| 32 | New Hampshire | 10.2% |
| 33 | New Jersey | 10.0% |
| 34 | Virginia | 9.9% |
| 35 | Tennessee | 9.8% |
| 36 | South Carolina | 9.2% |
| 37 | Oklahoma | 8.6% |
| 37 | Oregon | 8.6% |
| 39 | Massachusetts | 7.9% |
| 40 | Delaware | 7.2% |
| 40 | North Carolina | 7.2% |
| 42 | Maine | 7.0% |
| 43 | Louisiana | 6.9% |
| 44 | Alaska | 6.7% |
| 45 | District of Columbia | 6.6% |
| 46 | Vermont | 5.2% |
| 47 | Nevada | 4.3% |
| 48 | New York | 3.8% |
| 49 | Texas | 3.4% |
| 50 | Florida | 1.7% |
Home insurance costs $2,801 on average — here’s where it’s highest
To put those rate hikes into context, home insurance costs $2,801 on average annually.
That varies significantly by state, though. In fact, the average cost of home insurance in Oklahoma is a staggering $6,133. Nebraska ($5,912) is the only other state where home insurance costs more than double the average across the U.S. Kansas ($5,412) rounds out the top three.
Bhatt says these figures may add to homeowners’ financial stressors.
“For new homebuyers, rising home insurance costs can reduce the amount they can borrow, which, in turn, can make it more difficult to find an affordable home,” he says. “If you already own your home, rising insurance costs cut into your budget for other household essentials.”
States with highest average annual home insurance costs
| Rank | State | Avg. annual home insurance cost | % difference from U.S. avg. |
|---|---|---|---|
| 1 | Oklahoma | $6,133 | 118.9% |
| 2 | Nebraska | $5,912 | 111.0% |
| 3 | Kansas | $5,412 | 93.2% |
Meanwhile, Hawaii has the lowest average annual insurance cost at just $632 — the only state under four figures. California ($1,260) and Vermont ($1,339) rank second and third, respectively.
With those high costs, not everyone can afford home insurance. According to a LendingTree study on uninsured rates, 13.6% of owner-occupied homes in the U.S. — about 11.3 million out of 82.9 million — are uninsured.
Full rankings: States with highest/lowest average annual home insurance costs
| Rank | State | Avg. annual home insurance cost | % difference from U.S. avg. |
|---|---|---|---|
| 1 | Oklahoma | $6,133 | 118.9% |
| 2 | Nebraska | $5,912 | 111.0% |
| 3 | Kansas | $5,412 | 93.2% |
| 4 | Texas | $5,180 | 84.9% |
| 5 | Kentucky | $4,671 | 66.7% |
| 6 | Colorado | $4,489 | 60.2% |
| 7 | Mississippi | $4,201 | 50.0% |
| 8 | Louisiana | $4,033 | 44.0% |
| 9 | Florida | $3,889 | 38.8% |
| 10 | Arkansas | $3,722 | 32.9% |
| 11 | Minnesota | $3,642 | 30.0% |
| 12 | South Dakota | $3,605 | 28.7% |
| 13 | Missouri | $3,387 | 20.9% |
| 14 | North Carolina | $3,378 | 20.6% |
| 15 | New Mexico | $3,354 | 19.7% |
| 16 | South Carolina | $3,335 | 19.0% |
| 17 | Alabama | $3,217 | 14.9% |
| 18 | Montana | $3,068 | 9.5% |
| 19 | North Dakota | $2,911 | 3.9% |
| 20 | Georgia | $2,869 | 2.4% |
| 21 | Tennessee | $2,857 | 2.0% |
| 22 | Illinois | $2,743 | -2.1% |
| 23 | Iowa | $2,697 | -3.7% |
| 24 | Indiana | $2,643 | -5.6% |
| 25 | Arizona | $2,623 | -6.4% |
| 26 | Connecticut | $2,618 | -6.5% |
| 27 | West Virginia | $2,511 | -10.4% |
| 28 | Virginia | $2,499 | -10.8% |
| 29 | Michigan | $2,467 | -12.0% |
| 30 | Wyoming | $2,323 | -17.1% |
| 31 | Rhode Island | $2,240 | -20.0% |
| 32 | Ohio | $2,207 | -21.2% |
| 33 | Idaho | $2,178 | -22.2% |
| 34 | Wisconsin | $2,159 | -22.9% |
| 35 | Pennsylvania | $1,928 | -31.2% |
| 36 | Massachusetts | $1,906 | -32.0% |
| 37 | New York | $1,897 | -32.3% |
| 38 | Oregon | $1,885 | -32.7% |
| 39 | Maine | $1,863 | -33.5% |
| 40 | Maryland | $1,810 | -35.4% |
| 41 | District of Columbia | $1,764 | -37.0% |
| 42 | New Hampshire | $1,760 | -37.2% |
| 43 | New Jersey | $1,744 | -37.7% |
| 44 | Delaware | $1,701 | -39.3% |
| 45 | Nevada | $1,626 | -42.0% |
| 46 | Washington | $1,600 | -42.9% |
| 47 | Utah | $1,507 | -46.2% |
| 48 | Alaska | $1,475 | -47.4% |
| 49 | Vermont | $1,339 | -52.2% |
| 50 | California | $1,260 | -55.0% |
| 51 | Hawaii | $632 | -77.5% |
Shopping around amid rate hikes: Top expert tips
Saving on home insurance is becoming increasingly difficult as rates continue to rise, but you can do a few things to help combat high costs. We offer the following advice:
- Shop around to make sure you’re not overpaying for insurance. Using a rate comparison tool is a great place to start, but keep in mind that cheap insurance isn’t always better.
- Increase your deductibles. Bhatt says increasing your deductible can lower your premium. Because your deductible is the amount you pay out of pocket for claims, make sure it’s still affordable for you.
- Pay for minor repairs yourself instead of through insurance. “Home insurance claims make your rate go up,” Bhatt says. “If you have multiple claims within two or three years, your insurance company may drop you. Having to pay a couple of thousand dollars to repair a broken window or damaged roof may seem like a financial pain, but doing so may save you money and heartache in the long run. It’s generally best to save insurance for major damage you can’t afford to repair yourself.”
Methodology
LendingTree researchers analyzed home insurance data, pulled in January 2024, from Quadrant Information Services. These rates were publicly sourced from insurer filings and should be used for comparative purposes only. Your quotes will likely differ. The following coverages and deductibles were used unless otherwise noted:
- $400,000 dwelling coverage
- $40,000 other structures
- $200,000 personal property
- $80,000 loss of use coverage
- $100,000 liability
- $5,000 medical payments
- $1,000 deductible
Home insurance rate change data was compiled using RateWatch from S&P Global, which uses annual information from the National Association of Insurance Commissioners (NAIC).