More Than Half of Fatal Crashes in 2023 Involved Striking Objects, From Trees to Fences to Animals


When people think of fatal crashes, high-speed collisions between vehicles often come to mind. But a significant percentage of deadly crashes in 2023 — the latest available — involved objects. More than half of them (52.0%) happened when a vehicle struck something fixed (like a tree, pole or guardrail) or something nonfixed (like a cyclist or animal).
We’ll look at where fatal crashes involving fixed and nonfixed objects occurred most frequently, as well as the most common objects involved and when they happened the most. Additionally, we surveyed 2,000 U.S. consumers about their experiences hitting an animal and which one concerns them the most while driving.
Key findings
- In 2023, 27.6% of fatal crashes involved fixed objects, while 24.4% involved nonfixed objects. Fixed objects include trees, poles, guardrails and more, while nonfixed objects include pedestrians, cyclists, animals and more. By state, Maine (47.2%), Rhode Island (44.8%) and Massachusetts (40.9%) had the highest rates of fixed-object fatal crashes. Meanwhile, the District of Columbia (46.2%), New Jersey (35.4%) and California (also 35.4%) saw the highest rates of nonfixed-object crashes.
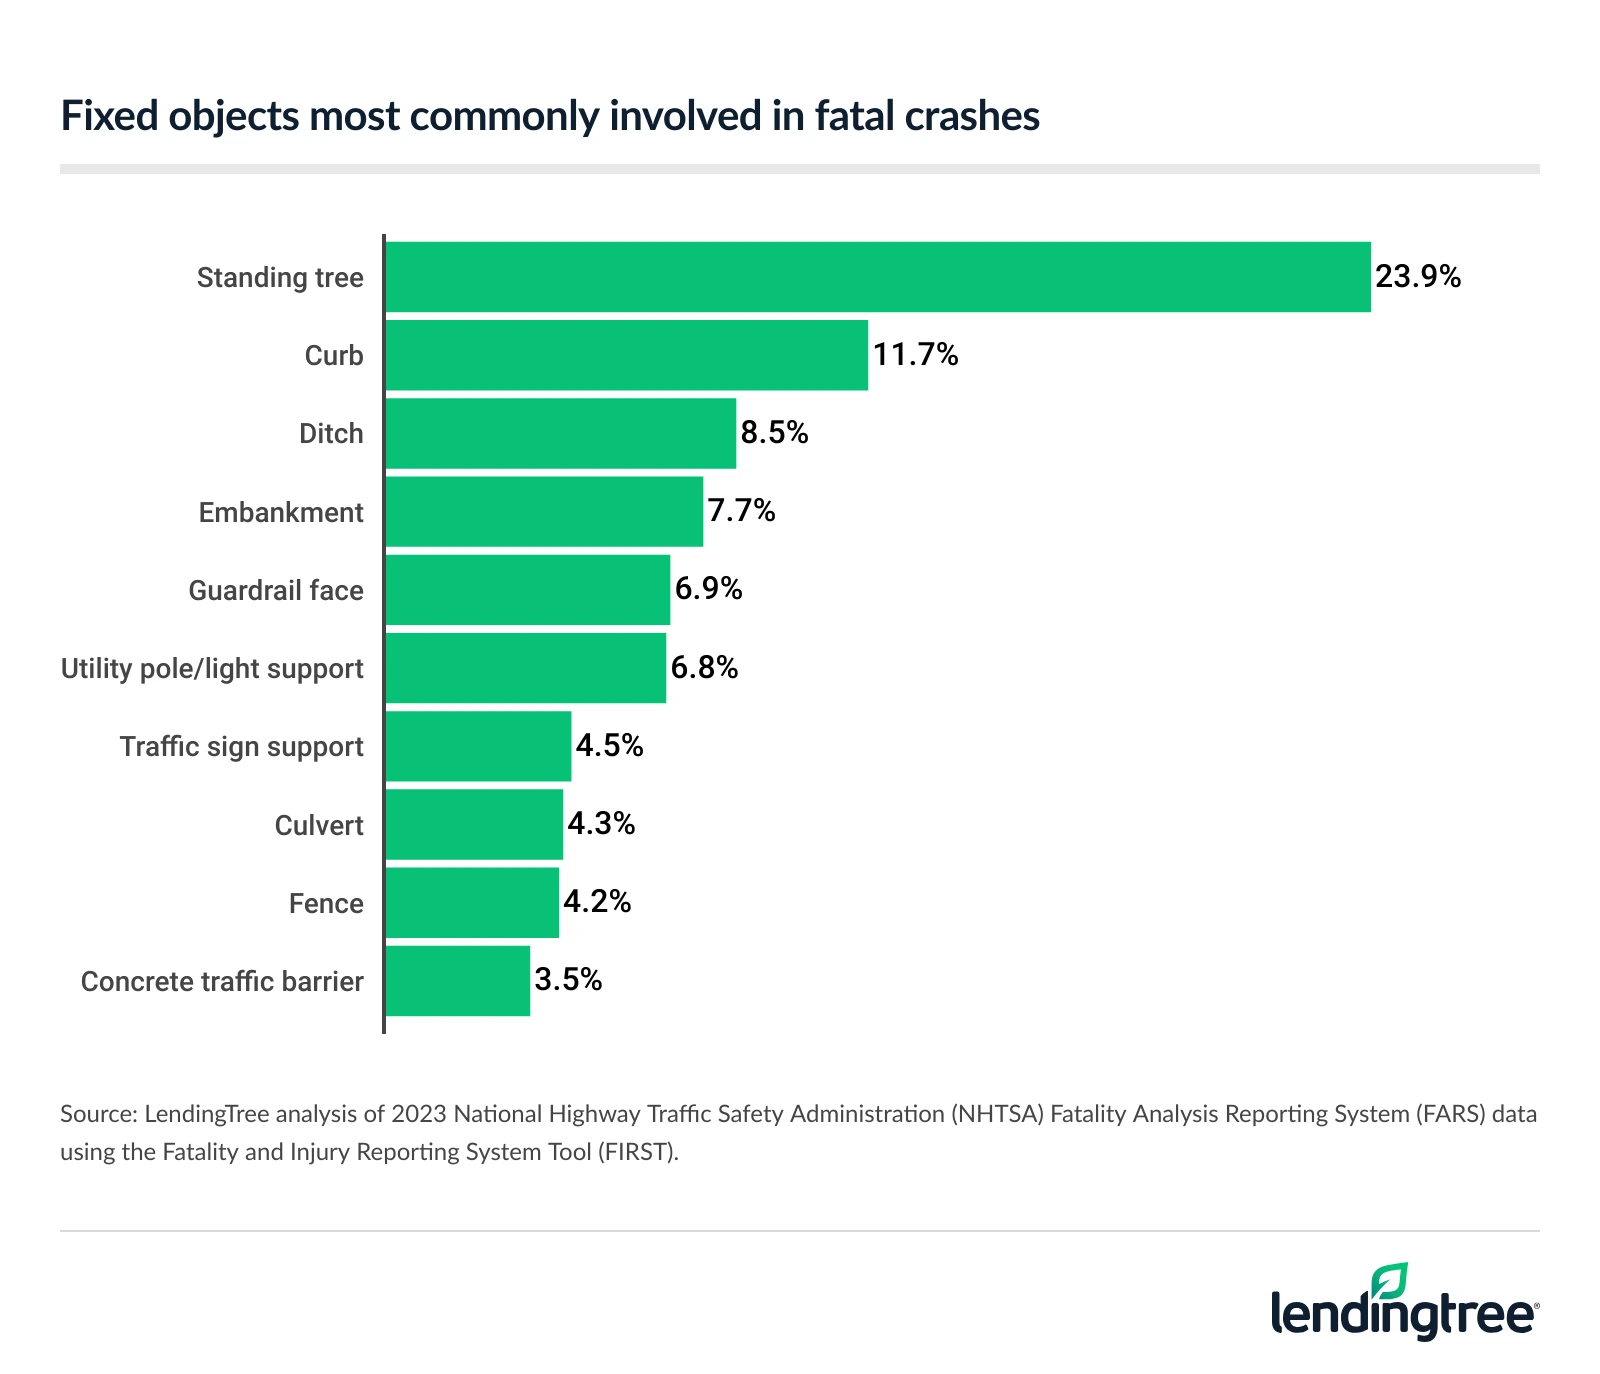
- By far, trees were the deadliest fixed object in fatal crashes in 2023. They accounted for 2,490 (or 23.9%) of fatal crashes involving fixed objects. Curbs (1,219 or 11.7%) and ditches (881 or 8.5%) followed.
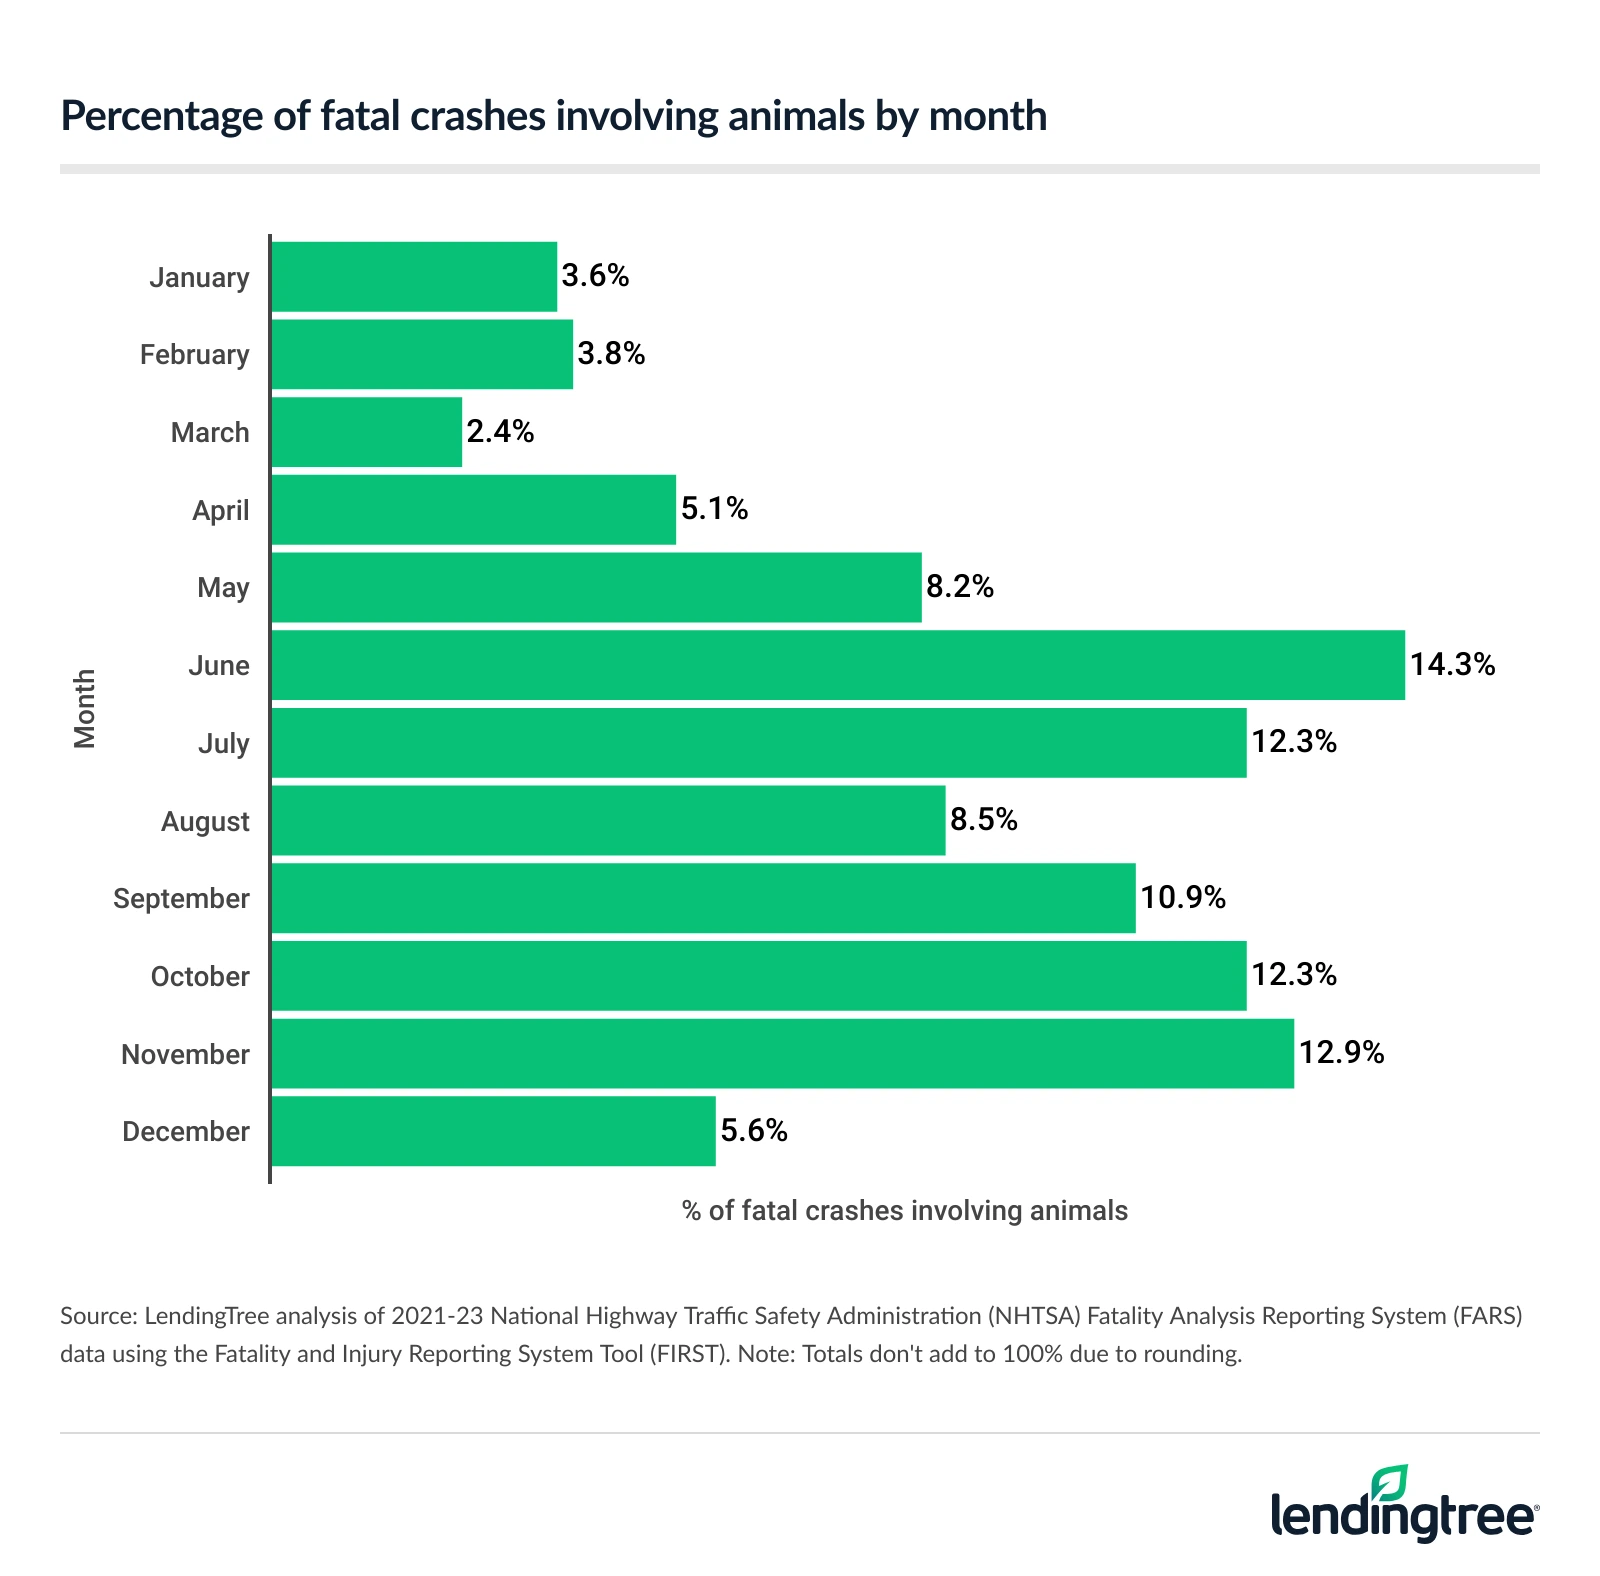
- Fatal crashes involving animals spiked in the summer and fall. June through November accounted for 71.3% of such crashes from 2021 through 2023. June saw the highest share (14.3%), ahead of November (12.9%) and July and October (12.3% each).
- In a separately conducted survey, 2 in 5 Americans (40%) admitted to hitting an animal while driving. Men (46%) were more likely to hit an animal while driving than women (34%). A more significant 62% know someone who has hit an animal while driving. Overall, 55% worry about it while driving around their local area.
- Deer are the most worrisome animals for drivers. Nearly half (49%) of Americans say deer give them the most concern while driving, with dogs and cats a distant second at 31%. That said, 86% take extra precautions when driving in areas known for deer crossings.
Over half of fatal crashes involved striking objects
In 2023, 52.0% of fatal crashes involved fixed or nonfixed objects. Breaking that down, 27.6% involved fixed objects like trees, poles and guardrails.
By state, Maine had the highest rate of these crashes, at 47.2%. Rhode Island (44.8%) and Massachusetts (40.9%) followed.
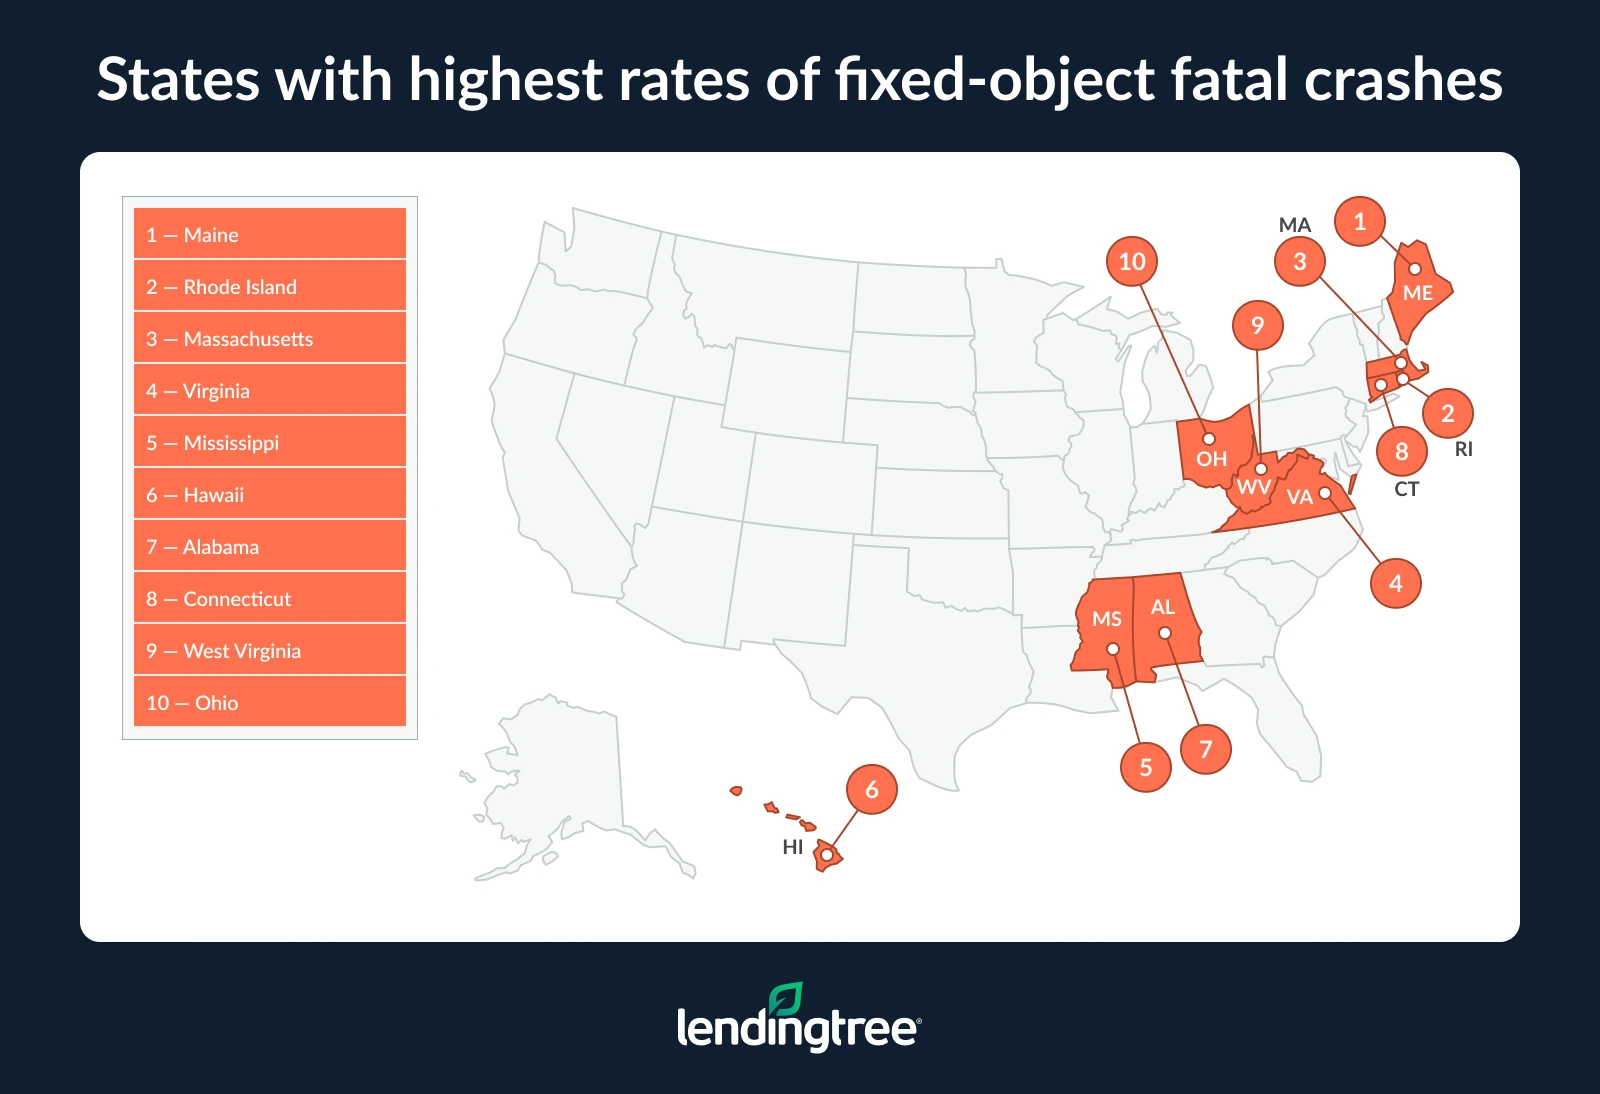
Conversely, New Mexico (12.9%), North Dakota (15.6%) and South Dakota (16.4%) had the lowest rates of fatal crashes involving fixed objects.
Auto insurance expert and licensed insurance agent Rob Bhatt notes that fatal crashes involving trees, poles and similar fixed objects tend to involve vehicles that have left the roadway.
“A vehicle that collides with a sturdy object is often going to bear the brunt of impact,” he says. “The injury risks get more severe when vehicles are traveling at higher speeds.”
Meanwhile, 24.4% involved nonfixed objects including pedestrians, cyclists and animals. The District of Columbia ranked first, with 46.2% of fatal crashes involving nonfixed objects. New Jersey and California tied for second, at 35.4%.
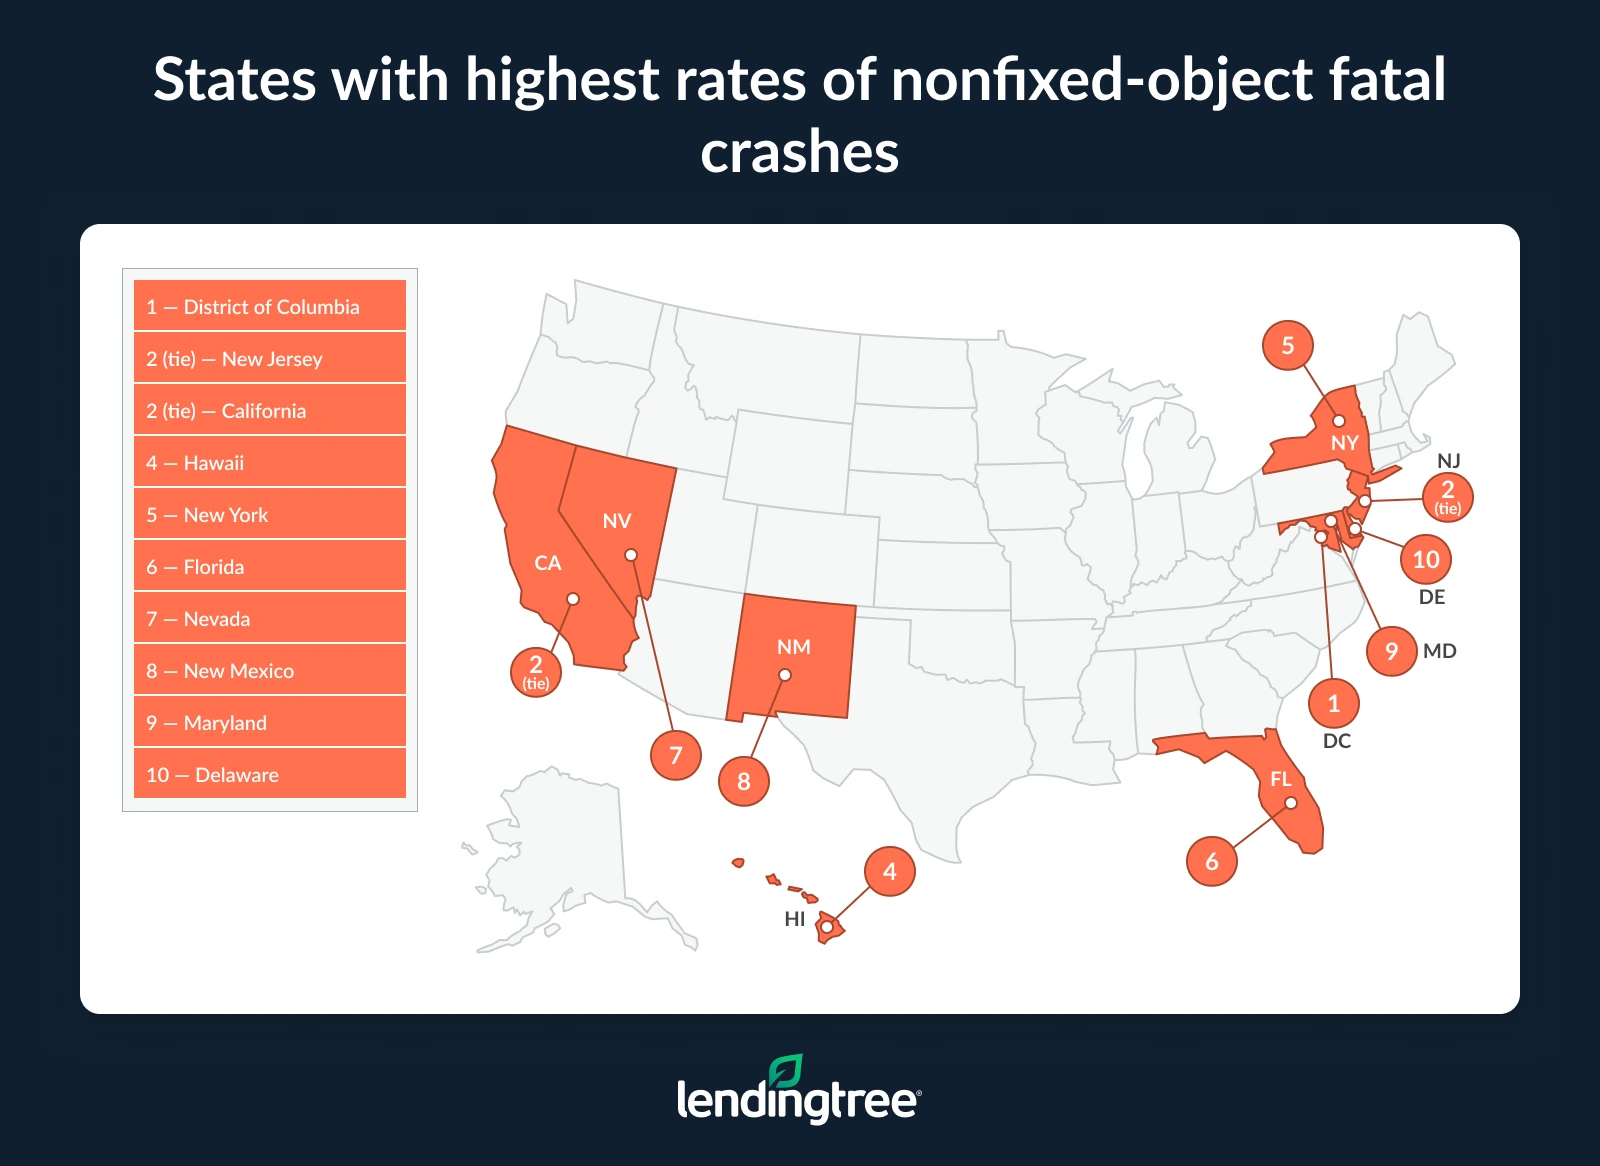
Meanwhile, Vermont (11.1%), Nebraska (11.2%) and Wyoming (11.6%) had the lowest rates of fatal crashes involving nonfixed objects.
Full rankings: States with highest/lowest rate of fatal crashes involving fixed objects, 2023
| Rank | State | Fatal crashes | Fatal crashes involving fixed objects | % involving fixed objects |
|---|---|---|---|---|
| 1 | Maine | 127 | 60 | 47.2% |
| 2 | Rhode Island | 67 | 30 | 44.8% |
| 3 | Massachusetts | 325 | 133 | 40.9% |
| 4 | Virginia | 855 | 336 | 39.3% |
| 5 | Mississippi | 665 | 248 | 37.3% |
| 6 | Hawaii | 88 | 32 | 36.4% |
| 7 | Alabama | 893 | 323 | 36.2% |
| 8 | Connecticut | 289 | 101 | 34.9% |
| 9 | West Virginia | 233 | 81 | 34.8% |
| 10 | Ohio | 1,150 | 398 | 34.6% |
| 11 | Tennessee | 1,219 | 412 | 33.8% |
| 12 | Arkansas | 542 | 181 | 33.4% |
| 13 | Vermont | 63 | 21 | 33.3% |
| 13 | North Carolina | 1,449 | 482 | 33.3% |
| 15 | Pennsylvania | 1,133 | 373 | 32.9% |
| 16 | Kentucky | 767 | 251 | 32.7% |
| 17 | South Carolina | 976 | 316 | 32.4% |
| 18 | Missouri | 905 | 289 | 31.9% |
| 19 | Oregon | 534 | 168 | 31.5% |
| 20 | Iowa | 328 | 101 | 30.8% |
| 21 | Indiana | 842 | 258 | 30.6% |
| 21 | Louisiana | 755 | 231 | 30.6% |
| 23 | Montana | 196 | 58 | 29.6% |
| 24 | Kansas | 353 | 104 | 29.5% |
| 25 | Georgia | 1,491 | 438 | 29.4% |
| 26 | Delaware | 128 | 37 | 28.9% |
| 27 | Alaska | 56 | 16 | 28.6% |
| 28 | Washington | 733 | 208 | 28.4% |
| 29 | New Hampshire | 122 | 34 | 27.9% |
| 30 | Maryland | 577 | 159 | 27.6% |
| 31 | Oklahoma | 643 | 177 | 27.5% |
| 32 | Nebraska | 206 | 56 | 27.2% |
| 33 | New Jersey | 573 | 151 | 26.4% |
| 34 | New York | 1,033 | 266 | 25.8% |
| 35 | Wisconsin | 530 | 133 | 25.1% |
| 36 | Michigan | 1,020 | 255 | 25.0% |
| 37 | Wyoming | 121 | 30 | 24.8% |
| 38 | Illinois | 1,143 | 277 | 24.2% |
| 38 | Texas | 3,874 | 936 | 24.2% |
| 40 | California | 3,727 | 889 | 23.9% |
| 41 | Nevada | 351 | 83 | 23.6% |
| 42 | Colorado | 666 | 156 | 23.4% |
| 43 | Idaho | 242 | 54 | 22.3% |
| 44 | Utah | 251 | 52 | 20.7% |
| 45 | Minnesota | 370 | 76 | 20.5% |
| 46 | Florida | 3,183 | 635 | 19.9% |
| 47 | District of Columbia | 39 | 7 | 17.9% |
| 48 | Arizona | 1,195 | 208 | 17.4% |
| 49 | South Dakota | 128 | 21 | 16.4% |
| 50 | North Dakota | 96 | 15 | 15.6% |
| 51 | New Mexico | 402 | 52 | 12.9% |
Full rankings: States with highest/lowest rate of fatal crashes involving nonfixed objects, 2023
| Rank | State | Fatal crashes | Fatal crashes involving nonfixed objects | % involving nonfixed objects |
|---|---|---|---|---|
| 1 | District of Columbia | 39 | 18 | 46.2% |
| 2 | New Jersey | 573 | 203 | 35.4% |
| 2 | California | 3,727 | 1,318 | 35.4% |
| 4 | Hawaii | 88 | 31 | 35.2% |
| 5 | New York | 1,033 | 359 | 34.8% |
| 6 | Florida | 3,183 | 1,047 | 32.9% |
| 7 | Nevada | 351 | 115 | 32.8% |
| 8 | New Mexico | 402 | 123 | 30.6% |
| 9 | Maryland | 577 | 175 | 30.3% |
| 10 | Delaware | 128 | 35 | 27.3% |
| 11 | Arizona | 1,195 | 323 | 27.0% |
| 12 | Massachusetts | 325 | 82 | 25.2% |
| 12 | Louisiana | 755 | 190 | 25.2% |
| 14 | Colorado | 666 | 166 | 24.9% |
| 15 | Washington | 733 | 180 | 24.6% |
| 16 | South Carolina | 976 | 239 | 24.5% |
| 17 | Texas | 3,874 | 946 | 24.4% |
| 18 | Oregon | 534 | 128 | 24.0% |
| 19 | Rhode Island | 67 | 16 | 23.9% |
| 20 | Georgia | 1,491 | 354 | 23.7% |
| 20 | Illinois | 1,143 | 271 | 23.7% |
| 22 | Alaska | 56 | 13 | 23.2% |
| 23 | Michigan | 1,020 | 235 | 23.0% |
| 24 | Pennsylvania | 1,133 | 258 | 22.8% |
| 25 | Utah | 251 | 57 | 22.7% |
| 26 | North Carolina | 1,449 | 290 | 20.0% |
| 27 | Indiana | 842 | 164 | 19.5% |
| 28 | Idaho | 242 | 47 | 19.4% |
| 29 | Virginia | 855 | 165 | 19.3% |
| 29 | Kentucky | 767 | 148 | 19.3% |
| 31 | Oklahoma | 643 | 118 | 18.4% |
| 32 | Connecticut | 289 | 53 | 18.3% |
| 33 | Arkansas | 542 | 96 | 17.7% |
| 33 | Ohio | 1,150 | 203 | 17.7% |
| 35 | Wisconsin | 530 | 91 | 17.2% |
| 36 | Tennessee | 1,219 | 208 | 17.1% |
| 37 | Missouri | 905 | 149 | 16.5% |
| 37 | Alabama | 893 | 147 | 16.5% |
| 39 | New Hampshire | 122 | 20 | 16.4% |
| 39 | Mississippi | 665 | 109 | 16.4% |
| 41 | Maine | 127 | 20 | 15.7% |
| 42 | Minnesota | 370 | 57 | 15.4% |
| 43 | Montana | 196 | 30 | 15.3% |
| 44 | Kansas | 353 | 53 | 15.0% |
| 45 | West Virginia | 233 | 33 | 14.2% |
| 46 | Iowa | 328 | 42 | 12.8% |
| 47 | North Dakota | 96 | 12 | 12.5% |
| 48 | South Dakota | 128 | 15 | 11.7% |
| 49 | Wyoming | 121 | 14 | 11.6% |
| 50 | Nebraska | 206 | 23 | 11.2% |
| 51 | Vermont | 63 | 7 | 11.1% |
Trees were most common fixed object in deadly crashes
When it comes to what drivers hit, trees were the most common fixed object in fatal crashes in 2023. They accounted for 2,490 (or 23.9%) of fatal crashes involving fixed objects — the highest by a significant amount. Curbs followed, accounting for 1,219 (or 11.7%), and ditches (881 or 8.5%) ranked third.
Fatal crashes by fixed object type, 2023
| Rank | Fixed object type | Fatal crashes | % of total |
|---|---|---|---|
| 1 | Tree (standing only) | 2,490 | 23.9% |
| 2 | Curb | 1,219 | 11.7% |
| 3 | Ditch | 881 | 8.5% |
| 4 | Embankment | 800 | 7.7% |
| 5 | Guardrail face | 713 | 6.9% |
| 6 | Utility pole/light support | 712 | 6.8% |
| 7 | Traffic sign support | 470 | 4.5% |
| 8 | Culvert | 449 | 4.3% |
| 9 | Fence | 439 | 4.2% |
| 10 | Concrete traffic barrier | 367 | 3.5% |
| 11 | Post, pole or other supports | 244 | 2.3% |
| 12 | Mailbox | 234 | 2.2% |
| 13 | Other fixed object | 232 | 2.2% |
| 14 | Guardrail end | 165 | 1.6% |
| 15 | Bridge pier or support | 112 | 1.1% |
| 16 | Wall | 107 | 1.0% |
| 17 | Cable barrier | 92 | 0.9% |
| 18 | Boulder | 88 | 0.8% |
| 19 | Building | 83 | 0.8% |
| 20 | Impact attenuator/crash cushion | 82 | 0.8% |
| 21 | Ground | 77 | 0.7% |
| 22 | Traffic signal support | 75 | 0.7% |
| 23 | Bridge rail (includes parapet) | 74 | 0.7% |
| 24 | Other traffic barrier | 51 | 0.5% |
| 25 | Shrubbery | 45 | 0.4% |
| 26 | Reported as unknown | 37 | 0.4% |
| 27 | Unknown fixed object | 31 | 0.3% |
| 28 | Fire hydrant | 25 | 0.2% |
| 29 | Bridge overhead structure | 10 | 0.1% |
| 30 | Snowbank | 4 | 0.0% |
Pedestrians were by far the most common nonfixed object involved in fatal crashes during this period. Of the 9,196 fatal crashes involving nonfixed objects, 6,777 (73.7%) involved pedestrians, followed by pedalcyclists (1,145 or 12.5%) and parked vehicles (463 or 5.0%). Meanwhile, live animals were involved in 218, or 2.4%.
Fatal crashes by nonfixed object type, 2023
| Rank | Nonfixed object type | Fatal crashes | % of total |
| 1 | Pedestrian | 6,777 | 73.7% |
| 2 | Pedalcyclist | 1,145 | 12.5% |
| 3 | Parked motor vehicle | 463 | 5.0% |
| 4 | Nonmotorist on personal conveyance | 225 | 2.4% |
| 5 | Live animal | 218 | 2.4% |
| 6 | Other object (not fixed) | 194 | 2.1% |
| 7 | Railway vehicle | 110 | 1.2% |
| 8 | Working motor vehicle | 24 | 0.3% |
| 9 | Ridden animal or animal-drawn conveyance | 24 | 0.3% |
| 10 | Unknown object not fixed | 11 | 0.1% |
| 11 | Object that had fallen from motor vehicle in-transport | 4 | 0.0% |
| 12 | Road vehicle on rails | 1 | 0.0% |
Fatal crashes involving animals highest in summer, fall
Fatal crashes involving animals occur most often in the summer and fall. Looking at these deadly crashes from 2021 through 2023 (to show a wider sample), 71.3% happened in June through November. June alone accounted for 14.3%, while November had 12.9% and July and October had 12.3% each.
“June is a time of year when we see more drivers on the road and more activity among animals in the wild,” Bhatt says.
Regardless, it’s essential to remain vigilant about the various hazards that can emerge on the roadway at any time of the year. It’s also important to be mindful of the various hazards that can arise unexpectedly.
Deer birth season (fawning) is most common in June, so they may be more active during this time. Meanwhile, November is peak deer mating season, during which deer move around more frequently and unpredictably.
As for when these deadly crashes occur, fixed-object ones were most common overnight in 2023, while nonfixed crashes peaked in the evening. (Note: This looks solely at 2023 because our sample size was large enough for this breakdown.) Between 2 a.m. and 3 a.m., 43.4% of fatal crashes involved a fixed object, ahead of 43.1% between 1 a.m. and 2 a.m.
Meanwhile, nonfixed objects were most likely to be a factor between 9 p.m. and 10 p.m., playing a role in 38.6% of fatal crashes.
40% of Americans have hit animal while driving
In a separately conducted survey of 2,000 U.S. consumers, 40% of Americans admitted to hitting an animal while driving. Men (46%) were more likely to hit an animal while driving than women (34%). Meanwhile, baby boomers ages 61 to 79 (46%) were the most likely age group to do so.
“Hitting an animal can be traumatizing for a driver, and possibly damaging,” Bhatt says. “It’s especially important to be mindful of this risk when you’re driving through rural and wildland areas — especially if you come across an animal crossing sign.”
Being alert and driving at an appropriate speed is a good way to protect yourself and any wild animals that may enter your path.
Notably, a significant 62% know someone who has hit an animal while driving. In total, 55% of Americans worry about it while driving around the area where they live.
Deer concern Americans the most
When it comes to the animal most concerning for drivers, deer are at the top of the list. In fact, 49% of Americans say deer give them the most concern while driving. Dogs and cats follow at 31%.
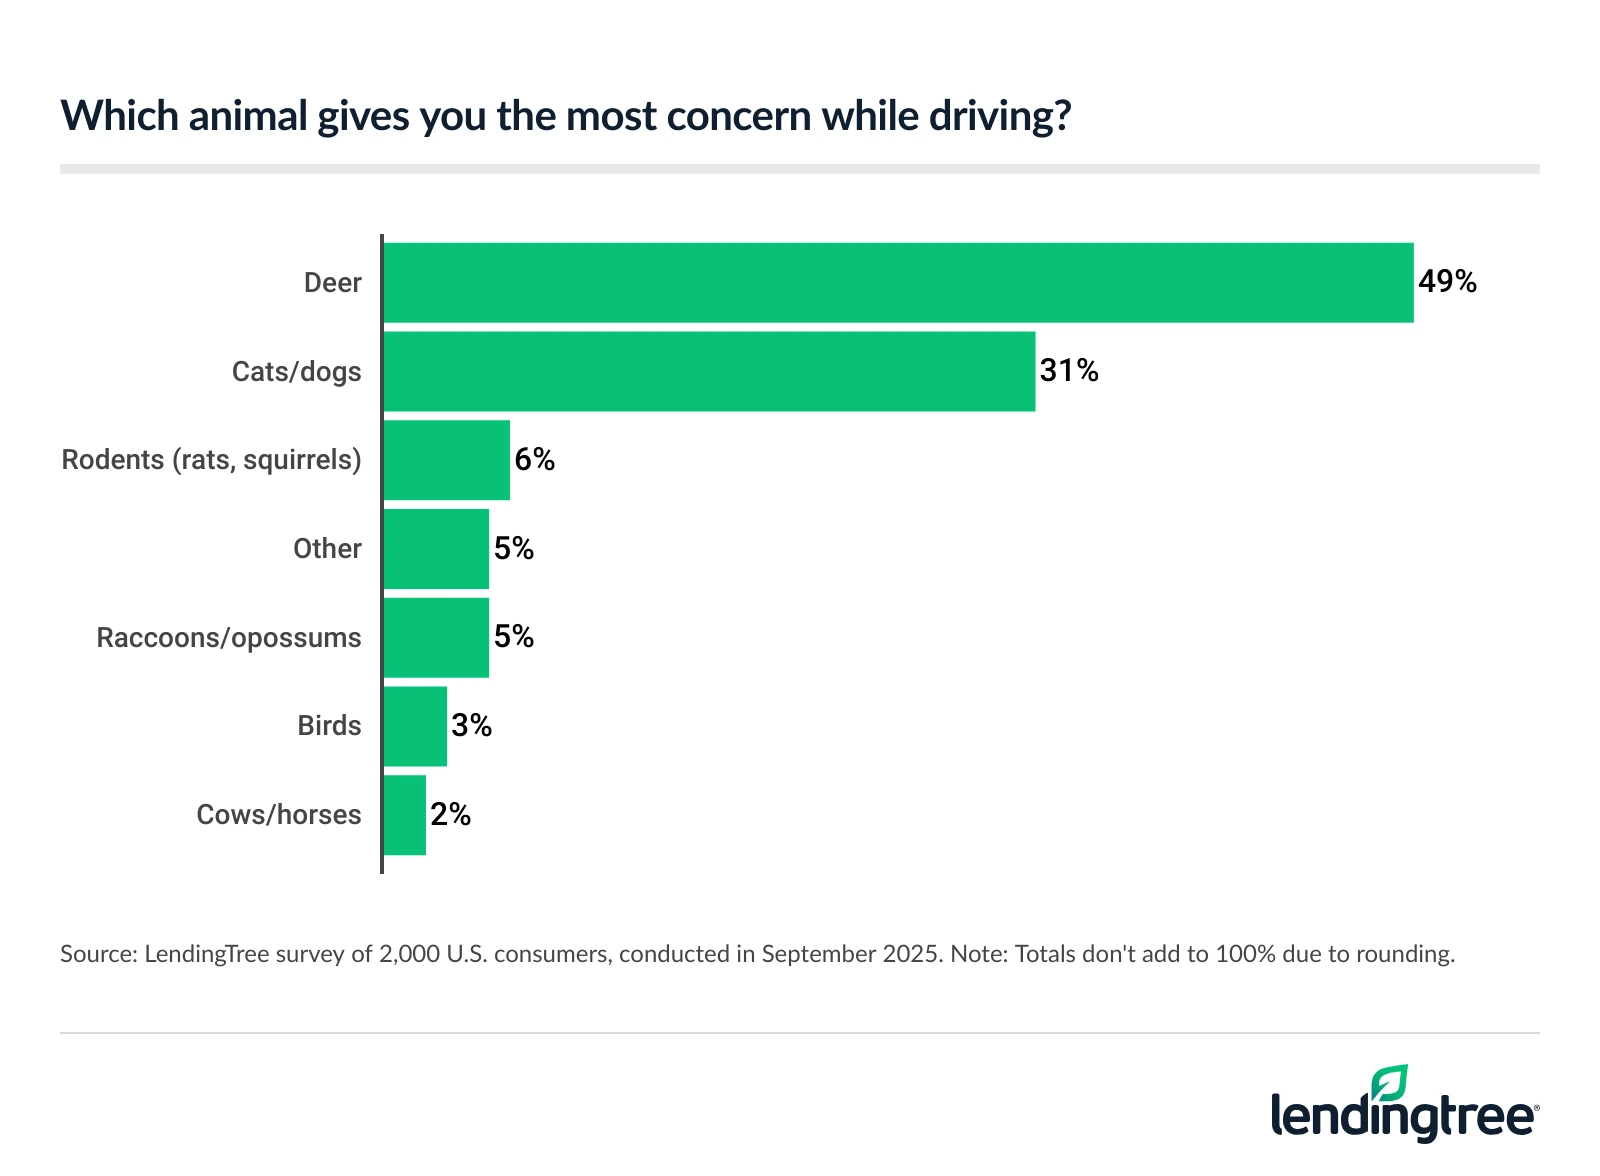
Overall, though, 86% of consumers take extra precautions when driving in areas known for deer crossings.
Mitigating risks while driving: Top expert tips
Hitting an animal can be more than just a scary experience — it’s a potentially expensive and painful event. To help prepare yourself and mitigate risks while driving, we offer the following advice:
- Consider comprehensive coverage. “Comprehensive coverage is still relatively inexpensive compared to collision or liability coverage,” Bhatt says. “Comprehensive covers damage to your car from an animal strike. It also covers damage to your windshield and windows, which can occur in an accident with an animal. Comprehensive usually requires you to pay a deductible, and your insurance company covers repair costs above this amount.”
- See if your insurance offers glass and windshield coverage. “Several companies offer an inexpensive add-on that waives or reduces your deductible for glass damage,” he says. “These add-ons are usually cheap, and they can save you money if your windshield or windows are damaged from anything, including an animal strike. Glass damage is one of the most common car insurance claims.”
- Pay attention to the road. “Driving requires you to constantly keep your eyes out for potential hazards that may emerge in front of you, possibly without warning,” he says. “This includes taking heed of animal crossing signs you come across, because this risk is particularly unpredictable. It’s also important to control your speed, and avoid swerving into an oncoming traffic lane to avoid an animal that unexpectedly enters your path.”
Methodology
LendingTree researchers analyzed National Highway Traffic Safety Administration (NHTSA) Fatality Analysis Reporting System (FARS) data using the Fatality and Injury Reporting System Tool (FIRST).
Researchers examined fatal crashes from 2023 (the most recent year available) to determine the number of deadly crashes by state that involved either a fixed or nonfixed object. Crashes were classified by their first harmful event.
Fixed objects included:
- Boulder
- Bridge overhead structure
- Bridge pier or support
- Bridge rail (includes parapet)
- Building
- Cable barrier
- Concrete traffic barrier
- Culvert
- Curb
- Ditch
- Embankment
- Fence
- Fire hydrant
- Ground
- Guardrail end
- Guardrail face
- Impact attenuator/crash cushion
- Mailbox
- Other fixed objects
- Other traffic barrier
- Post, pole or other supports
- Shrubbery
- Snowbank
- Standing tree
- Traffic signal support
- Traffic sign support
- Unknown/reported as unknown
- Utility pole/light support
- Wall
Nonfixed objects included:
- Live animal
- Nonmotorist on personal conveyance
- Object that had fallen from motor vehicle in-transport
- Other object (not fixed)
- Parked motor vehicle (not in transport)
- Pedalcyclist
- Pedestrian
- Railway vehicle
- Ridden animal or animal-drawn conveyance
- Road vehicle on rails
- Unknown object not fixed
- Working motor vehicle
Additionally, researchers analyzed the amount of fatal crashes by object type, time of day and month. Our monthly look analyzes 2021-to-2023 data to provide a wider sample.
Separately, LendingTree commissioned QuestionPro to conduct an online survey of 2,000 U.S. consumers ages 18 to 79 from Sept. 2 to 4, 2025. The survey was administered using a nonprobability-based sample, and quotas were used to ensure the sample base represented the overall population. Researchers reviewed all responses for quality control.
We defined generations as the following ages in 2025:
- Generation Z: 18 to 28
- Millennial: 29 to 44
- Generation X: 45 to 60
- Baby boomer: 61 to 79