Tropical Cyclones Are Costliest and Deadliest US Natural Disaster


Tropical cyclones (especially hurricanes) are the most destructive type of natural disaster. According to a LendingTree analysis, tropical cyclones account for the majority of billion-dollar disaster costs and deaths.
We’ll break down the top billion-dollar tropical cyclones, the places with the highest hurricane risks and how to utilize your home insurance to help mitigate hurricane costs.
Key findings
- Tropical cyclones — mainly hurricanes — are the costliest and deadliest type of natural disaster. Since 2000, they have accounted for the majority of billion-dollar disaster costs, peaking at 70.1% in the 2000s. This is a stark difference from the 1980s and 1990s, when tropical cyclones accounted for 21.2% and 37.5% of billion-dollar disaster costs, respectively. Tropical cyclones have also accounted for a significant share of billion-dollar disaster deaths, at 78.8% in the 2000s and 68.2% in the 2010s.
- After adjusting for inflation, seven of the 10 costliest tropical cyclones since 1980 took place in the past 15 years. 2005’s Hurricane Katrina is the costliest at $201.3 billion. Three hurricanes in the 2020s are in the top 10: 2022’s Hurricane Ian ($119.6 billion), 2021’s Hurricane Ida ($84.6 billion) and 2024’s Hurricane Helene ($78.7 billion).
- The expected annual losses per 10,000 residents from hurricanes are highest in Florida. At $3.6 million, Florida finishes well above the national average of $610,199 per 10,000 residents. Louisiana ($3.1 million) and South Carolina ($2.9 million) follow.
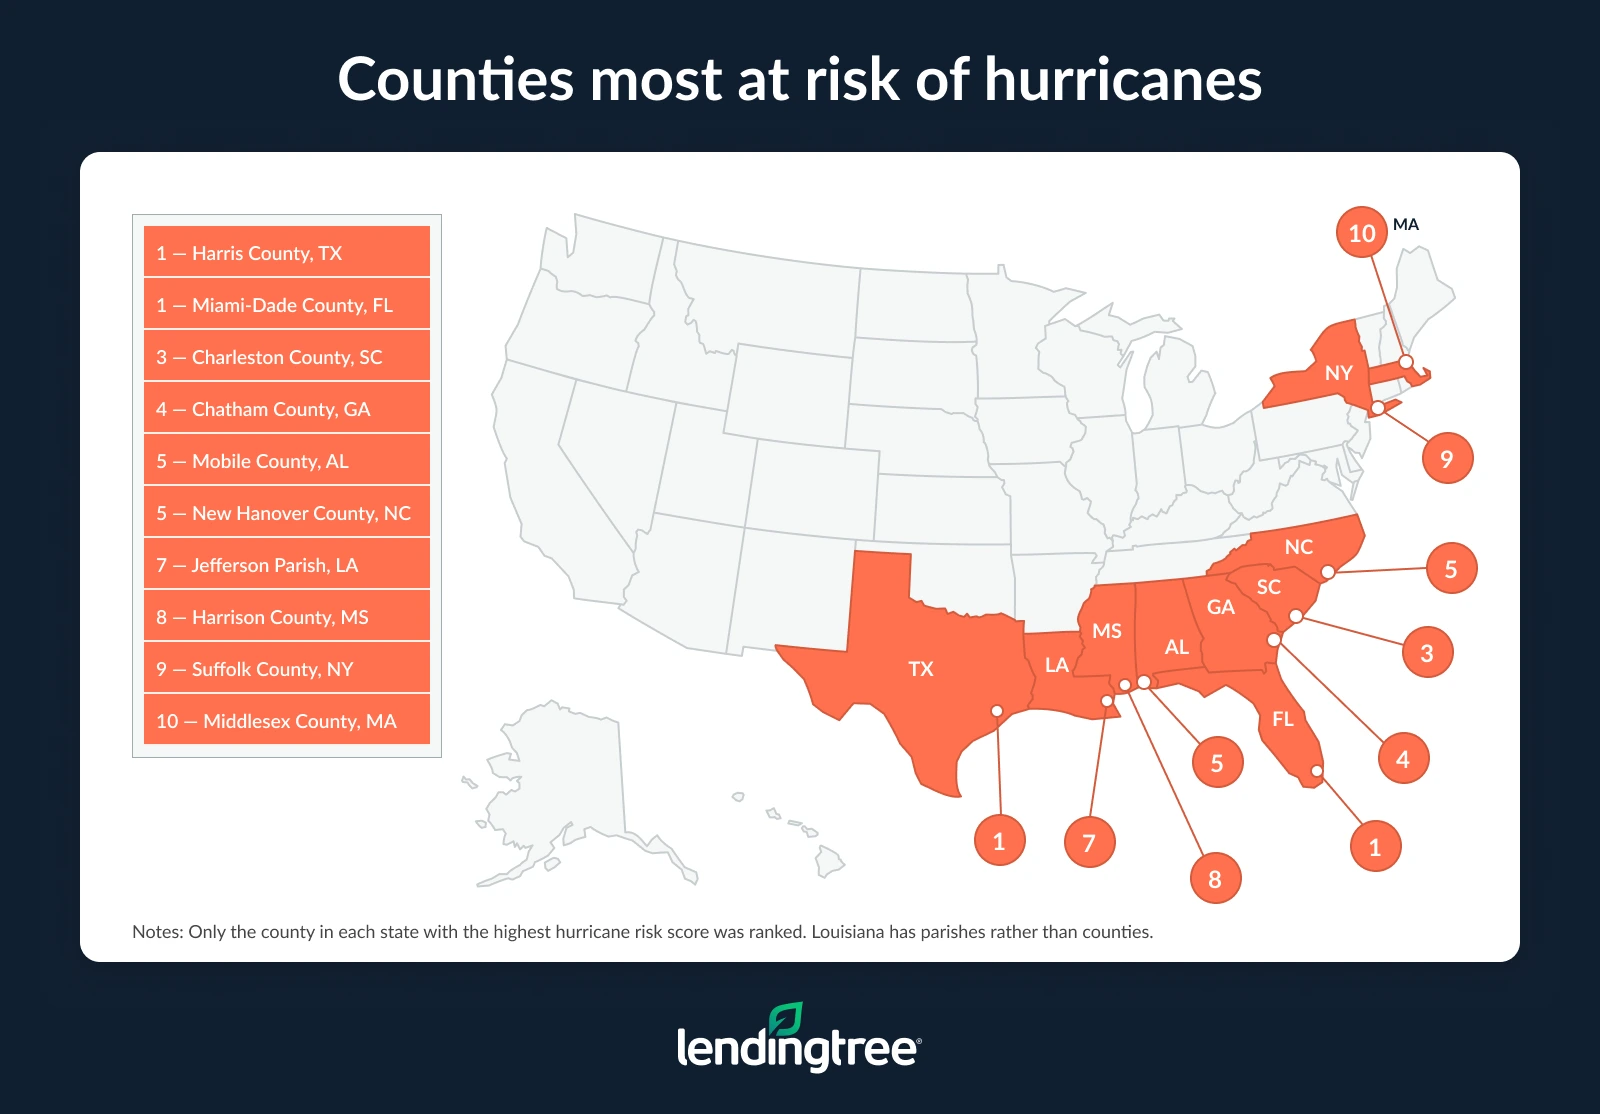
- Assessing the counties in each state with the highest hurricane risk score, Texas’ Harris County and Florida’s Miami-Dade County both have 100.0 scores. South Carolina’s Charleston County (99.6) and Georgia’s Chatham County (99.5) are closest.
Tropical cyclones expensive, deadly
Since 2000, tropical cyclones — including hurricanes, major hurricanes, tropical depressions and tropical storms — have accounted for the majority of billion-dollar disaster costs. By decade in this period, they made up the largest share in the 2000s, accounting for 70.1% of these costs.
To break that down, tropical cyclones accounted for $436.0 billion of the $621.6 billion in costs from billion-dollar disasters during that decade.
That can largely be attributed to Hurricane Katrina in 2005 — the most expensive tropical cyclone in our analysis after adjusting for inflation (more below). Other expensive tropical cyclones during this time include Hurricane Ike in 2008 (the 10th-most expensive overall), Hurricane Ivan in 2004 (12th), Hurricane Wilma in 2005 (tied for 14th), Hurricane Rita in 2005 (16th) and Hurricane Charley in 2004 (18th).
Percentage of billion-dollar disaster costs from tropical cyclones by decade
| Period | Billion-dollar tropical cyclone costs | Billion-dollar disaster costs | % of billion-dollar disaster costs from tropical cyclones |
|---|---|---|---|
| 1980-89 | $46.5 billion | $219.8 billion | 21.2% |
| 1990-99 | $125.8 billion | $335.3 billion | 37.5% |
| 2000-09 | $436.0 billion | $621.6 billion | 70.1% |
| 2010-19 | $536.3 billion | $994.7 billion | 53.9% |
| 2020-24 | $398.7 billion | $746.7 billion | 53.4% |
| Total | $1,543.3 billion | $2,918.1 billion | 52.9% |
Comparatively, tropical cyclones accounted for just 21.2% of billion-dollar disaster costs in the 1980s and 37.5% in the 1990s. Across all the tropical cyclones analyzed, the most expensive from these periods rank ninth and 19th overall: Hurricane Andrew in 1992, with $60.5 billion in damage, and Hurricane Hugo in 1989, with $22.7 billion in damage.
Hurricanes and tropical storms have also accounted for the majority of billion-dollar disaster deaths. The most expensive decades are also the most deadly: In the 2000s, tropical cyclones accounted for 78.8% of billion-dollar disaster deaths, with 2,443 of the 3,102 deaths attributed to these storms.
Percentage of billion-dollar disaster deaths from tropical cyclones by decade
| Period | Billion-dollar tropical cyclone deaths | Billion-dollar disaster deaths | % of billion-dollar disaster deaths from tropical cyclones |
|---|---|---|---|
| 1980-89 | 209 | 3,017 | 6.9% |
| 1990-99 | 299 | 3,075 | 9.7% |
| 2000-09 | 2,443 | 3,102 | 78.8% |
| 2010-19 | 3,567 | 5,227 | 68.2% |
| 2020-24 | 693 | 2,520 | 27.5% |
| Total | 7,211 | 16,941 | 42.6% |
Conversely, 6.9% of deaths in the 1980s and 9.7% of deaths in the 1990s were attributed to tropical cyclones — the lowest among the decades analyzed.
LendingTree home insurance expert and licensed insurance agent Rob Bhatt says there are multiple factors at play for the high share of costs and deaths from tropical cyclones.
“There’s scientific evidence that links rising sea temperatures to the intensification of tropical storms and hurricanes, making them more destructive,” he says. “And population growth has brought more people and buildings to areas exposed to these severe weather events. This is a dangerous combo. Storms are getting more destructive, and more people and buildings are in their path.”
Majority of costliest tropical cyclones in past 15 years
Natural disasters are becoming more frequent and severe, and tropical cyclones are no exception. In fact, seven of the 10 costliest tropical cyclones (after adjusting for inflation) since 1980 took place in the past 15 years.
The costliest storm was Hurricane Katrina in 2005, at $201.3 billion. Hurricane Harvey in 2017 follows, at $160.0 billion.
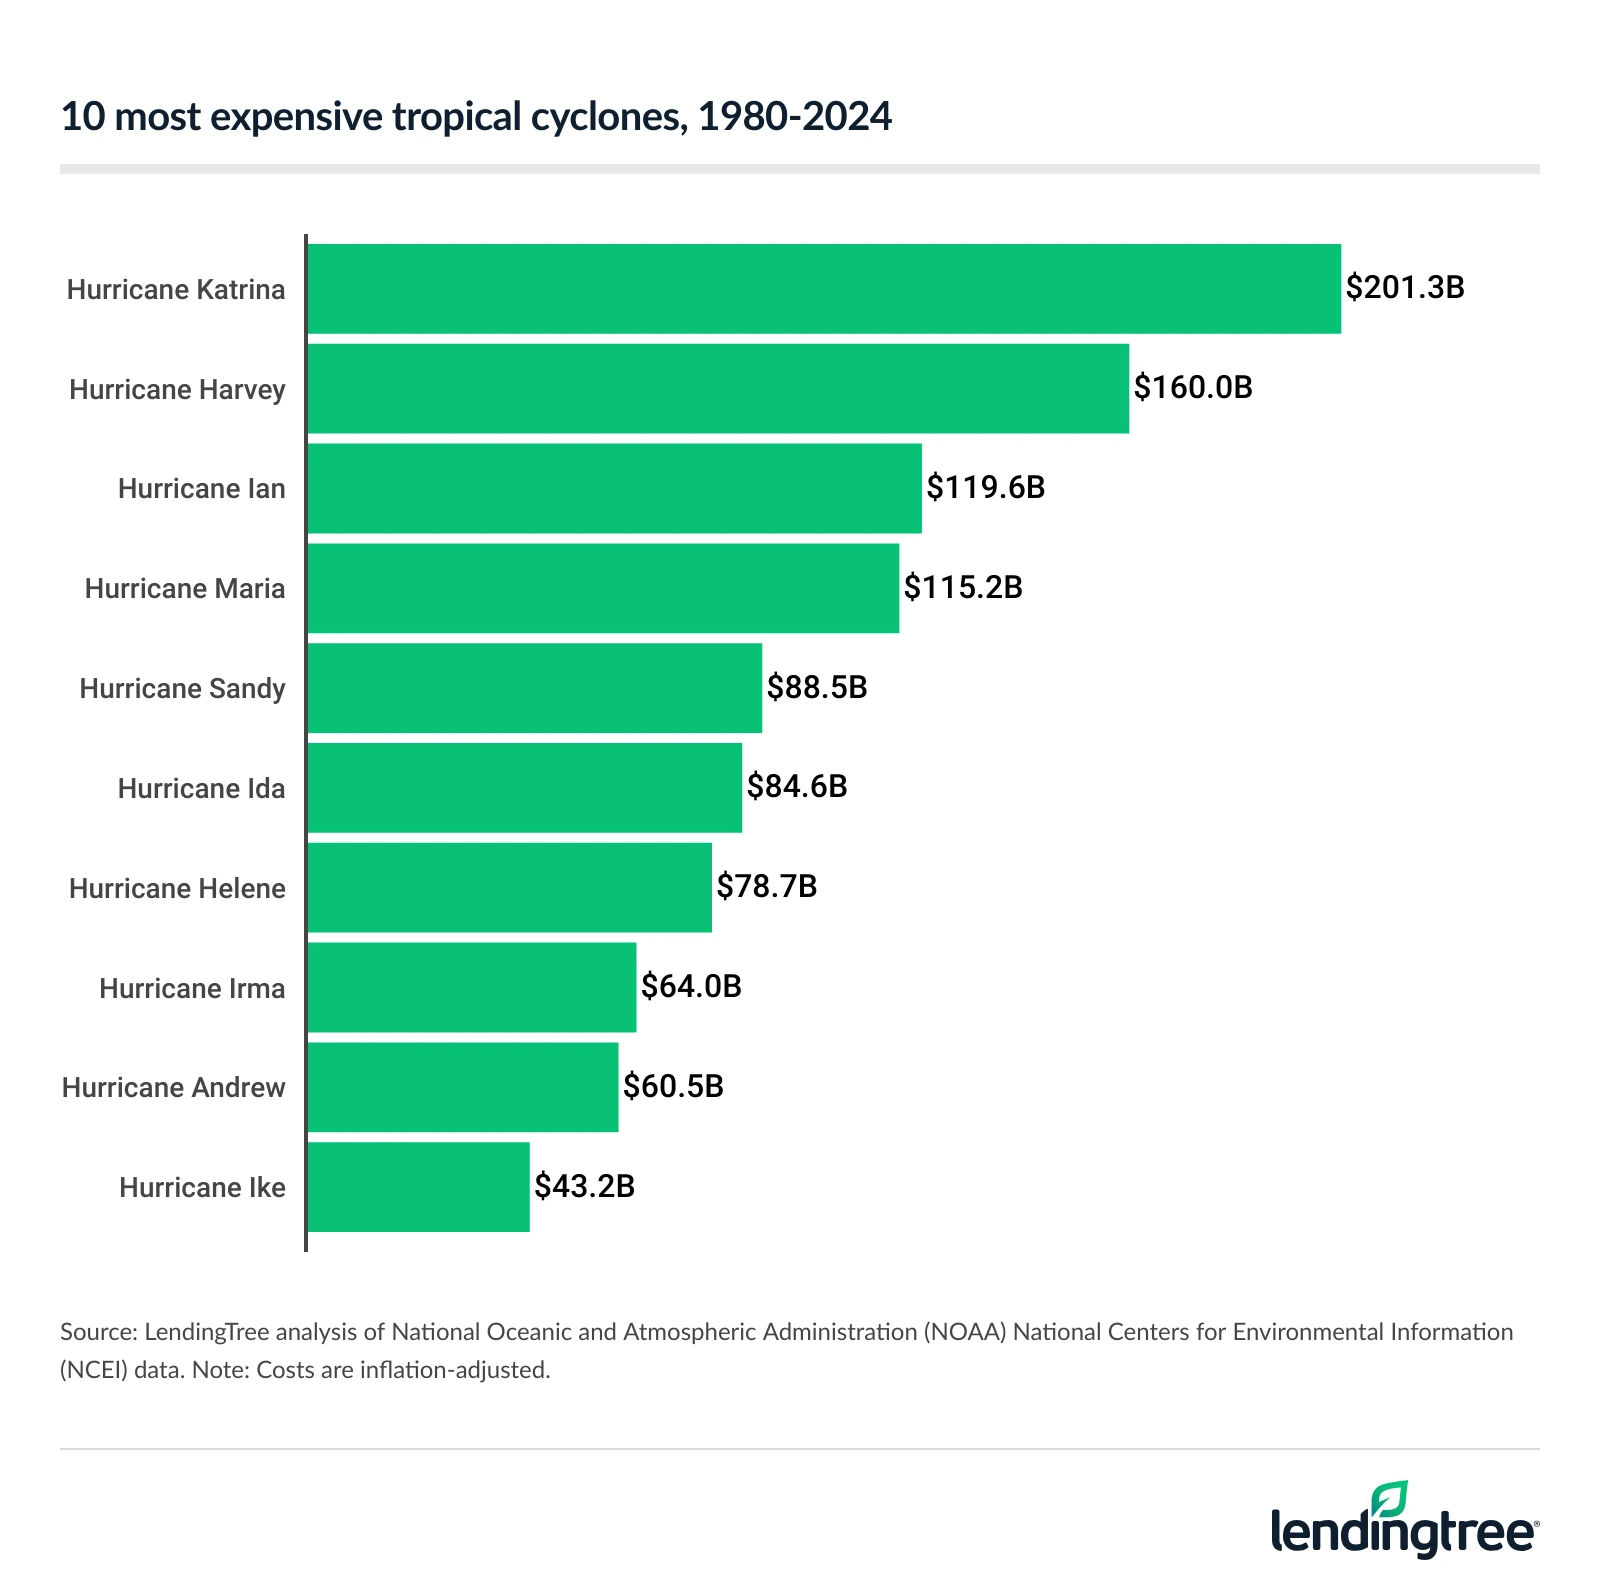
Three hurricanes in the 2020s are in the top 10. Hurricane Ian ($119.6 billion) in 2022 ranks third, Hurricane Ida ($84.6 billion) in 2021 ranks sixth and Hurricane Helene ($78.7 billion) in 2024 ranks seventh.
According to Bhatt, these recent expensive storms impact insurance.
“The costs of building and rebuilding homes have always trended up,” he says. “However, homeowners experience financial pressure when these costs outpace inflation. The problem has been particularly acute during the first half of this decade. Florida and Texas have been hit particularly hard. Homeowners in these states have seen their insurance rates increase by more than 50.0% since 2019. Other Southern states like Georgia and Alabama have seen increases of greater than 30.0%. You need a 5% to 8% raise each year to keep up with increases like these.”
Annual losses from hurricanes highest in Florida
Looking specifically at hurricanes rather than all tropical cyclones, the expected annual losses per 10,000 residents are highest in Florida at $3.6 million. That’s significantly higher than the national average of $610,199 per 10,000 residents.
Florida’s position on the Gulf Coast makes it especially vulnerable to hurricanes. The unique U-shape of the Gulf Coast traps storms more easily, increasing the risk for populated areas.
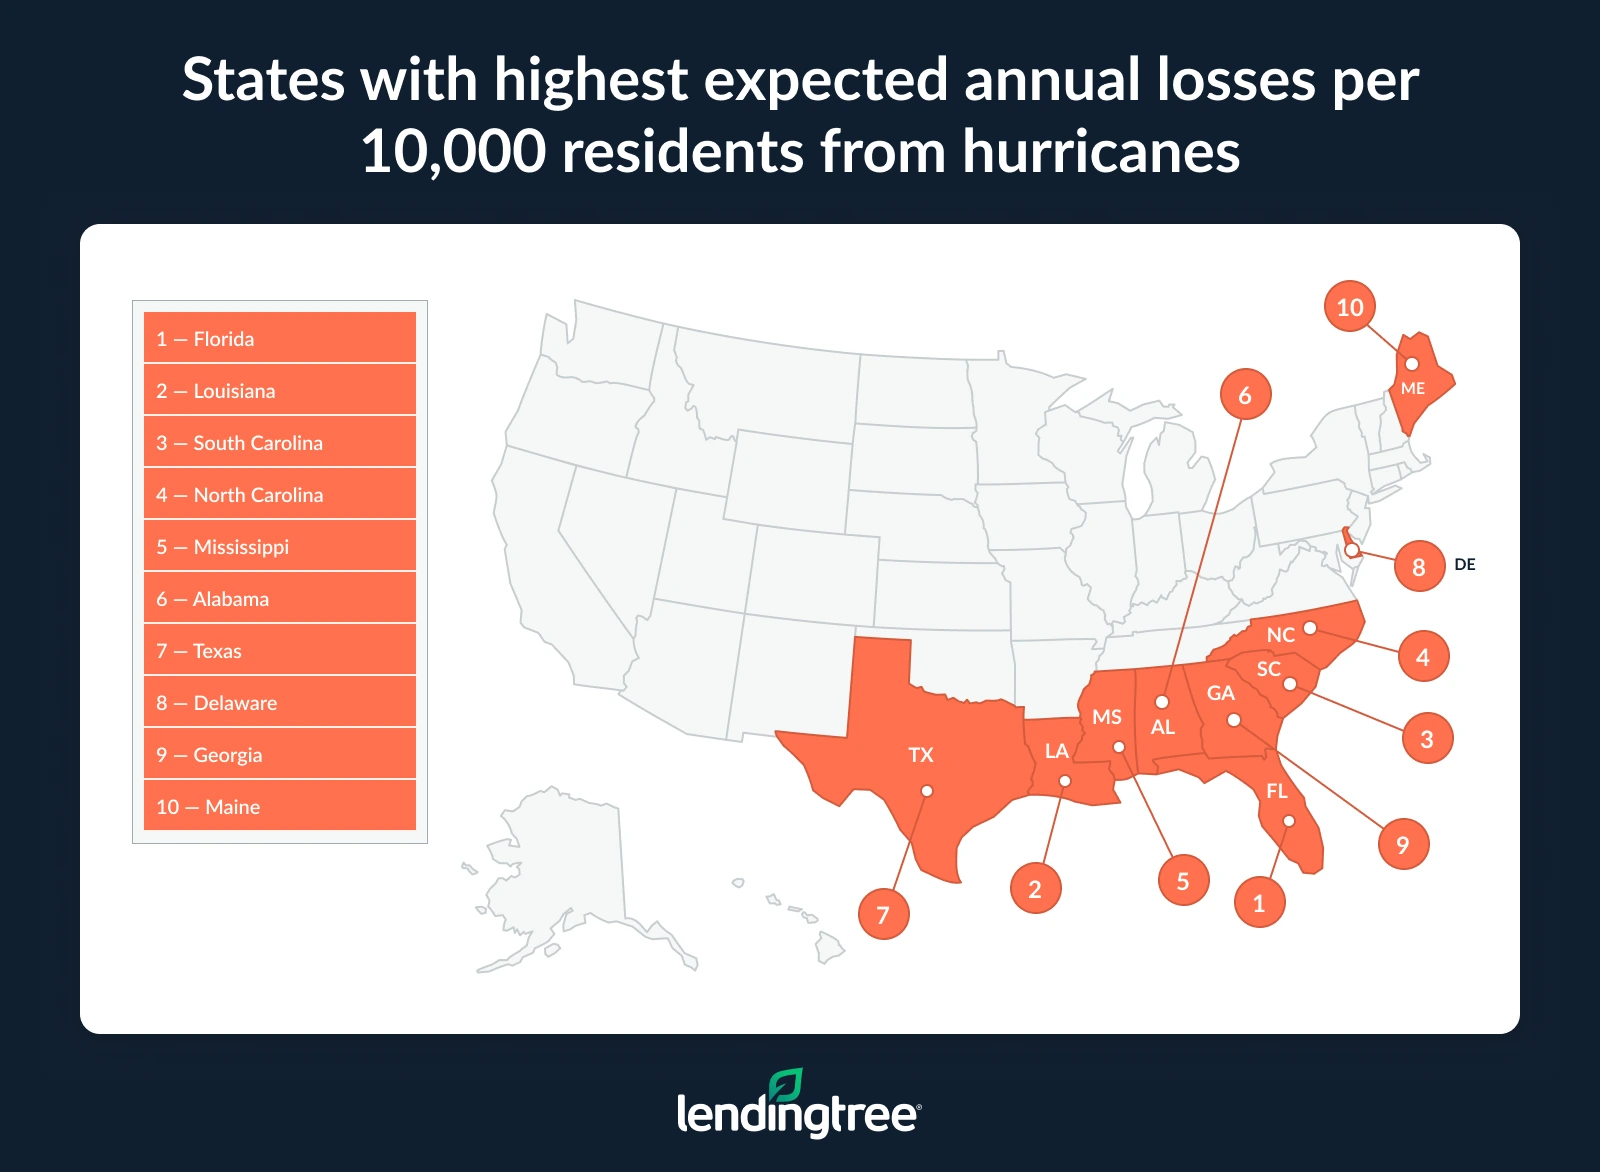
Gulf Coast state Louisiana ($3.1 million per 10,000 residents) and East Coast state South Carolina ($2.9 million) rank second and third, respectively.
Bhatt says that homeowners in these areas should take specific precautions.
“Exposure to severe weather can make home insurance extremely expensive,” he says. “It’s important to shop around to make sure you’re getting the best rate. If you’re shopping for a home, consider getting an insurance quote before you put in your offer. This lets you see how your insurance costs will affect the budget, or if the home is insurable.”
It’s also important to find out if your home is in a wind pool zone, he says. In wind pool areas, home insurance doesn’t cover wind and hail damage, so you have to buy separate windstorm insurance.
“Unless you’re in a wind pool zone, your homeowners policy covers wind damage from a hurricane,” he says. “However, home insurance doesn’t cover flooding like a storm surge that may accompany a hurricane or tropical storm. If your home is in a high-risk flood zone, you’ll have to get flood insurance for your mortgage. Flood insurance is also worth considering for homes outside of high-risk zones, mostly because floods can happen anywhere.”
Home insurance doesn’t cover flooding like a storm surge that may accompany a hurricane or tropical storm.

Full rankings: Expected annual losses per 10,000 residents from hurricanes by state
| Rank | State | Expected annual losses from hurricanes | Population | Expected annual losses per 10,000 residents | Expected annual loss score |
|---|---|---|---|---|---|
| 1 | Florida | $7,807,421,037 | 21,928,881 | $3,560,337 | 100.0 |
| 2 | Louisiana | $1,431,200,136 | 4,621,025 | $3,097,149 | 88.1 |
| 3 | South Carolina | $1,487,354,274 | 5,212,774 | $2,853,287 | 90.5 |
| 4 | North Carolina | $1,755,362,784 | 10,584,340 | $1,658,453 | 92.9 |
| 5 | Mississippi | $423,320,071 | 2,951,438 | $1,434,284 | 71.4 |
| 6 | Alabama | $627,497,655 | 5,054,253 | $1,241,524 | 83.3 |
| 7 | Texas | $2,596,233,478 | 29,640,343 | $875,912 | 97.6 |
| 8 | Delaware | $70,894,313 | 1,005,872 | $704,805 | 59.5 |
| 9 | Georgia | $743,792,336 | 10,822,590 | $687,259 | 85.7 |
| 10 | Maine | $94,458,821 | 1,377,400 | $685,776 | 61.9 |
| 11 | Connecticut | $243,369,130 | 3,598,348 | $676,336 | 64.3 |
| 12 | Maryland | $416,834,558 | 6,170,738 | $675,502 | 69.0 |
| 13 | Virginia | $578,978,905 | 8,657,499 | $668,760 | 78.6 |
| 14 | Massachusetts | $428,207,096 | 6,992,395 | $612,390 | 73.8 |
| 15 | Rhode Island | $55,818,001 | 1,095,371 | $509,581 | 54.8 |
| 16 | New Hampshire | $67,329,740 | 1,387,834 | $485,143 | 57.1 |
| 17 | New Jersey | $433,282,926 | 9,267,014 | $467,554 | 76.2 |
| 18 | New York | $604,013,221 | 19,872,319 | $303,947 | 81.0 |
| 19 | Pennsylvania | $291,905,659 | 12,986,518 | $224,776 | 66.7 |
| 20 | Vermont | $13,884,798 | 645,254 | $215,183 | 45.2 |
| 21 | District of Columbia | $12,494,975 | 672,079 | $185,915 | 40.5 |
| 22 | Hawaii | $24,126,270 | 1,445,635 | $166,890 | 50.0 |
| 23 | West Virginia | $14,826,921 | 1,784,462 | $83,089 | 47.6 |
| 24 | Arkansas | $9,016,811 | 3,032,651 | $29,732 | 35.7 |
| 25 | Tennessee | $11,714,195 | 6,986,082 | $16,768 | 38.1 |
| 26 | Kentucky | $5,660,941 | 4,510,725 | $12,550 | 33.3 |
| 27 | Ohio | $13,650,119 | 11,780,046 | $11,587 | 42.9 |
| 28 | Oklahoma | $2,653,652 | 3,995,260 | $6,642 | 23.8 |
| 29 | Michigan | $5,290,255 | 10,051,595 | $5,263 | 31.0 |
| 30 | Indiana | $3,496,968 | 6,811,752 | $5,134 | 26.2 |
| 31 | Missouri | $2,635,440 | 6,168,181 | $4,273 | 21.4 |
| 32 | Illinois | $3,558,363 | 12,692,653 | $2,803 | 28.6 |
| 33 | New Mexico | $327,010 | 2,114,768 | $1,546 | 11.9 |
| 34 | Iowa | $353,012 | 3,195,937 | $1,105 | 14.3 |
| 35 | Kansas | $317,113 | 2,937,569 | $1,080 | 7.1 |
| 36 | Wisconsin | $566,689 | 5,892,023 | $962 | 16.7 |
| 37 | Arizona | $324,250 | 7,268,175 | $446 | 9.5 |
| 38 | California | $66,430 | 39,242,785 | $17 | 4.8 |
| 39 | Minnesota | $2,158 | 5,713,716 | $4 | 2.4 |
Hurricane risk scores highest in Texas, Florida
Some areas have higher hurricane risk scores, which are determined by looking at expected annual losses, social vulnerability (a community’s susceptibility to death, injury, loss and more) and community resilience (the ability to prepare for hurricanes and recover quickly).
Looking at the counties in each state with the highest hurricane risk scores, Harris County in Texas and Miami-Dade County in Florida both have 100.0 scores — the highest possible value. South Carolina’s Charleston County (99.6) and Georgia’s Chatham County (99.5) rank third and fourth, respectively.
Looking across the most populous metros, the scores align similarly. Houston (100.0), Miami (100.0) and Tampa, Fla. (99.8), are the most at risk of hurricanes. This aligns with Harris County and Miami-Dade County being the top counties in their respective states.
Orlando, Fla. (99.1), and New York (96.7) round out the top five. That means three of the top five most at-risk metros are in Florida.
Full rankings: Counties most at risk of hurricanes in each state
| Rank | State | County | Hurricane risk score |
|---|---|---|---|
| 1 | Texas | Harris | 100.0 |
| 1 | Florida | Miami-Dade | 100.0 |
| 3 | South Carolina | Charleston | 99.6 |
| 4 | Georgia | Chatham | 99.5 |
| 5 | Alabama | Mobile | 99.4 |
| 5 | North Carolina | New Hanover | 99.4 |
| 7 | Louisiana | Jefferson | 99.0 |
| 8 | Mississippi | Harrison | 98.3 |
| 9 | New York | Suffolk | 98.0 |
| 10 | Massachusetts | Middlesex | 97.4 |
| 11 | Connecticut | Fairfield | 97.0 |
| 12 | Virginia | Fairfax | 96.9 |
| 13 | Maryland | Baltimore | 96.4 |
| 14 | New Jersey | Monmouth | 95.8 |
| 15 | Pennsylvania | Philadelphia | 95.4 |
| 16 | Delaware | Sussex | 95.1 |
| 17 | Rhode Island | Providence | 93.4 |
| 18 | New Hampshire | Hillsborough | 91.4 |
| 19 | Maine | Cumberland | 90.0 |
| 20 | District of Columbia | District of Columbia | 88.9 |
| 21 | Hawaii | Honolulu | 88.4 |
| 22 | West Virginia | Berkeley | 78.7 |
| 23 | Vermont | Windham | 75.7 |
| 24 | Tennessee | Shelby | 72.1 |
| 25 | Arkansas | Pulaski | 69.2 |
| 26 | Ohio | Cuyahoga | 68.2 |
| 27 | Michigan | Wayne | 64.2 |
| 28 | Illinois | Cook | 62.2 |
| 29 | Oklahoma | Tulsa | 56.2 |
| 30 | Kentucky | Fayette | 55.9 |
| 31 | Missouri | St. Louis | 53.5 |
| 32 | Indiana | Elkhart | 51.1 |
| 33 | Arizona | Maricopa | 46.5 |
| 34 | New Mexico | Doña Ana | 43.9 |
| 35 | Kansas | Sedgwick | 40.7 |
| 36 | Wisconsin | Dane | 34.1 |
| 37 | California | Riverside | 27.2 |
| 38 | Iowa | Polk | 26.5 |
| 39 | Minnesota | Houston | 1.5 |
Full rankings: Most populous metros most at risk of hurricanes
| Rank | Metro | Hurricane risk score |
|---|---|---|
| 1 | Houston, TX | 100.0 |
| 1 | Miami, FL | 100.0 |
| 3 | Tampa, FL | 99.8 |
| 4 | Orlando, FL | 99.1 |
| 5 | New York, NY | 96.7 |
| 6 | Baltimore, MD | 96.4 |
| 7 | Philadelphia, PA | 95.4 |
| 8 | Boston, MA | 95.0 |
| 9 | Washington, DC | 88.9 |
| 10 | Charlotte, NC | 88.7 |
| 11 | San Antonio, TX | 87.6 |
| 12 | Atlanta, GA | 80.5 |
| 13 | Dallas, TX | 76.9 |
| 14 | Detroit, MI | 64.2 |
| 15 | Chicago, IL | 62.2 |
| 16 | St. Louis, MO | 53.5 |
| 17 | Phoenix, AZ | 46.5 |
| 18 | Riverside, CA | 27.2 |
| 19 | San Diego, CA | 25.3 |
| 20 | Los Angeles, CA | 0.0 |
| 20 | San Francisco, CA | 0.0 |
| 20 | Seattle, WA | 0.0 |
| 20 | Minneapolis, MN | 0.0 |
| 20 | Denver, CO | 0.0 |
| 20 | Portland, OR | 0.0 |
Mitigating hurricane risk: Top expert tips
If you’re in an area prone to hurricanes, there are a few ways you can minimize damage and ensure sufficient home insurance coverage. We offer the following advice:
- The most important thing is to have an evacuation plan to keep your family safe. “Set up a place to meet if your neighborhood is inaccessible and designate a friend or family member outside your area as a point of contact for communication,” Bhatt says.
- Retrofitting your home with a wind-resistant roof and windows can often get you an insurance discount. For example, Florida requires insurance companies to give homeowners a discount for eligible renovations like these.
- Opt for high deductibles. “Raising your deductibles generally reduces your insurance premiums,” Bhatt says. “Just make sure to bank some of your savings so you’ll have funds available if a disaster strikes.”
- Avoid filing insurance claims for relatively small losses or repairs you can cover out of your own pocket. “Most insurance companies increase your rate after a claim of any size,” he says. “If you have multiple claims within a short span, your insurance company may drop you.”
Methodology
LendingTree researchers analyzed billion-dollar disaster data from the National Oceanic and Atmospheric Administration (NOAA) National Centers for Environmental Information (NCEI). We used this to calculate:
- The percentage of billion-dollar disaster costs from tropical cyclones
- The percentage of billion-dollar disaster deaths from tropical cyclones
- Inflation-adjusted costs by tropical cyclone
According to NOAA, tropical cyclones include hurricanes, major hurricanes, tropical depressions and tropical storms.
Each state’s expected annual losses from hurricanes — via the Federal Emergency Management Agency (FEMA) National Risk Index (NRI) — were used with population data — via the U.S. Census Bureau 2023 American Community Survey (ACS) with five-year estimates — to calculate expected annual losses per 10,000 residents from hurricanes. Hurricane risk index score data via the NRI was used to find the most at-risk county in each state and the most at-risk metros among the most populous ones.