Fatal Crashes Spike 19.4% in Urban Areas


Cities may have lower speed limits and more traffic lights, but fatal car crashes happen more often in urban areas than on rural roads. According to a LendingTree study, 59.5% of fatal crashes in 2023 were in urban areas.
We’ll break down which states have higher percentages of urban and rural fatal crashes, as well as offer tips on utilizing your auto insurance to prepare for accidents.
Key findings
- Urban areas accounted for nearly 3 in 5 fatal crashes. 59.5% of fatal crashes in the U.S. in 2023 were in urban areas, with 39.7% in rural areas. However, the disparity between urban and rural fatal crashes varies significantly by state.
- Massachusetts saw a significantly higher proportion of crashes in urban areas. 95.4% of fatal crashes in the state in 2023 were in urban areas, while 4.6% were in rural areas — a 90.8 percentage point difference. Maryland (93.2%, or 87.7 difference) and Hawaii (90.9%, or 82.9 difference) had the next highest proportions.
- Conversely, rural areas accounted for the vast majority of fatal crashes in Vermont. The Green Mountain State had a 73.0 percentage point difference in rural and urban fatal crashes in 2023, with 85.7% in rural areas and 12.7% in urban areas. North Dakota (83.3%, or 66.6 difference) and Maine (80.3%, or 60.6 difference) followed.
- Fatal crashes increased more steeply in urban areas. Fatal crashes in urban areas increased by 19.4% from 18,753 in 2019 to 22,400 in 2023. Over the same period, fatal crashes in rural areas increased by just 2.1%.
- Wyoming saw the biggest jump in urban fatal crashes. Between 2019 and 2023, fatal crashes in Wyoming urban areas jumped by 57.9%. South Carolina (54.2%) and Idaho (54.0%) saw the next biggest increases. Meanwhile, South Dakota (43.7%), Washington (29.1%) and New Hampshire (28.6%) saw the biggest jumps in rural fatal crashes in the same period.
Higher percentage of fatal crashes occur in urban areas
Cities can be hot spots for dangerous driving. In fact, 59.5% of fatal crashes in 2023 were in urban areas, versus 39.7% in rural areas. (Despite this, rural roads account for 70.2% of public road miles, versus 29.8% for urban roads, according to Federal Highway Administration, or FHWA, data.)
LendingTree auto insurance expert and licensed insurance agent Rob Bhatt says that’s a commonly understood disparity. “Crash risks are inherently higher in cities and suburbs than in the country,” he says. “Simply, drivers have more vehicles and people to crash into.”
Alcohol was a significant contributing factor for fatal crashes in both urban and rural areas in 2023, at 35.2% and 35.0%, respectively. Speeding contributed to 28.4% of fatal crashes in urban areas and 27.6% in rural areas. And motorcycles were more likely to be involved in fatal crashes in urban areas than in rural areas, at 18.1% versus 14.4%.
Contributing factors in fatal crashes by area type, 2023
| Contributing factors | % involved in urban fatal crashes | % involved in rural fatal crashes |
|---|---|---|
| Alcohol | 35.2% | 35.0% |
| Speeding | 28.4% | 27.6% |
| Large trucks | 9.9% | 17.9% |
| Motorcycles | 18.1% | 14.4% |
| Distracted | 7.7% | 8.4% |
In contrast, large trucks were involved in 17.9% of fatal crashes in rural areas, versus just 9.9% of fatal crashes in urban areas.
Massachusetts saw highest proportion of urban fatal crashes
By state, Massachusetts saw the biggest disparity in fatal crashes in urban areas.
A staggering 95.4% of fatal crashes in Massachusetts were in urban areas, versus just 4.6% in rural areas. That’s a 90.8 percentage point difference.
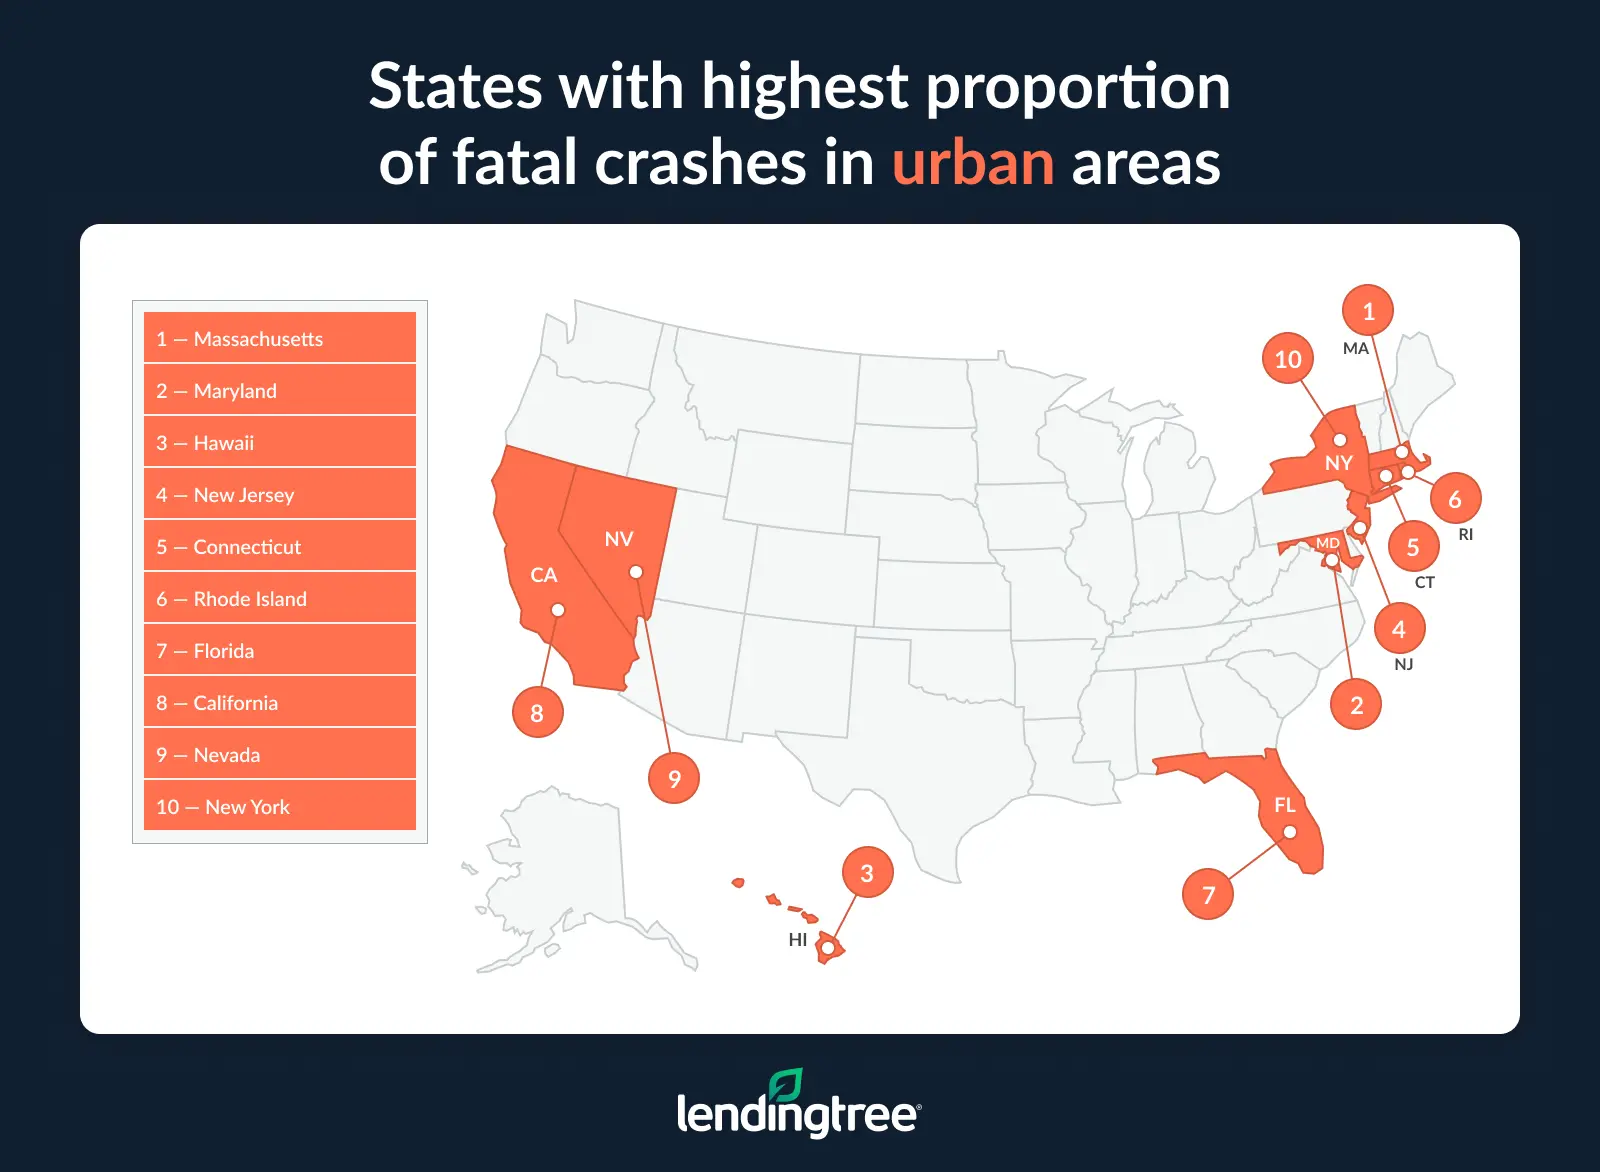
Maryland followed, with 93.2% of crashes in urban areas and 5.5% in rural areas — an 87.7 percentage point difference. Hawaii rounded out the top three, at 90.9% in urban areas and 8.0% in rural areas — an 82.9 difference.
Bhatt says that may impact insurance rates in these states.
“The crash rates in your area are among several factors insurance companies look at to determine your rate,” he says. “Insurance companies tend to look at crash rates per capita and by vehicle miles driven. We tend to see lower auto insurance rates in rural areas because they usually have lower crash rates. That said, there are outliers. If you live in a rural area with a high crash rate, you may get a higher insurance rate than drivers in a nearby urban area with a lower crash rate.”
Fatal crashes in rural areas most common in Vermont
As for the states with the highest share of crashes in rural areas, Vermont ranked first. Here, 85.7% of crashes were in rural areas and 12.7% were in urban areas — a 73.0 percentage point difference.
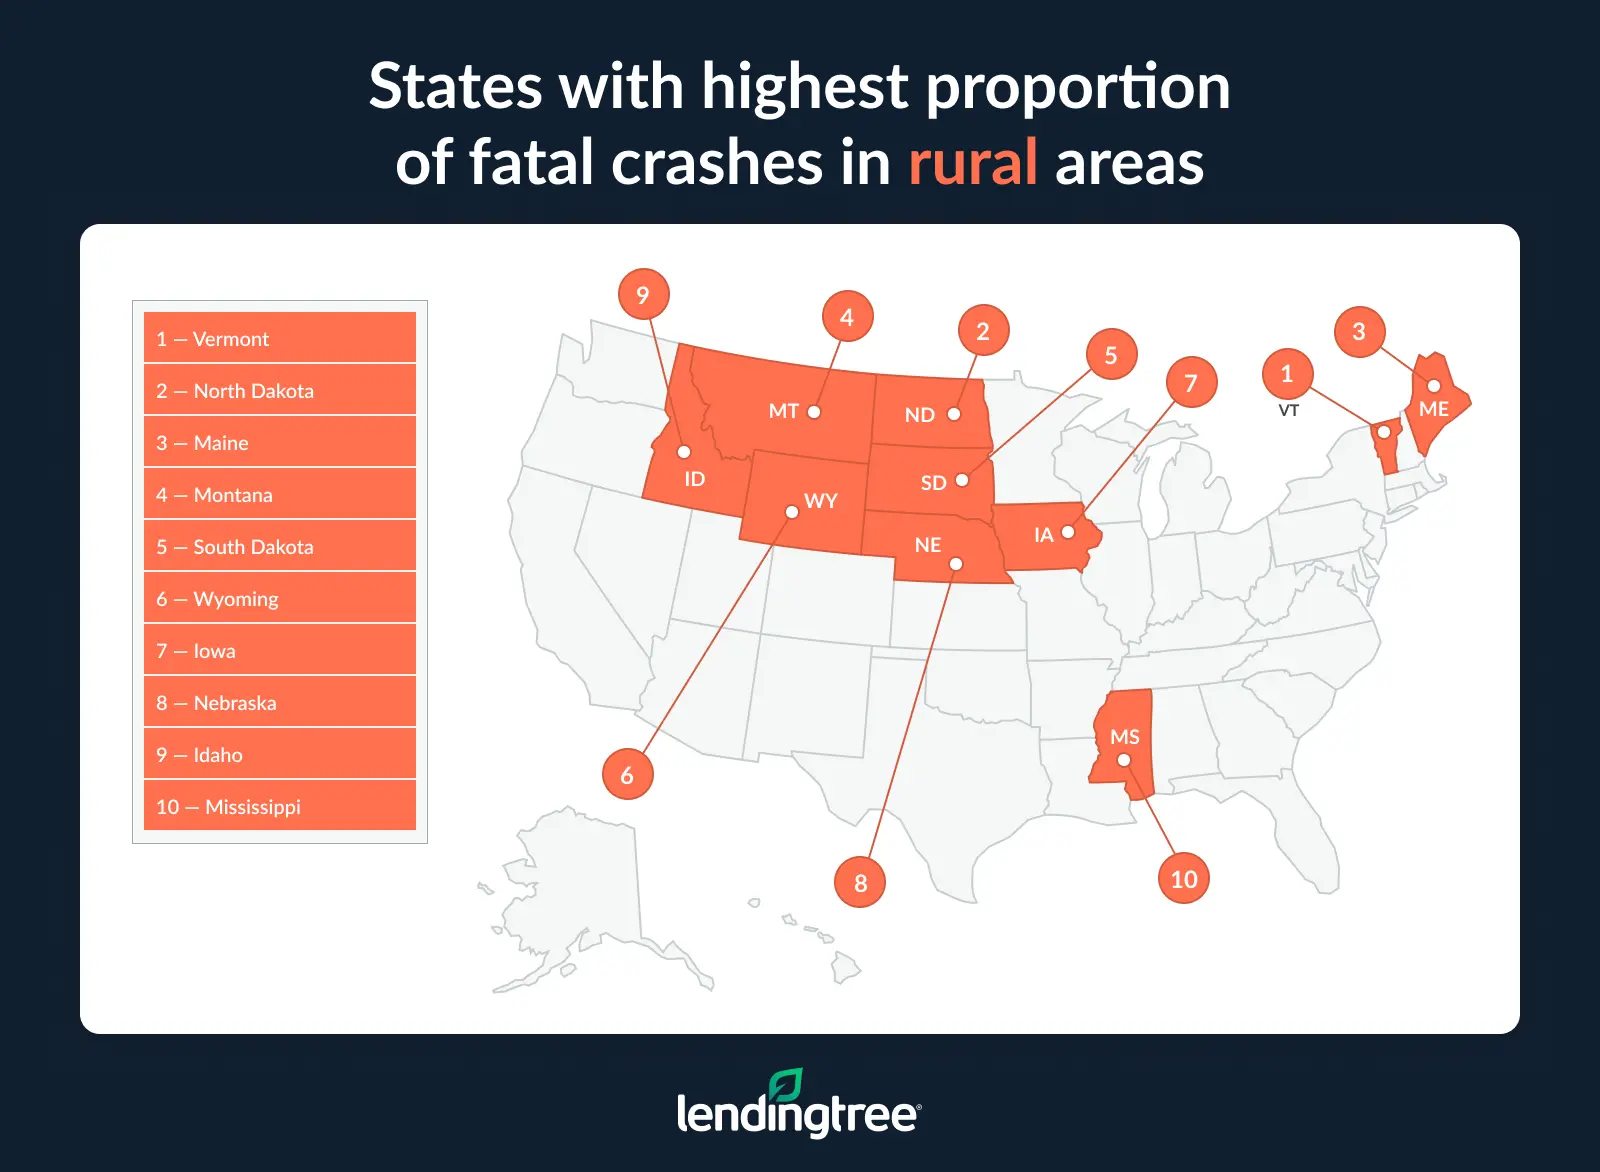
North Dakota followed, with 83.3% of fatal crashes in rural areas and 16.7% in urban areas — a difference of 66.6. Maine (80.3%) followed based on proportions, though Montana would take the third spot if measured by percentage point difference.
At 59.5% in urban areas and 39.7% in rural areas, the national difference is 19.8 percentage points.
Full rankings: Percentage point difference in fatal crashes by area type, 2023
| Rank | State | % in urban areas | % in rural areas | % point difference |
|---|---|---|---|---|
| 1 | Massachusetts | 95.4% | 4.6% | 90.8 |
| 2 | Maryland | 93.2% | 5.5% | 87.7 |
| 3 | Hawaii | 90.9% | 8.0% | 82.9 |
| 4 | New Jersey | 89.7% | 8.7% | 81.0 |
| 5 | Connecticut | 86.2% | 13.5% | 72.7 |
| 6 | Rhode Island | 85.1% | 13.4% | 71.7 |
| 7 | Florida | 75.5% | 20.4% | 55.1 |
| 8 | Nevada | 75.2% | 23.4% | 51.8 |
| 9 | California | 75.4% | 24.3% | 51.1 |
| 10 | New York | 74.2% | 25.7% | 48.5 |
| 11 | Arizona | 70.9% | 25.9% | 45.0 |
| 12 | Illinois | 67.8% | 32.1% | 35.7 |
| 13 | Georgia | 65.7% | 34.3% | 31.4 |
| 14 | Colorado | 64.7% | 35.0% | 29.7 |
| 15 | Delaware | 62.5% | 35.9% | 26.6 |
| 16 | Texas | 62.3% | 37.5% | 24.8 |
| 17 | Ohio | 62.1% | 37.7% | 24.4 |
| 18 | Tennessee | 62.0% | 37.9% | 24.1 |
| 19 | Michigan | 61.4% | 37.7% | 23.7 |
| 20 | Utah | 61.0% | 39.0% | 22.0 |
| 21 | Washington | 59.9% | 38.7% | 21.2 |
| 22 | Pennsylvania | 56.6% | 43.2% | 13.4 |
| 23 | Louisiana | 51.5% | 44.0% | 7.5 |
| 24 | Virginia | 48.8% | 50.1% | -1.3 |
| 25 | New Mexico | 49.3% | 50.7% | -1.4 |
| 25 | Missouri | 48.8% | 50.4% | -1.6 |
| 27 | Oregon | 49.1% | 50.9% | -1.8 |
| 28 | New Hampshire | 48.4% | 51.6% | -3.2 |
| 29 | South Carolina | 46.9% | 53.1% | -6.2 |
| 30 | Oklahoma | 45.7% | 53.3% | -7.6 |
| 31 | Minnesota | 43.5% | 55.9% | -12.4 |
| 32 | Indiana | 43.3% | 56.7% | -13.4 |
| 33 | Alaska | 41.1% | 58.9% | -17.8 |
| 34 | Kansas | 40.5% | 59.2% | -18.7 |
| 35 | Alabama | 40.2% | 59.5% | -19.3 |
| 36 | Wisconsin | 40.2% | 59.8% | -19.6 |
| 37 | Kentucky | 39.9% | 60.0% | -20.1 |
| 38 | Arkansas | 38.4% | 61.6% | -23.2 |
| 39 | North Carolina | 36.6% | 63.4% | -26.8 |
| 40 | West Virginia | 35.6% | 64.4% | -28.8 |
| 41 | Mississippi | 32.8% | 66.0% | -33.2 |
| 42 | Idaho | 31.8% | 68.2% | -36.4 |
| 43 | Nebraska | 31.1% | 68.4% | -37.3 |
| 44 | Iowa | 30.5% | 69.5% | -39.0 |
| 45 | Wyoming | 24.8% | 75.2% | -50.4 |
| 46 | South Dakota | 20.3% | 79.7% | -59.4 |
| 47 | Maine | 19.7% | 80.3% | -60.6 |
| 48 | Montana | 18.4% | 80.1% | -61.7 |
| 49 | North Dakota | 16.7% | 83.3% | -66.6 |
| 50 | Vermont | 12.7% | 85.7% | -73.0 |
Fatal crashes in urban areas rise significantly
Fatal crashes aren’t only more common in urban areas, but they’ve also been rising faster than those in rural areas.
From 2019 to 2023, fatal crashes in urban areas rose 19.4% from 18,753 to 22,400. (In 2023, that accounts for 178.8 fatal crashes per 10,000 miles of urban roads.) Meanwhile, fatal crashes in rural areas rose just 2.1% from 14,626 to 14,938. (In 2023, that accounts for 50.7 fatal crashes per 10,000 miles of rural roads.)
By state, fatal urban crashes rose the most in Wyoming. From 2019 to 2023, fatal crashes in Wyoming urban areas jumped by 57.9%. South Carolina (54.2%) and Idaho (54.0%) followed.
Meanwhile, fatal urban crashes stayed the same or fell in eight states, led by Alaska (-17.9%), North Carolina (-14.9%) and Maine (-10.7%). These three were the only states with double-digit decreases.
Biggest percentage changes in fatal crashes in urban areas by state, 2019-23
| Rank | State | Fatal crashes In urban areas, 2019 | Fatal crashes in urban areas, 2023 | % change |
|---|---|---|---|---|
| 1 | Wyoming | 19 | 30 | 57.9% |
| 2 | South Carolina | 297 | 458 | 54.2% |
| 3 | Idaho | 50 | 77 | 54.0% |
As for the states with the biggest increases in fatal rural crashes, South Dakota ranked first with a 43.7% increase from 2019 to 2023. Washington (29.1%) and New Hampshire (28.6%) followed.
Fatal rural crashes stayed the same or fell in 21 states. Maryland (-70.6%), Hawaii (-66.7%) and Massachusetts (-37.5%) saw the biggest decreases by a wide margin.
Full rankings: Percentage change in fatal crashes in urban areas by state, 2019-23
| Rank | State | Fatal crashes in urban areas, 2019 | Fatal crashes in urban areas, 2023 | % change |
|---|---|---|---|---|
| 1 | Wyoming | 19 | 30 | 57.9% |
| 2 | South Carolina | 297 | 458 | 54.2% |
| 3 | Idaho | 50 | 77 | 54.0% |
| 4 | South Dakota | 17 | 26 | 52.9% |
| 5 | Washington | 289 | 439 | 51.9% |
| 6 | Arizona | 569 | 847 | 48.9% |
| 7 | New Hampshire | 40 | 59 | 47.5% |
| 8 | Oklahoma | 200 | 294 | 47.0% |
| 9 | Kentucky | 209 | 306 | 46.4% |
| 10 | Nevada | 182 | 264 | 45.1% |
| 11 | Montana | 25 | 36 | 44.0% |
| 12 | Maryland | 380 | 538 | 41.6% |
| 13 | Connecticut | 184 | 249 | 35.3% |
| 14 | Colorado | 322 | 431 | 33.9% |
| 15 | Virginia | 312 | 417 | 33.7% |
| 16 | Arkansas | 159 | 208 | 30.8% |
| 17 | Oregon | 201 | 262 | 30.3% |
| 18 | Tennessee | 584 | 756 | 29.5% |
| 19 | Illinois | 612 | 775 | 26.6% |
| 20 | Ohio | 566 | 714 | 26.1% |
| 21 | Mississippi | 175 | 218 | 24.6% |
| 22 | Pennsylvania | 515 | 641 | 24.5% |
| 23 | Indiana | 302 | 365 | 20.9% |
| 24 | Utah | 127 | 153 | 20.5% |
| 25 | New York | 642 | 767 | 19.5% |
| 26 | Texas | 2,024 | 2,415 | 19.3% |
| 27 | Wisconsin | 180 | 213 | 18.3% |
| 28 | Michigan | 536 | 626 | 16.8% |
| 29 | California | 2,416 | 2,810 | 16.3% |
| 30 | Louisiana | 342 | 389 | 13.7% |
| 31 | Missouri | 390 | 442 | 13.3% |
| 32 | New Mexico | 175 | 198 | 13.1% |
| 33 | Minnesota | 143 | 161 | 12.6% |
| 34 | New Jersey | 459 | 514 | 12.0% |
| 35 | Iowa | 91 | 100 | 9.9% |
| 36 | Florida | 2,214 | 2,404 | 8.6% |
| 37 | Georgia | 913 | 980 | 7.3% |
| 38 | Delaware | 77 | 80 | 3.9% |
| 39 | Massachusetts | 299 | 310 | 3.7% |
| 40 | Kansas | 141 | 143 | 1.4% |
| 41 | North Dakota | 16 | 16 | 0.0% |
| 41 | Hawaii | 80 | 80 | 0.0% |
| 43 | West Virginia | 84 | 83 | -1.2% |
| 44 | Alabama | 372 | 359 | -3.5% |
| 45 | Nebraska | 67 | 64 | -4.5% |
| 46 | Maine | 28 | 25 | -10.7% |
| 47 | North Carolina | 624 | 531 | -14.9% |
| 48 | Alaska | 28 | 23 | -17.9% |
Full rankings: Percentage change in fatal crashes in rural areas by state, 2019-23
| Rank | State | Fatal crashes in rural areas, 2019 | Fatal crashes in rural areas, 2023 | % change |
|---|---|---|---|---|
| 1 | South Dakota | 71 | 102 | 43.7% |
| 2 | Washington | 220 | 284 | 29.1% |
| 3 | New Hampshire | 49 | 63 | 28.6% |
| 4 | North Carolina | 731 | 918 | 25.6% |
| 5 | Illinois | 320 | 367 | 14.7% |
| 5 | Texas | 1,267 | 1,453 | 14.7% |
| 7 | New York | 236 | 265 | 12.3% |
| 8 | Montana | 141 | 157 | 11.3% |
| 9 | Idaho | 150 | 165 | 10.0% |
| 10 | Georgia | 465 | 511 | 9.9% |
| 11 | Alabama | 484 | 531 | 9.7% |
| 12 | Minnesota | 189 | 207 | 9.5% |
| 13 | Mississippi | 405 | 439 | 8.4% |
| 14 | Oregon | 254 | 272 | 7.1% |
| 15 | Indiana | 447 | 477 | 6.7% |
| 15 | North Dakota | 75 | 80 | 6.7% |
| 17 | Arkansas | 314 | 334 | 6.4% |
| 17 | Michigan | 362 | 385 | 6.4% |
| 19 | Missouri | 429 | 456 | 6.3% |
| 20 | Colorado | 220 | 233 | 5.9% |
| 21 | New Mexico | 194 | 204 | 5.2% |
| 22 | Pennsylvania | 469 | 490 | 4.5% |
| 23 | Iowa | 222 | 228 | 2.7% |
| 24 | Delaware | 45 | 46 | 2.2% |
| 25 | Tennessee | 456 | 462 | 1.3% |
| 26 | Utah | 97 | 98 | 1.0% |
| 27 | Kentucky | 458 | 460 | 0.4% |
| 28 | Alaska | 33 | 33 | 0.0% |
| 29 | Louisiana | 339 | 332 | -2.1% |
| 30 | Nebraska | 145 | 141 | -2.8% |
| 31 | Arizona | 322 | 310 | -3.7% |
| 32 | West Virginia | 157 | 150 | -4.5% |
| 33 | Kansas | 219 | 209 | -4.6% |
| 34 | Virginia | 459 | 428 | -6.8% |
| 35 | Wisconsin | 341 | 317 | -7.0% |
| 36 | Ohio | 467 | 433 | -7.3% |
| 37 | Wyoming | 100 | 91 | -9.0% |
| 38 | California | 1,007 | 906 | -10.0% |
| 39 | Oklahoma | 383 | 343 | -10.4% |
| 40 | Maine | 115 | 102 | -11.3% |
| 41 | Florida | 736 | 650 | -11.7% |
| 42 | Connecticut | 46 | 39 | -15.2% |
| 43 | New Jersey | 59 | 50 | -15.3% |
| 44 | South Carolina | 630 | 518 | -17.8% |
| 45 | Nevada | 101 | 82 | -18.8% |
| 46 | Massachusetts | 24 | 15 | -37.5% |
| 47 | Hawaii | 21 | 7 | -66.7% |
| 48 | Maryland | 109 | 32 | -70.6% |
Protecting yourself against accidents: Top expert tips
Bhatt says it’s important to remember road safety basics.
“Excessive speeds, impairment and distracted driving are among the leading causes of fatal car accidents,” he says. “Avoiding these behaviors reduces your likelihood of causing an accident. These steps also improve your ability to avoid potential accidents with other drivers who aren’t as responsible as you.”
You can also utilize your auto insurance to help prepare for accidents. We offer the following advice:
- Know what your policy covers. Not all auto insurance policies are created equally, so make sure you understand the different types of coverage — like liability, collision, comprehensive and uninsured motorist — and how they apply in various situations.
- Don’t skimp on coverage. It’s tempting to go with the cheapest policy to save money, but that can backfire fast. If you cause an accident and your coverage limits are too low, you could pay thousands out of pocket. Make sure your policy limits match your risk.
- Document everything. If you’re in an accident, details matter. Take photos, get witness names and write down everything while it’s fresh. That documentation can be helpful when you’re filing a claim, and it helps your insurer advocate on your behalf.
Methodology
LendingTree researchers analyzed National Highway Traffic Safety Administration (NHTSA) Fatality Analysis Reporting System (FARS) data using the Fatality and Injury Reporting System Tool (FIRST).
Researchers examined fatal crashes from 2019 to 2023 (the most recent year available), comparing trends at the national and state levels across urban and rural areas. Researchers calculated the percentage of fatal crashes in these regions, as well as the changes in fatal crashes by area type over the five years.
Additionally, researchers analyzed various contributing factors — speeding, alcohol, large trucks, motorcycles and distracted driving — in fatal crashes in both area types.
Road mileage data was sourced from the U.S. Department of Transportation (DOT) Federal Highway Administration (FHWA). The number of fatal crashes in urban and rural areas was divided by the total road miles in these areas to calculate the rate of fatal crashes per 10,000 miles.