Hiring Hope Persists, Even as Optimism Cools Across Most States


A higher percentage of businesses across the U.S. expect to add employees than to reduce them six months from now, according to a LendingTree analysis of government data.
However, a state-by-state breakdown reveals a significant divide along political lines regarding future hiring optimism.
Here’s more of what we found in our analysis of U.S. Census Bureau Business Trends and Outlook Survey data.
- A slightly higher percentage of businesses expect to add employees than to reduce them in six months. While 75.1% of businesses reported in September that they expect their number of paid employees to remain stable, 14.6% expect an increase and 10.3% expect a decrease. The percentage expecting an increase rose slightly from the same period in 2024 but is down from earlier this year.
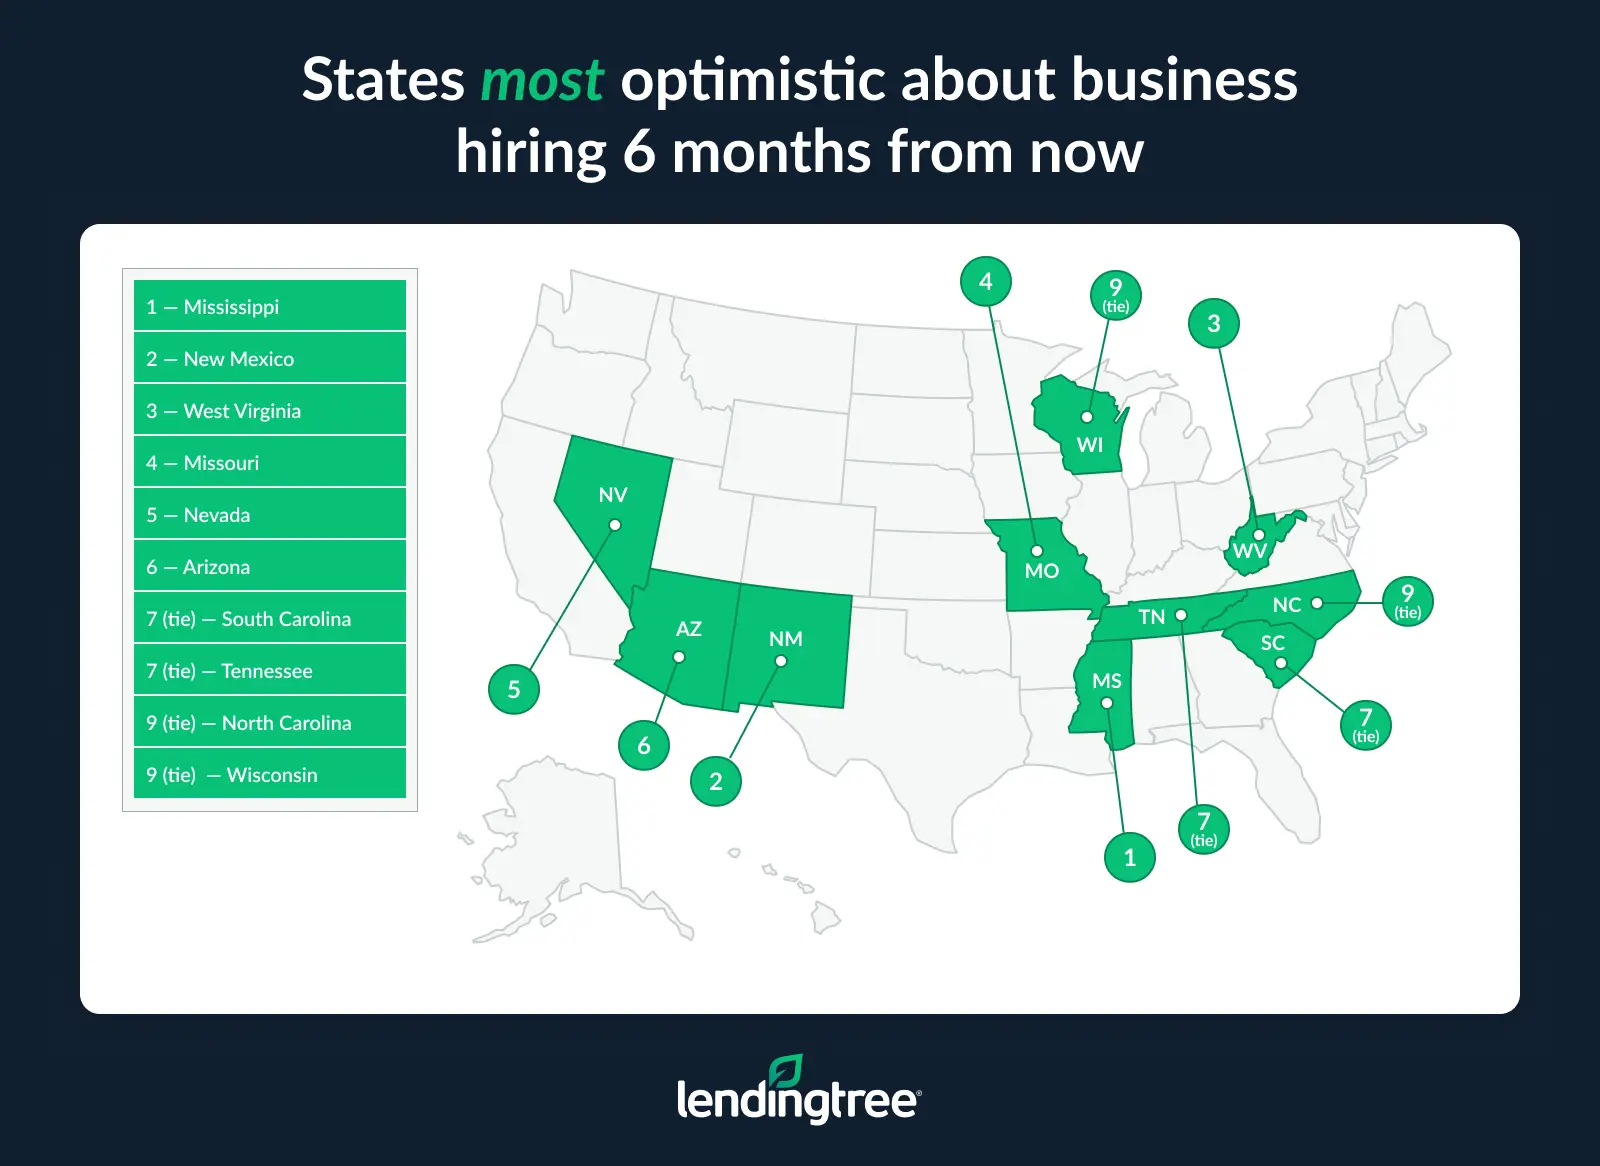
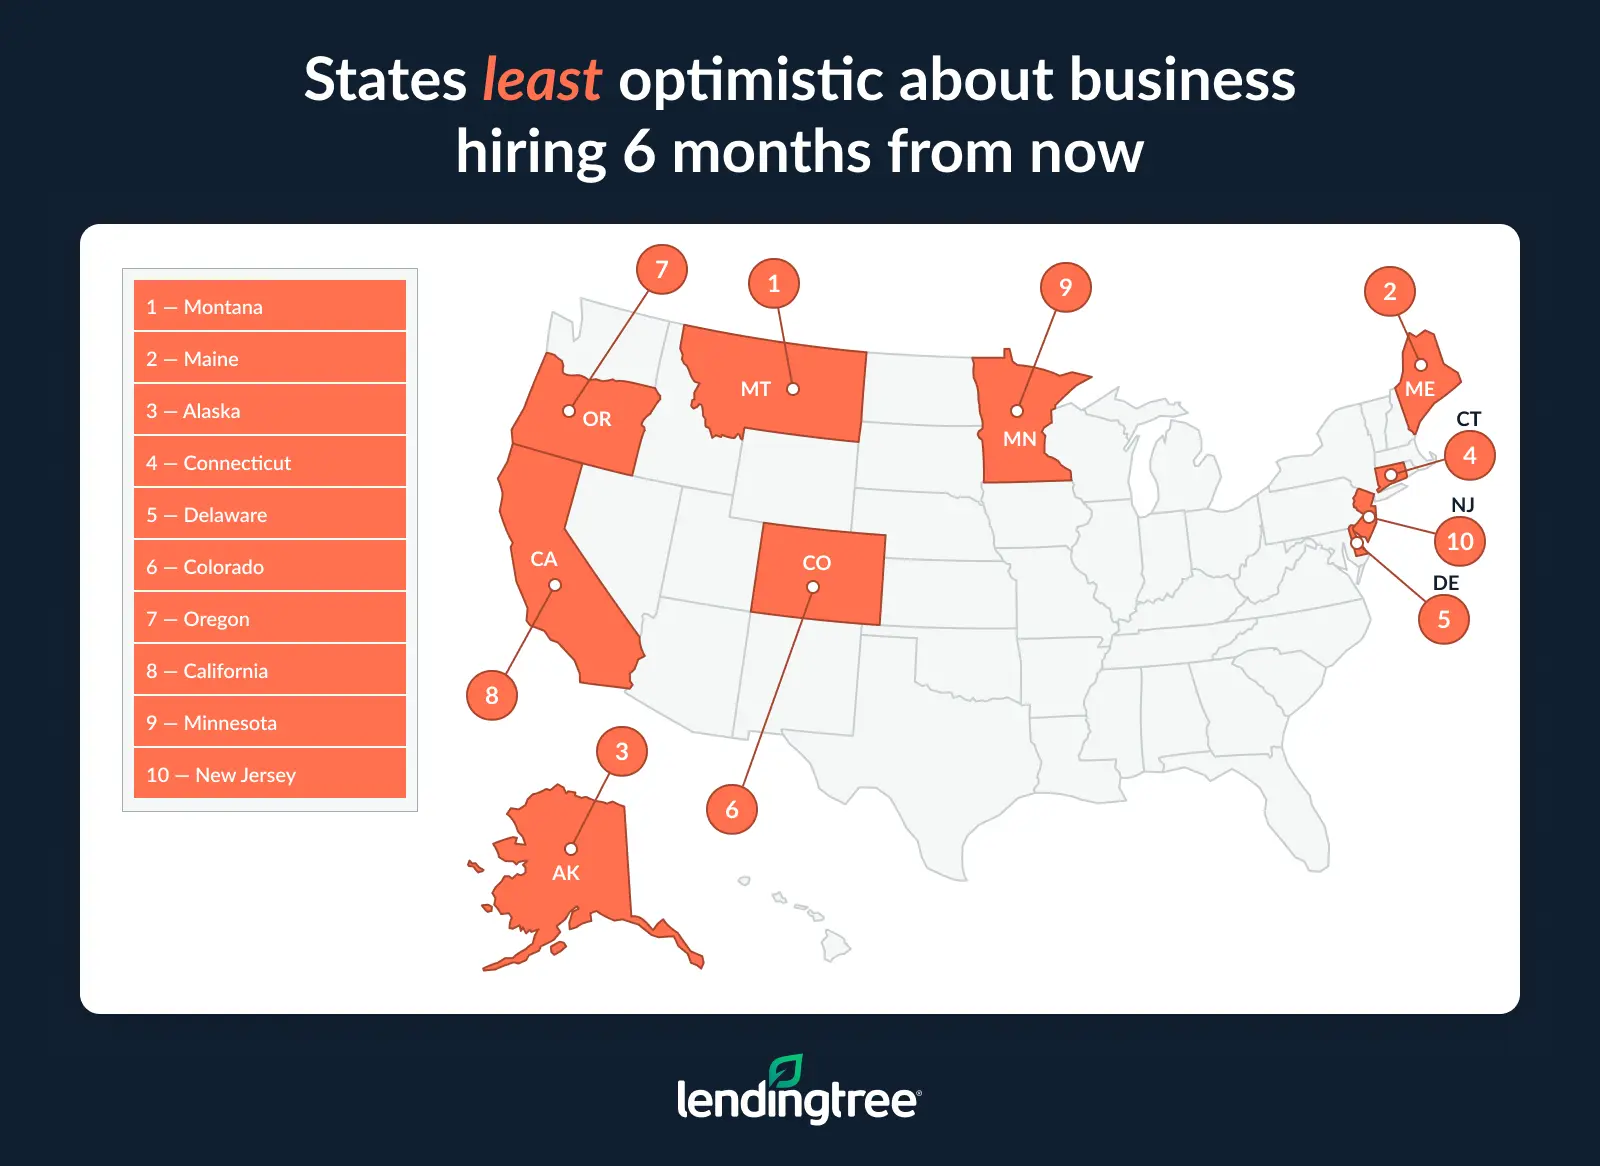
- Mississippi businesses are the most optimistic, while those in Montana are the least optimistic. In Mississippi, 16.2% of businesses expect to add people six months from now, while just 6.8% expect a decrease — a 9.4-point positive difference. New Mexico (8.8 points) and West Virginia (8.3 points) are closest. Meanwhile, in Montana, 17.7% of businesses expect to reduce their number of employees, while just 8.3% expect to add more. That 9.4-point negative difference is the nation’s largest by a wide margin.
- 29 states are less optimistic than they were in 2024, while 16 are more optimistic. Mississippi, South Dakota and Missouri saw the biggest increases in optimism year over year. Montana and Delaware saw the largest decreases, with both experiencing double-digit drops in optimism. (Some states were excluded from our state analysis due to incomplete data, while others didn’t have full 2024 data available.)
- A red-state/blue-state divide is clear in business optimism. Data shows that 11 of the 12 states most optimistic about employee growth backed President Donald Trump in the 2024 presidential election. Meanwhile, 10 of the 12 least optimistic states supported Vice President Kamala Harris. (The least optimistic state, Montana, did support Trump.)
- Major optimism gaps exist among business sectors. The health care and social assistance sector is the most optimistic, with 16.9% expecting to increase staff and 6.5% expecting a reduction — a 10.4-point positive difference. Meanwhile, the accommodation and food services sector is the least optimistic, with 18.1% expecting a decrease and 10.8% expecting an increase — a 7.3-point negative difference.
Slightly higher rate of businesses expect to add than to reduce
Data from September — the most recent at the time of our analysis — revealed that 3 in 4 businesses in the U.S. expect their number of paid employees to remain unchanged six months from now. Meanwhile, 14.6% expect to increase their paid employee count during that time, and 10.3% expect to decrease it.
The percentage expecting an increase rose from September 2024’s 13.2% but fell compared to March 2025, when 15.5% of businesses expected increases.
6 months from now, how do you think your business’s number of paid employees will have changed?
| Biweekly survey start date | Increased | Decreased | No change |
|---|---|---|---|
| Sept. 8, 2025 | 14.6% | 10.3% | 75.1% |
| March 10, 2025 | 15.5% | 8.6% | 75.9% |
| Sept. 9, 2024 | 13.2% | 10.0% | 76.8% |
| March 11, 2024 | 14.3% | 9.2% | 76.5% |
| Sept. 11, 2023 | 12.5% | 10.5% | 77.0% |
Mississippi businesses most optimistic
Examining the data more closely, significant differences emerge among the states regarding hiring optimism in six months. In 37 states, we found a higher percentage of businesses expecting to hire than expecting to reduce employee counts. We’ll refer to these in this report as net-optimistic states. Meanwhile, 10 states saw the opposite, with a higher rate of businesses expecting to have fewer employees. We’ll call those net-pessimistic states. (Note: The District of Columbia, North Dakota, Rhode Island and Wyoming were excluded due to incomplete data.)
Optimism was highest in Mississippi, where 16.2% of businesses expect to add people six months from now and just 6.8% expect a decrease. That’s a 9.4-point difference, the largest net-optimistic score. New Mexico (8.8-point difference) and West Virginia (8.3 points) weren’t far behind. Those three were among a dozen states in which the percentage of businesses expecting to add employees was at least five points higher than the percentage expecting to reduce their employee count.
Montana businesses least optimistic
Conversely, 17.7% of businesses in Montana expect to reduce their number of employees in six months, and just 8.3% expect to add more. That’s a 9.4-point difference, which was the nation’s largest net-pessimistic number by a wide margin. Maine (6.5 points) and Alaska (5.8 points) had the next highest numbers.
Most states less optimistic than they were in 2024
Almost twice as many states were less optimistic about business hiring in September 2025 than they were in September 2024. Twenty-nine states’ net scores were less optimistic, while just 16 were more optimistic.
Again, Mississippi led the way, with its net-optimistic score rising from 3.4 points to 9.4 points – a 6.0-point net increase. South Dakota (5.7), Missouri (5.2) and North Carolina (4.6) weren’t far behind.
Montana and Delaware saw double-digit decreases in optimism, with the state’s net scores dropping 14.0 points and 12.1 points, respectively.
Here’s how that happened.
- Montana: In 2024, 17.5% of Montana businesses expected to add employees in six months, while 12.9% expected to reduce them. In 2025, just 8.3% of Montana businesses expected employee growth, while 17.7% expected to cut head count. A major shift from a 4.6 net-optimistic score in 2024 to a 9.4 net-pessimistic score resulted in the 14.0-point change.
- Delaware: In 2024, 17.2% of Delaware businesses expected to add employees in six months, while 8.9% expected to reduce them. In 2025, just 10.7% of Delaware businesses expected employee growth, while 14.5% expected to cut head count. A major shift from an 8.3 net-optimistic score in 2024 to a 3.8 net-pessimistic score resulted in the 12.1-point change.
Those are massive changes in just a year. Maine (down 6.9 points) and Connecticut (6.5) had the next biggest drops.
Business hiring optimism differences, 2024 to 2025
| 2025 | 2024 | |||||||||
|---|---|---|---|---|---|---|---|---|---|---|
| Rank | State | Increase | Decrease | No change | Net increase/decrease (points) | Increase | Decrease | No change | Net increase/decrease (points) | Difference, 2024-25 (points) |
| 1 | Mississippi | 16.2% | 6.8% | 77.0% | 9.4 | 11.2% | 7.8% | 81.0% | 3.4 | 6.0 |
| 2 | South Dakota | 12.2% | 10.5% | 77.3% | 1.7 | 9.7% | 13.7% | 76.6% | -4.0 | 5.7 |
| 3 | Missouri | 16.1% | 8.8% | 75.1% | 7.3 | 12.0% | 9.9% | 78.1% | 2.1 | 5.2 |
| 4 | North Carolina | 15.0% | 8.9% | 76.1% | 6.1 | 11.7% | 10.2% | 78.0% | 1.5 | 4.6 |
| 5 | West Virginia | 14.4% | 6.1% | 79.5% | 8.3 | 16.1% | 10.8% | 73.1% | 5.3 | 3.0 |
| 6 | Alabama | 12.4% | 6.4% | 81.2% | 6.0 | 12.1% | 8.7% | 79.1% | 3.4 | 2.6 |
| 6 | Arkansas | 13.5% | 9.9% | 76.6% | 3.6 | 11.5% | 10.5% | 78.0% | 1.0 | 2.6 |
| 8 | Nevada | 18.1% | 11.2% | 70.6% | 6.9 | 14.2% | 9.8% | 76.0% | 4.4 | 2.5 |
| 9 | Tennessee | 14.8% | 8.6% | 76.6% | 6.2 | 12.9% | 8.7% | 78.4% | 4.2 | 2.0 |
| 10 | Idaho | 13.4% | 11.9% | 74.6% | 1.5 | 12.7% | 13.0% | 74.3% | -0.3 | 1.8 |
| 11 | Nebraska | 11.2% | 9.6% | 79.2% | 1.6 | 14.8% | 14.4% | 70.9% | 0.4 | 1.2 |
| 12 | New York | 10.1% | 8.9% | 81.0% | 1.2 | 10.3% | 10.1% | 79.6% | 0.2 | 1.0 |
| 13 | Ohio | 13.9% | 8.7% | 77.4% | 5.2 | 13.0% | 8.6% | 78.5% | 4.4 | 0.8 |
| 14 | New Mexico | 16.2% | 7.4% | 76.4% | 8.8 | 15.8% | 7.4% | 76.8% | 8.4 | 0.4 |
| 14 | Oklahoma | 7.7% | 7.0% | 85.3% | 0.7 | 11.2% | 10.9% | 78.0% | 0.3 | 0.4 |
| 16 | Wisconsin | 13.6% | 7.5% | 78.9% | 6.1 | 13.9% | 8.1% | 78.0% | 5.8 | 0.3 |
| 17 | New Hampshire | 12.3% | 10.4% | 77.3% | 1.9 | 12.8% | 10.8% | 76.5% | 2.0 | -0.1 |
| 18 | Texas | 14.3% | 10.2% | 75.5% | 4.1 | 13.9% | 9.4% | 76.7% | 4.5 | -0.4 |
| 19 | Michigan | 12.9% | 11.0% | 76.1% | 1.9 | 13.3% | 10.5% | 76.3% | 2.8 | -0.9 |
| 20 | Florida | 13.0% | 9.7% | 77.3% | 3.3 | 13.3% | 8.9% | 77.8% | 4.4 | -1.1 |
| 21 | Kansas | 10.3% | 6.2% | 83.5% | 4.1 | 15.4% | 9.9% | 74.7% | 5.5 | -1.4 |
| 21 | Pennsylvania | 11.7% | 9.5% | 78.9% | 2.2 | 13.7% | 10.1% | 76.1% | 3.6 | -1.4 |
| 23 | Utah | 13.6% | 10.6% | 75.8% | 3.0 | 12.6% | 8.1% | 79.3% | 4.5 | -1.5 |
| 23 | Louisiana | 10.7% | 9.7% | 79.6% | 1.0 | 8.8% | 6.3% | 84.8% | 2.5 | -1.5 |
| 25 | Arizona | 15.1% | 8.3% | 76.6% | 6.8 | 18.0% | 9.6% | 72.4% | 8.4 | -1.6 |
| 26 | California | 10.9% | 12.6% | 76.5% | -1.7 | 11.8% | 11.7% | 76.5% | 0.1 | -1.8 |
| 26 | Illinois | 11.0% | 10.7% | 78.2% | 0.3 | 12.8% | 10.7% | 76.6% | 2.1 | -1.8 |
| 26 | New Jersey | 12.3% | 12.6% | 75.0% | -0.3 | 12.3% | 10.8% | 76.8% | 1.5 | -1.8 |
| 26 | Alaska | 9.0% | 14.8% | 76.1% | -5.8 | 16.9% | 20.9% | 62.3% | -4.0 | -1.8 |
| 30 | South Carolina | 15.9% | 9.7% | 74.4% | 6.2 | 14.6% | 6.1% | 79.3% | 8.5 | -2.3 |
| 30 | Maryland | 12.8% | 9.5% | 77.7% | 3.3 | 15.4% | 9.8% | 74.8% | 5.6 | -2.3 |
| 32 | Georgia | 11.3% | 8.6% | 80.2% | 2.7 | 13.8% | 8.5% | 77.7% | 5.3 | -2.6 |
| 32 | Iowa | 9.1% | 8.7% | 82.2% | 0.4 | 10.5% | 7.5% | 82.0% | 3.0 | -2.6 |
| 34 | Washington | 13.8% | 13.4% | 72.8% | 0.4 | 14.1% | 11.0% | 74.9% | 3.1 | -2.7 |
| 35 | Massachusetts | 13.0% | 12.1% | 75.0% | 0.9 | 14.7% | 11.0% | 74.3% | 3.7 | -2.8 |
| 36 | Indiana | 13.2% | 8.8% | 78.0% | 4.4 | 17.2% | 9.6% | 73.2% | 7.6 | -3.2 |
| 36 | Virginia | 13.1% | 10.6% | 76.3% | 2.5 | 14.9% | 9.2% | 75.9% | 5.7 | -3.2 |
| 38 | Minnesota | 10.2% | 11.6% | 78.3% | -1.4 | 12.9% | 10.5% | 76.5% | 2.4 | -3.8 |
| 39 | Kentucky | 11.9% | 7.8% | 80.4% | 4.1 | 16.0% | 7.1% | 76.9% | 8.9 | -4.8 |
| 40 | Colorado | 10.3% | 12.7% | 76.9% | -2.4 | 13.3% | 10.4% | 76.3% | 2.9 | -5.3 |
| 41 | Oregon | 11.1% | 13.4% | 75.6% | -2.3 | 12.5% | 9.1% | 78.4% | 3.4 | -5.7 |
| 42 | Connecticut | 9.4% | 13.7% | 76.9% | -4.3 | 13.0% | 10.8% | 76.2% | 2.2 | -6.5 |
| 43 | Maine | 13.0% | 19.5% | 67.5% | -6.5 | 10.5% | 10.1% | 79.4% | 0.4 | -6.9 |
| 44 | Delaware | 10.7% | 14.5% | 74.8% | -3.8 | 17.2% | 8.9% | 73.9% | 8.3 | -12.1 |
| 45 | Montana | 8.3% | 17.7% | 74.1% | -9.4 | 17.5% | 12.9% | 69.6% | 4.6 | -14.0 |
Red-state/blue-state divide clear in business optimism
It isn’t exactly breaking news to suggest that America is an extremely polarized country today when it comes to politics. The red-blue split is visible in countless ways, and our report reveals that business optimism is among them.
Our analysis revealed that 11 of the 12 states with the most optimistic outlooks for employee growth supported President Donald Trump in the 2024 presidential election. Meanwhile, 10 of the 12 least optimistic states supported Vice President Kamala Harris.
Among the most notable exceptions:
- Montana and Alaska were the least and third-least optimistic states, and Trump won both states.
- New Mexico was the second-most optimistic state, and Harris carried it.
A red/blue split even appears when looking solely at the nation’s most populous states. For example, Texas, Florida and Pennsylvania — all of which supported Trump in 2024 — are more optimistic about business hiring than New York, Illinois and California, which backed Harris.
Major optimism gaps exist among business sectors
Optimism about hiring also varies widely depending on the type of business in question.
For example, the health care and social assistance sector is the most optimistic. This sector includes hospitals, doctors’ offices, outpatient care centers, nursing and residential care facilities, child care facilities and more. Among those businesses, 16.9% expect to increase staff and 6.5% expect to reduce — a 10.4-point positive difference. That’s the highest net-optimistic score of any sector, with only the finance and insurance sector coming close at 9.1 points.
The accommodation and food services sector, which includes hotels and motels as well as fast-food and full-service restaurants, is the least optimistic. Data shows that 18.1% of these businesses expect a decrease, while 10.8% expect an increase. That 7.3-point difference was the highest net-pessimistic score in the report, edging out the agriculture, forestry, fishing and hunting sector (6.6 points).
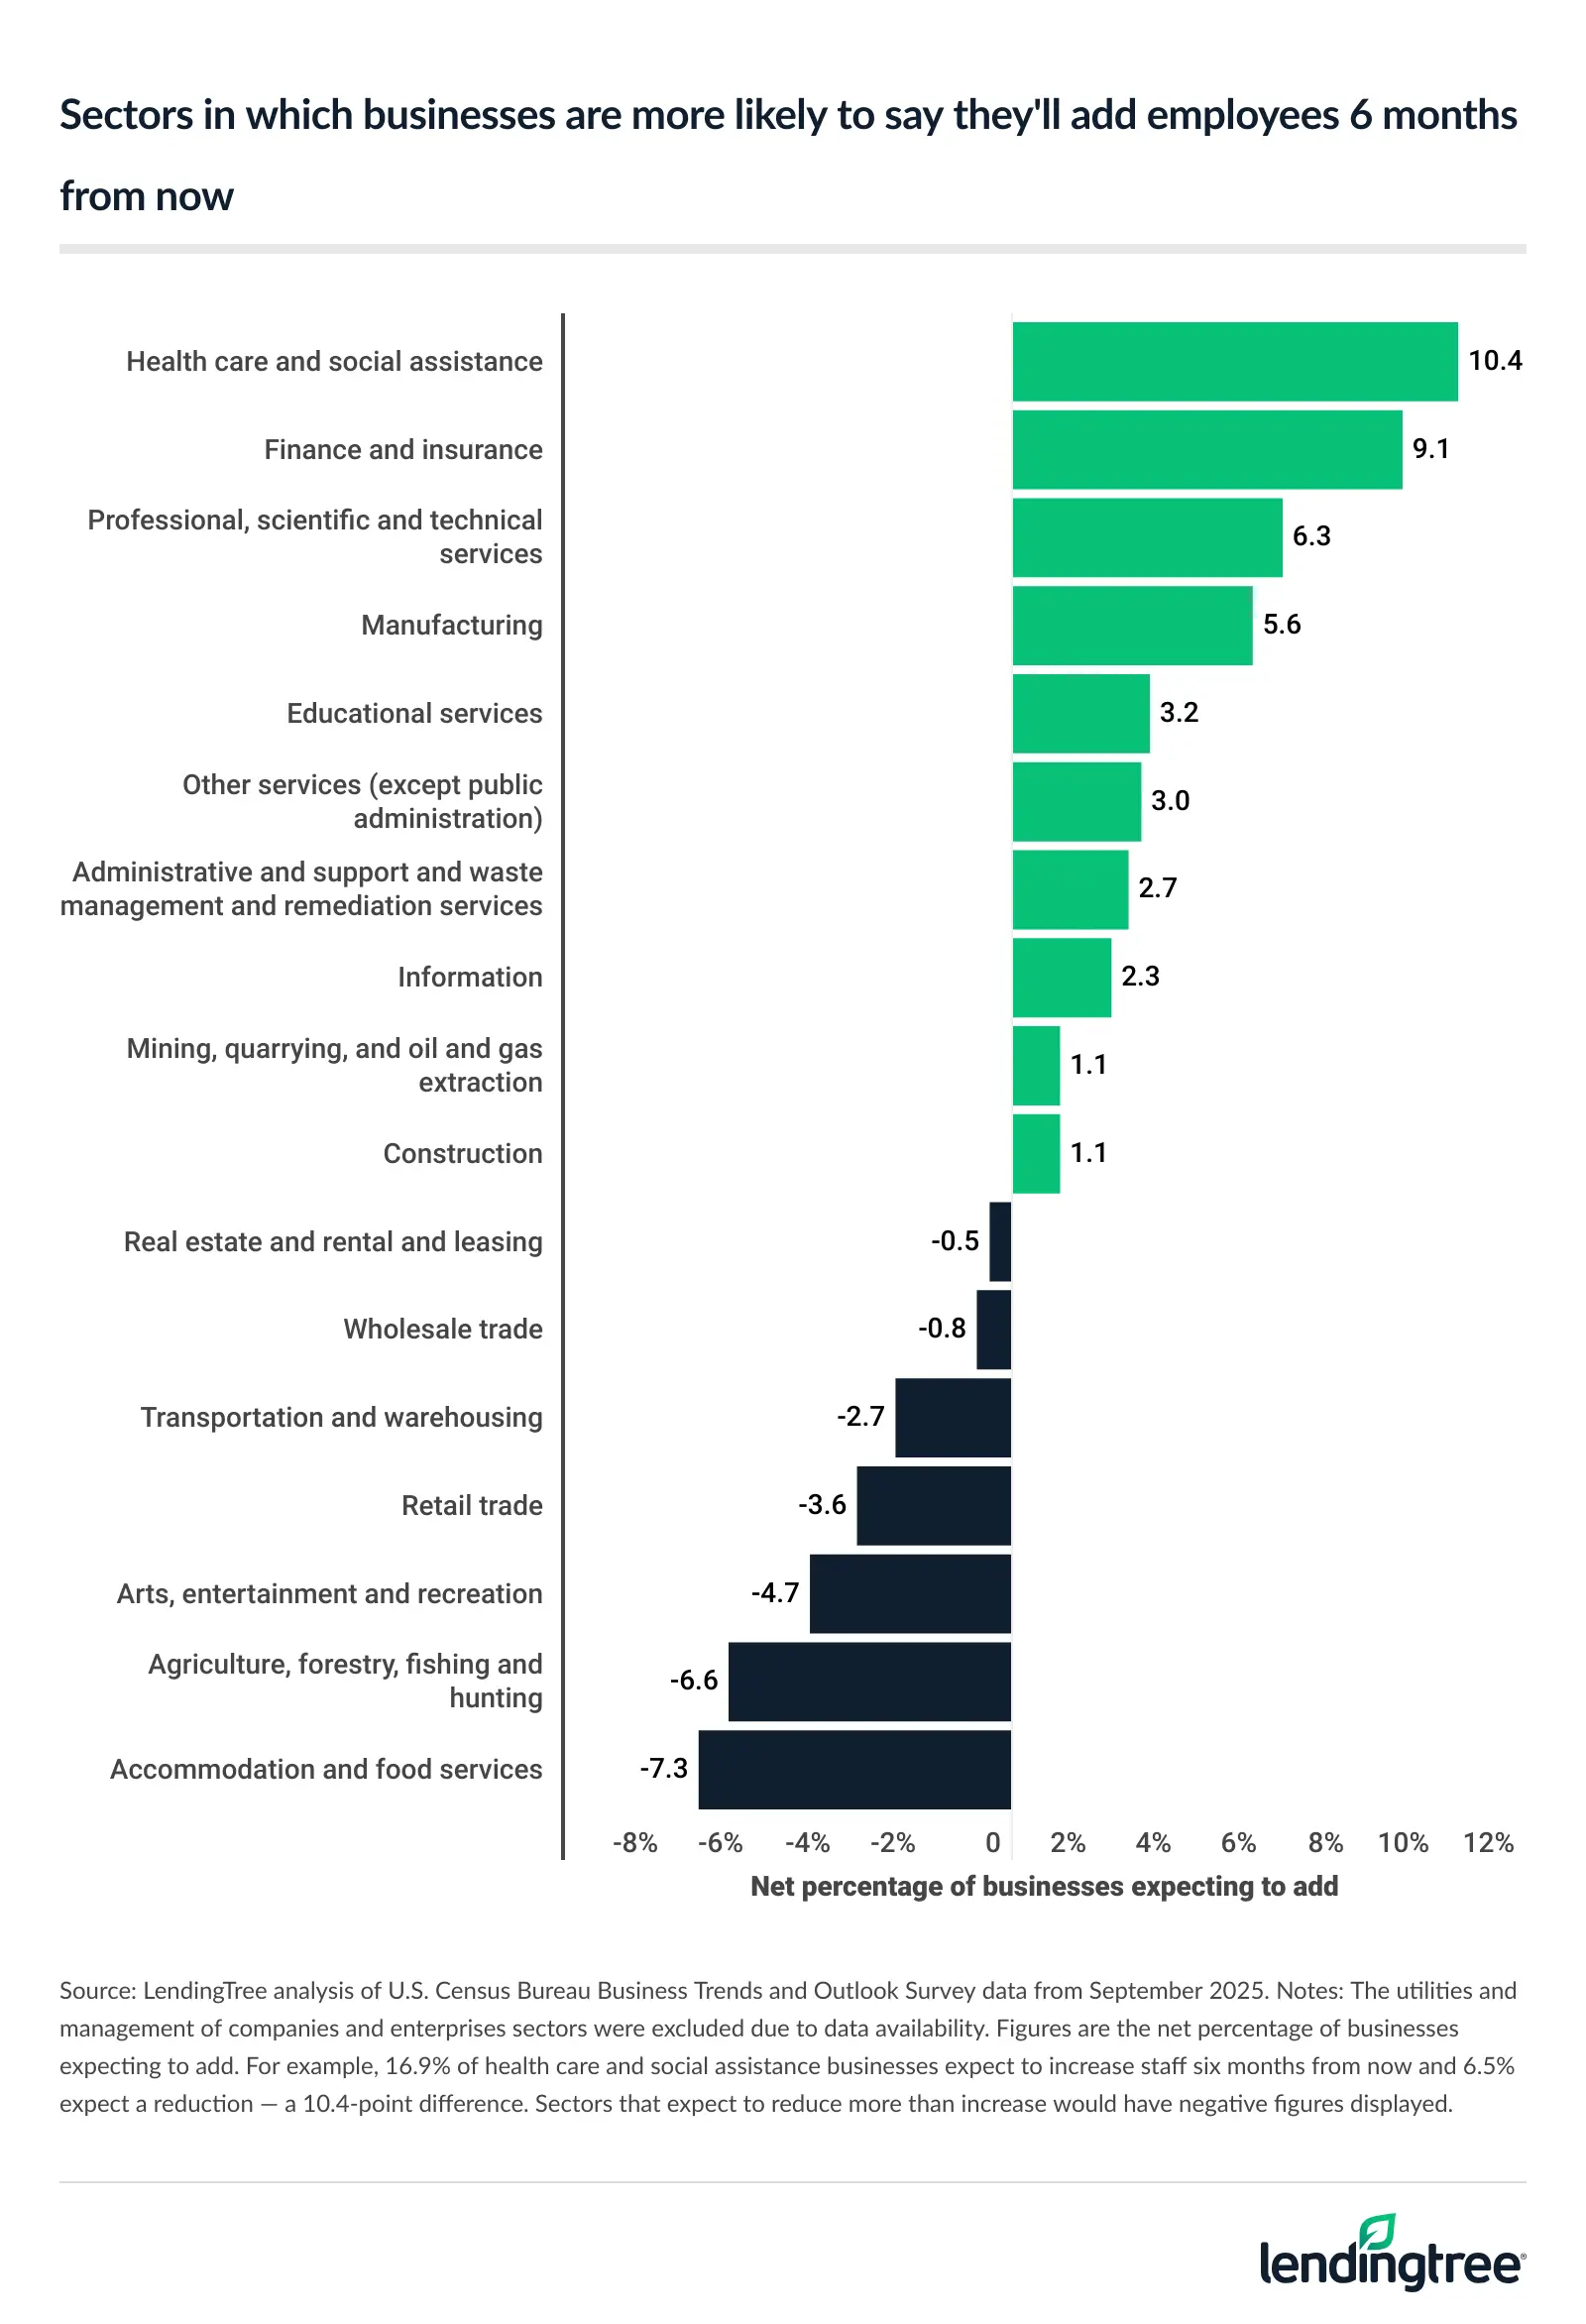
Still, among the sectors featured in the data, more were optimistic about hiring in the next six months than were pessimistic.
Lean on your network in this tough job market
The fact that more businesses expect to add employees than reduce them six months from now is a positive sign for job seekers, but it’s likely to be cold comfort for those who’ve been struggling to find work for some time.
While job hunting looks very different from what it did a decade ago, some of the basic principles of finding a job have not changed.
- Leverage your network. The old saying “It’s not what you know, it’s who you know” has perhaps never been truer. If you’re looking for work or anticipate needing it soon, focus on connecting with former colleagues and others to gather their input and advice. They might even know of job openings that haven’t been posted yet. It can also be a great opportunity to reconnect with those you’ve fallen out of touch with and to expand your network by meeting new people.
- Keep learning. Those who fail to adapt and hone their skills are destined to be left behind in today’s rapidly changing workplace. It may be worth considering taking some online courses and earning certifications or other professional designations, especially in areas such as AI or data analytics, depending on your profession.
- Keep a running list of your successes. When it comes time to find that new job or ask for that promotion, we too often have to scramble to remember what we’ve accomplished. You can avoid that by regularly taking time to list significant things you’ve done, big or small, with as much specificity as you can. That way, when it’s time to build your resume or fill out that application, you’ll be able to cherry-pick the very best of a bunch of accomplishments instead of frantically trying to piece something together.
Methodology
LendingTree researchers analyzed U.S. Census Bureau Business Trends and Outlook Survey data. The analysis compared the percentage of businesses predicting an increase in employees with those expecting a decrease in six months, ranking them by the net difference between the two.
Data is sourced from Census Bureau surveys started between Sept. 11, 2023, and Sept. 8, 2025.
Due to incomplete data, the District of Columbia, North Dakota, Rhode Island and Wyoming were excluded from our state analysis, while Hawaii and Vermont were excluded from our year-over-year comparison.
Compare business loan offers