The Price of Lazy: Nearly 4 in 10 Americans Get Delivery Weekly — and It’s Costing Them Nearly 80% More Than Pickup


Nearly 4 in 10 Americans get food delivered at least once a week. And when they do, they’re likely to spend almost 80% more than if they picked it up from the restaurant themselves.
LendingTree reviewed DoorDash, Grubhub and Uber Eats delivery costs for typical orders from five popular chains — Buffalo Wild Wings, Chick-fil-A, Chipotle, Starbucks and Taco Bell — in the nation’s 10 biggest metros.
We compared the cost of getting meals from these chains delivered to the cost of picking them up at the restaurant. We also compared delivery costs to those of buying a frozen version of the meal or preparing a homemade version. (See the full methodology.)
The difference in costs was staggering. Here’s what we found.
Key findings
- If you want fast-food or fast-casual delivery, be ready to pay nearly 80% more. Looking at food from five major chains in the nation’s 10 largest metros delivered by the most commonly used services, we found that, on average, ordering delivery costs 79.5% (or $9.30) more than picking up the same meal. When compared to other options, the price gap widens: Delivery is 279.9% (or $15.48) more expensive than buying a similar frozen meal at the grocery store and 601.7% (or $17.98) more expensive than cooking a comparable meal at home.
- Atlanta has the heftiest delivery markup, while Houston has the smallest. Among the 10 metros analyzed, Atlanta has the highest average markup between delivery and pickup at 92.2%. New York (89.1%) and Philadelphia (82.8%) are next. Houston has the smallest at 67.0%, with Miami (69.3%) and Chicago (71.8%) not far behind.
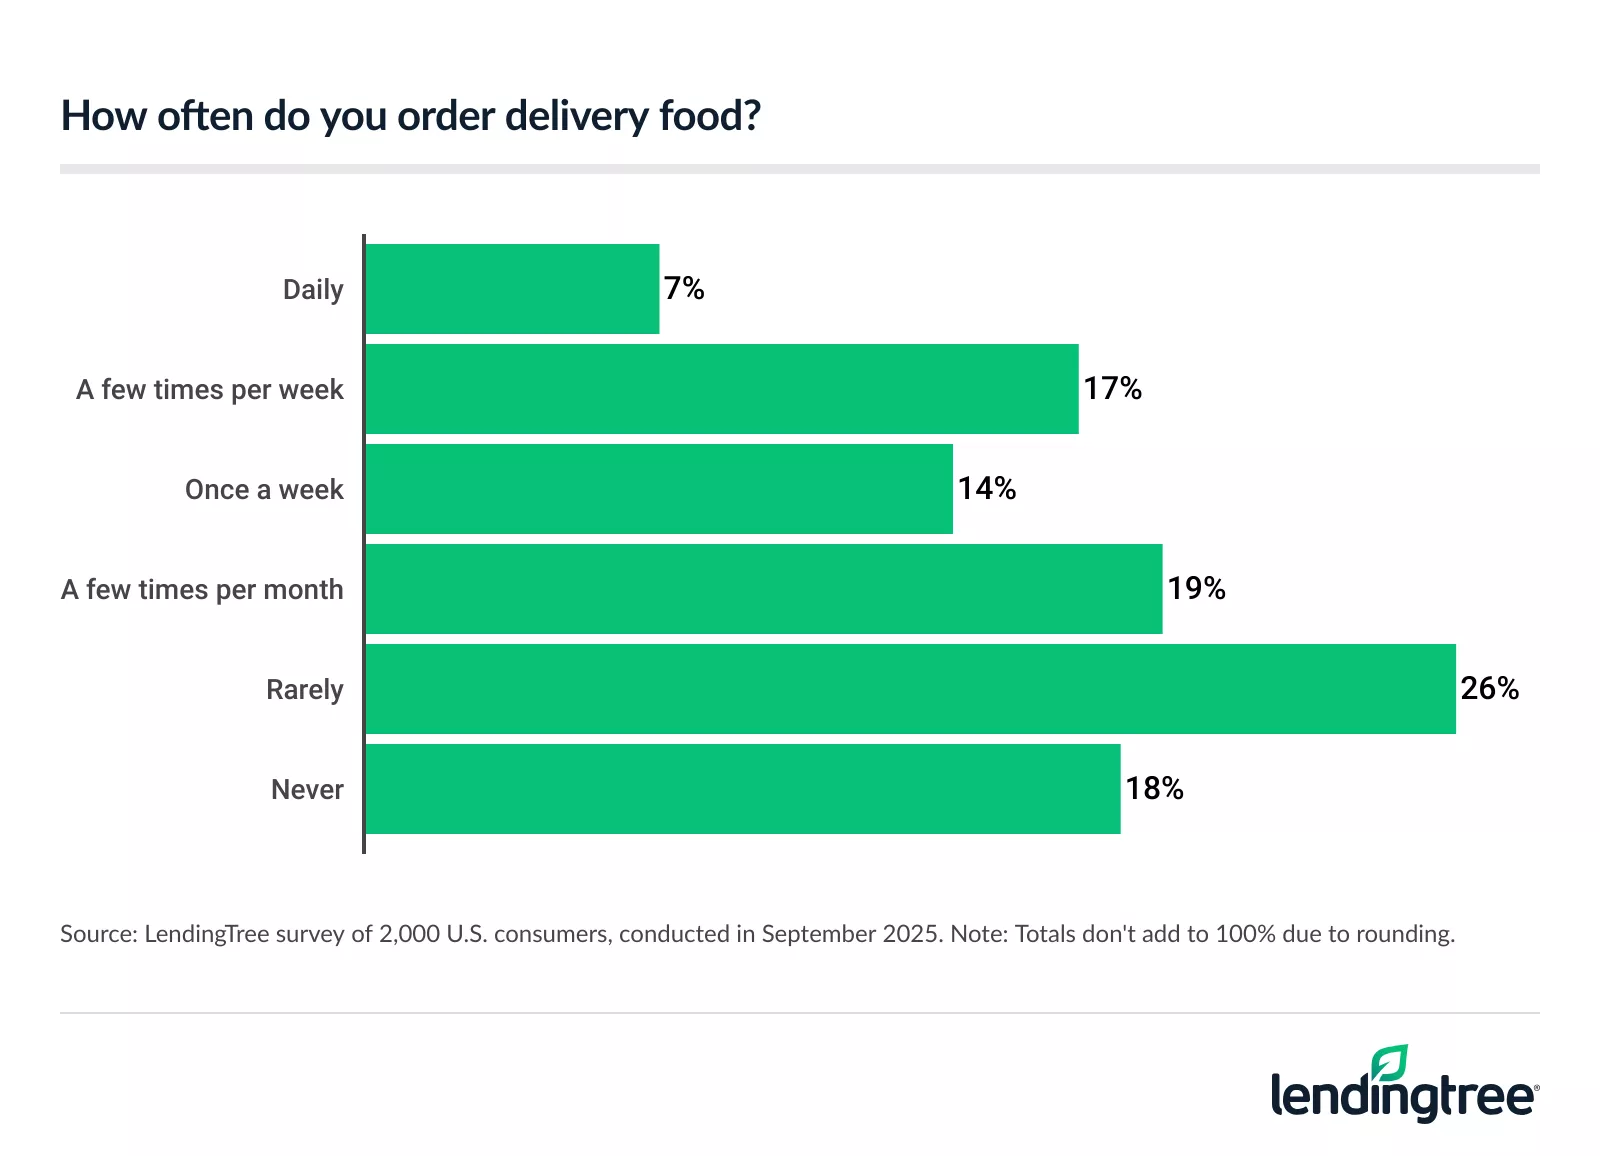
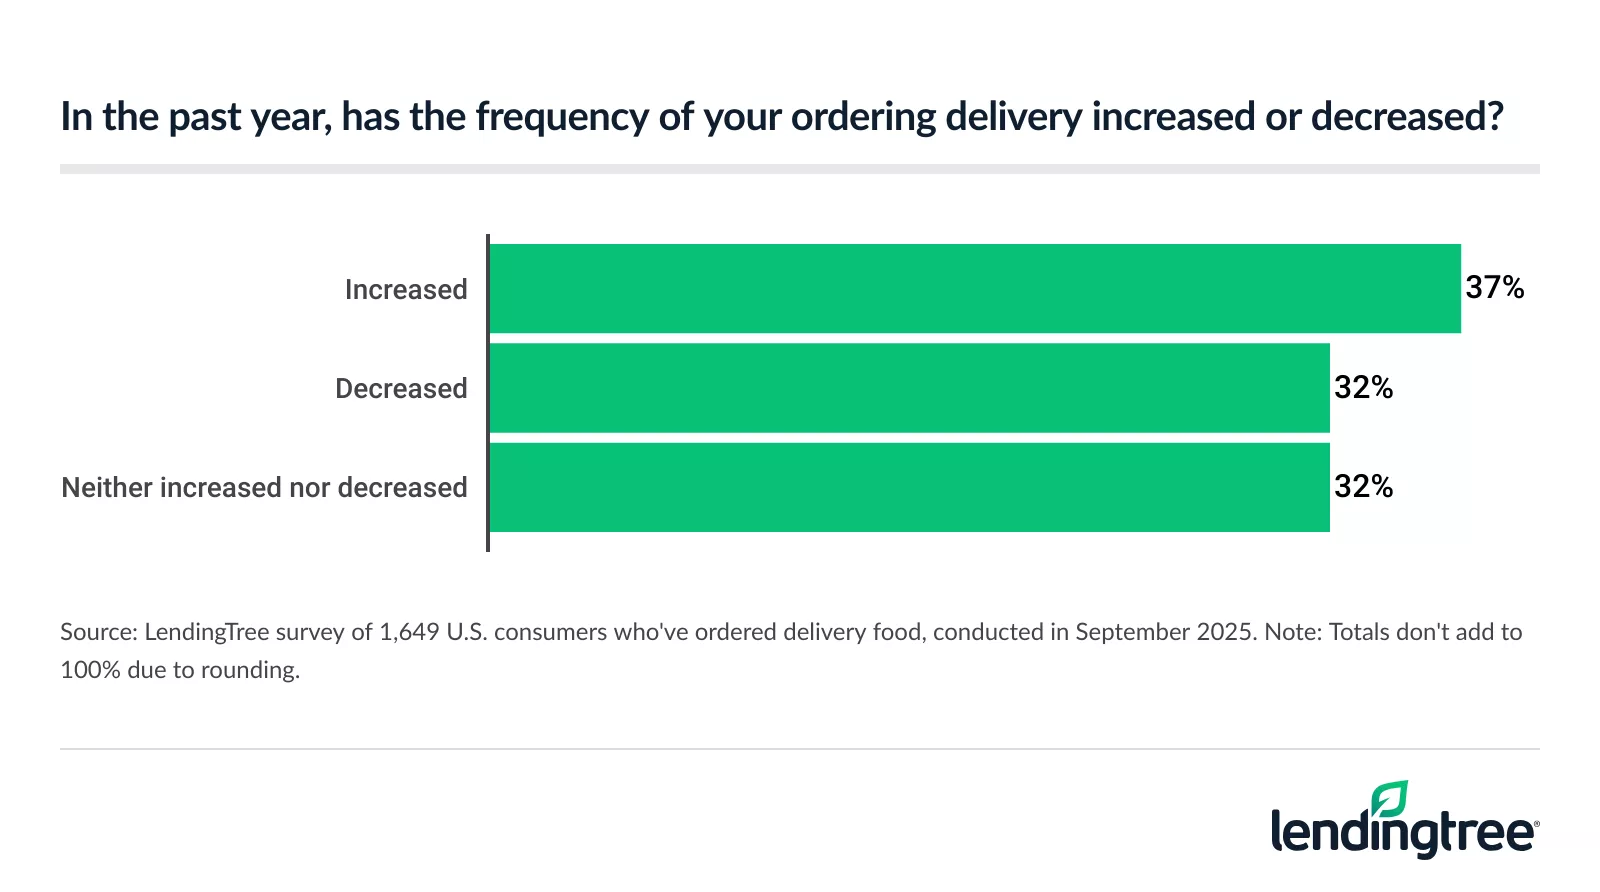
- Nearly 4 in 10 Americans get delivery at least once a week. 38% of Americans order delivery each week, including 24% who do it at least a few times a week. Six in 10 parents of young kids order at least once a week, including 43% who do it multiple times a week. Meanwhile, 37% of people who’ve ordered have been doing it more in the past year.
- Massive gender and generation gaps exist when it comes to delivery habits. Nearly half of men (49%) order delivery at least once a week, including 34% who do it multiple times a week. In contrast, just 28% of women order delivery each week, including 15% who do so more than once. Meanwhile, more than half of millennials (56%) and half of Gen Zers (50%) get delivery at least once a week. Just 32% of Gen Xers and 12% of baby boomers do the same.
Delivery orders were calculated using free subscriptions with the analyzed food-delivery services. Paid subscribers may face different costs.
Be ready to pay nearly 80% more
Our review revolved around these five orders from some of the nation’s biggest fast-food and fast-casual chains in the nation’s 10 largest metros:
- Buffalo Wild Wings: 10 wings with medium sauce
- Chick-fil-A: Chicken sandwich meal with medium fries, medium Coke
- Chipotle: Burrito bowl (chicken, white rice, black beans)
- Starbucks: Grande cold brew
- Taco Bell: Cantina chicken burrito meal, medium Pepsi
First, we looked at the cost of each of these orders if we had picked them up at the restaurant. The 10-metro average was $11.71, ranging from $5.27 at Starbucks to $18.28 at Buffalo Wild Wings.
Then, we looked at the cost of having each of those meals delivered using the three largest services — DoorDash, Grubhub and Uber Eats. Our analysis revealed that people with a free subscription to these services should expect to pay an average of 79.5% more across the 10 metros when having these meals delivered rather than picking them up at the restaurant.
While we found differences in delivery costs among the three services reviewed, they were less than $1.
Pickup vs. delivery costs among major food-delivery services
| Pickup | Delivery | % diff from $11.71 | $ diff from $11.71 | |
|---|---|---|---|---|
| DoorDash | – | $21.46 | 83.3% | $9.75 |
| Grubhub | – | $20.57 | 75.7% | $8.86 |
| Uber Eats | – | $20.98 | 79.2% | $9.27 |
| 10-metro average | $11.71 | $21.00 | 79.5% | $9.30 |
Of course, costs will vary based on the items you buy — and where you live, which we’ll get to shortly — but the message is clear: If you want to get your next meal delivered instead of picking it up, prepare for a substantial additional cost.
When compared to other alternatives, the disparity grows dramatically. Compared to buying a similar frozen meal from the grocery store, delivery is more than three times the cost — 279.9%, or $15.48. When cooking a comparable meal at home, delivery costs a stunning 601.7% (or $17.98) more. (See the methodology for more details on how we did these analyses.)
Delivery costs vs. other methods of getting a meal
| Avg. meal cost when picking up at the restaurant | $11.71 |
| Avg. meal cost when using a delivery service | $21.00 |
| Cost difference, by percentage | 79.5% |
| Cost difference, by dollar amount | $9.30 |
| Avg. meal cost when prepared at home | $3.03 |
| Cost difference from delivery, by percentage | 601.7% |
| Cost difference from delivery, by dollar amount | $17.98 |
| Avg. meal cost for frozen alternative | $5.53 |
| Cost difference from delivery, by percentage | 279.9% |
| Cost difference from delivery, by dollar amount | $15.48 |
Atlanta has heftiest delivery markup; Houston has smallest
None of the nation’s 10 biggest metros is immune to high food-delivery costs, but our analysis revealed significant differences in the markup between delivery and pickup.
Atlanta eaters can expect to pay 92.2% more when getting delivery — the highest in the nation and significantly higher than the 10-metro average of 79.5%. New York (89.1%) and Philadelphia (82.8%) have the next highest increases.
Meanwhile, Houston has the smallest difference in cost between delivery and pickup at 67.0%. Miami (69.3%) and Chicago (71.8%) aren’t far behind.
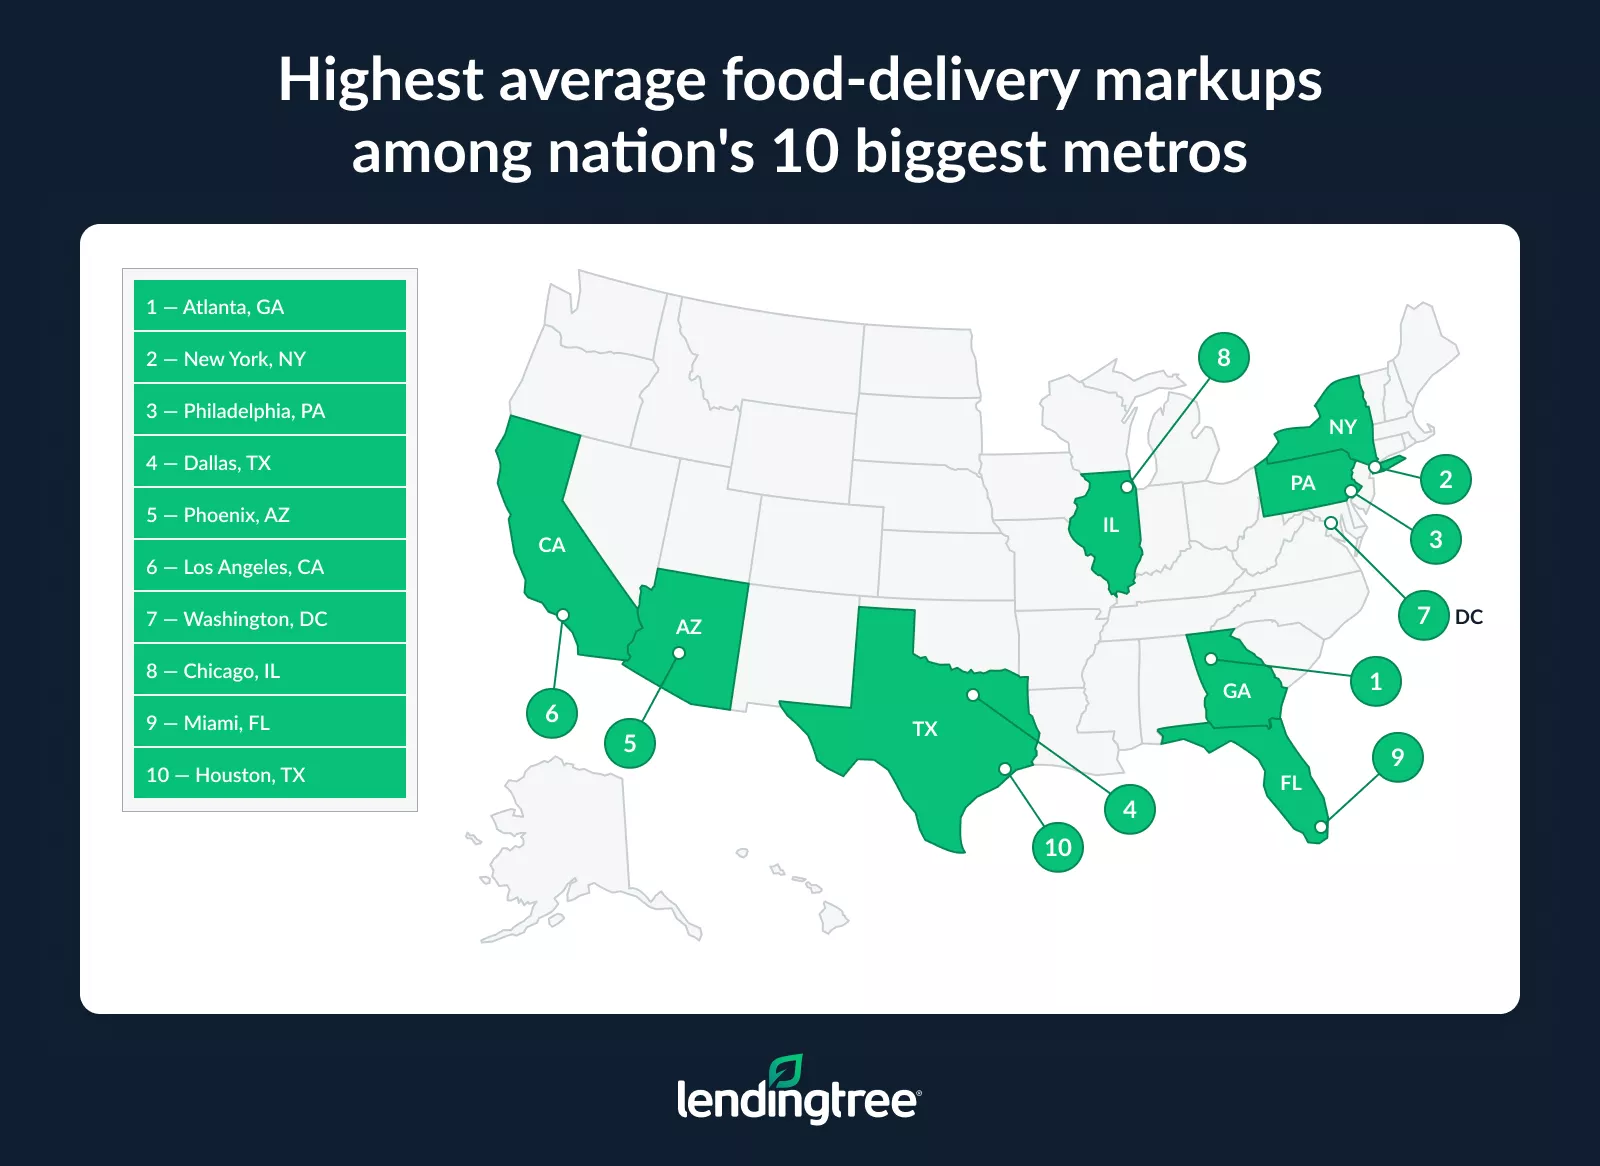
Pickup vs. delivery costs in nation’s 10 biggest metros
| Rank | Metro | Pickup | Delivery | % diff | $ diff |
|---|---|---|---|---|---|
| 1 | Atlanta, GA | $10.45 | $20.08 | 92.2% | $9.64 |
| 2 | New York, NY | $12.84 | $24.28 | 89.1% | $11.44 |
| 3 | Philadelphia, PA | $11.13 | $20.35 | 82.8% | $9.22 |
| 4 | Dallas, TX | $11.43 | $20.85 | 82.4% | $9.42 |
| 5 | Phoenix, AZ | $11.35 | $20.68 | 82.3% | $9.33 |
| 6 | Los Angeles, CA | $12.90 | $23.11 | 79.2% | $10.22 |
| 7 | Washington, DC | $11.85 | $21.15 | 78.5% | $9.30 |
| 8 | Chicago, IL | $11.88 | $20.40 | 71.8% | $8.53 |
| 9 | Miami, FL | $11.83 | $20.03 | 69.3% | $8.20 |
| 10 | Houston, TX | $11.44 | $19.11 | 67.0% | $7.67 |
When comparing delivery to making the meal at home, the biggest disparity is in Phoenix, where delivery costs 730.2% more. The smallest gap is in Chicago at 514.3%.
Comparing delivery to frozen meals, New York has the biggest gap at 315.6%, while Miami’s is the smallest at 245.0%.
Cost of delivery vs. home food vs. frozen food, by metro
| Metro | Delivery | Home avg. | % diff, delivery and home | $ diff, delivery and home | Frozen avg. | % diff, delivery and frozen | $ diff, delivery and frozen |
|---|---|---|---|---|---|---|---|
| Phoenix, AZ | $20.68 | $2.49 | 730.2% | $18.19 | $5.48 | 277.5% | $15.20 |
| Philadelphia, PA | $20.35 | $2.56 | 695.7% | $17.79 | $5.37 | 278.6% | $14.98 |
| Atlanta, GA | $20.08 | $2.65 | 657.2% | $17.43 | $5.24 | 283.3% | $14.85 |
| Washington, DC | $21.15 | $2.91 | 625.7% | $18.24 | $5.64 | 275.1% | $15.51 |
| New York, NY | $24.28 | $3.58 | 578.2% | $20.70 | $5.84 | 315.6% | $18.43 |
| Miami, FL | $20.03 | $3.01 | 565.0% | $17.02 | $5.81 | 245.0% | $14.22 |
| Dallas, TX | $20.85 | $3.15 | 562.0% | $17.70 | $5.36 | 288.7% | $15.49 |
| Houston, TX | $19.11 | $2.90 | 559.8% | $16.21 | $5.20 | 267.2% | $13.90 |
| Los Angeles, CA | $23.11 | $3.68 | 528.9% | $19.44 | $6.00 | 285.4% | $17.12 |
| Chicago, IL | $20.40 | $3.32 | 514.3% | $17.08 | $5.33 | 283.0% | $15.08 |
| Average | $21.00 | $3.03 | 601.7% | $17.98 | $5.53 | 279.9% | $15.48 |
Nearly 4 in 10 Americans get delivery at least once a week
A survey done in tandem with our delivery-cost analysis makes it clear that high delivery prices aren’t keeping people from ordering in.
About 4 in 10 Americans (38%) order delivery each week, including 24% who do it at least a few times a week. Parents of kids younger than 18 are among the most likely to order food delivery, which should be understandable to anyone who has had young kids. Six of 10 parents of young kids order at least once a week, including 43% who do so multiple times a week.
More than a third (37%) of people who’ve ordered previously say they did it more often in the past year. Again, parents of young kids (56%) are among the most likely to say so, as are millennials ages 29 to 44 (49%) and men (47%).
Also, the more you earn, the more likely you are to say you’ve ordered food delivery more often in the past year.
Meanwhile, 39% of women, 37% of Gen Zers ages 18 to 28 and 36% of baby boomers ages 61 to 79 who’ve gotten delivery in the past say they ordered less often in the past year.
Massive gender, generation gaps exist when it comes to delivery habits
A closer examination of our survey data reveals significant differences among various demographics.
For example, men are far more likely than women to order delivery. Almost half of men (49%) order delivery at least once a week, including 34% who do it multiple times a week.
We also found a large variance by age group. Millennials are the most likely to order food delivery at least once a week (56%), followed closely by Gen Zers (50%). Those are far bigger percentages than those seen with Gen Xers ages 45 to 60 (32%) and baby boomers (12%).
Perhaps not surprisingly, we also found significant differences among income brackets. While only 12% of Americans who earn less than $30,000 report ordering delivery a few days a week, the figure jumps to 44% among those earning at least $100,000 annually.
Tips for enjoying delivery without wrecking your finances
When we asked those who had ordered delivery why they did it, convenience (43%) was the top reason, followed by treating themselves (28%). I can certainly relate to that myself, and I know millions of Americans share the same sentiment.
The trick, however, becomes figuring out how to indulge ourselves without delivering ourselves into debt.
Here are a few tips:
- Do it in moderation. “Everything in moderation, nothing in excess” is among the oldest pieces of personal finance advice, but it’s still some of the best. There’s nothing wrong with splurging every once in a while for delivery. We’ve all done it and will continue to do it. Where we often get ourselves into financial trouble is when we splurge too extravagantly and/or too frequently. Of course, controlling our impulses is easier said than done, and what is “too extravagant” or “too often” will depend on your circumstances, so you’ll need to think through what works for you.
- Consider upgrading your subscription. This won’t make sense for everyone, but if you use a service frequently, the perks associated with a paid subscription may bring value that outweighs the costs.
- Use the right credit card. Credit card issuers are well aware of the popularity of food-delivery services, so many now offer extra rewards on those purchases. If you’re a frequent, loyal customer of a particular food-delivery service, it can be worth your time to seek a credit card tied to your favorite service. Alternatively, many credit cards’ dining rewards earnings rates will also apply to third-party food-delivery services, so those could be an option. Just make sure you read the fine print around the card’s dining rewards.
- Budget for it. If you’re passionate about something and spend a lot of money on it regularly, you should account for it in your budget. Food delivery is no exception. Budgeting will not only help you understand how much you spend on food delivery each month, but it can also help you make adjustments more easily during months when you go a little overboard.
Methodology
To evaluate the cost of food delivery compared to other dining options, researchers compared the delivery costs from three apps with the pickup costs across five popular meals in the 10 major metros.
The delivery apps examined were:
- DoorDash
- Grubhub
- Uber Eats
The restaurants and meals included were:
- Buffalo Wild Wings: 10 wings with medium sauce
- Chick-fil-A: Chicken sandwich meal with medium fries and a medium Coke
- Chipotle: Burrito bowl (chicken, white rice and black beans)
- Starbucks: Grande cold brew
- Taco Bell: Cantina chicken burrito meal with a medium Pepsi
The metros analyzed were:
- Atlanta, GA
- Chicago, IL
- Dallas, TX
- Houston, TX
- Los Angeles, CA
- Miami, FL
- New York, NY
- Philadelphia, PA
- Phoenix, AZ
- Washington, DC
Researchers also compared each of these meals to the cost of a similar preprepared option from a grocery store. Additionally, we created simple recipes to approximate restaurant meals at home and estimated the per-meal cost of preparing them. The recipes included:
Buffalo Wild Wings-style 10-piece:
- 10 chicken wing sections, about one-and-one-fourth to one-and-one-half pounds; kosher salt and black pepper
- Neutral frying oil, such as canola or vegetable oil
- One-half cup of Frank’s RedHot; two tablespoons of unsalted butter; one-fourth teaspoon of garlic powder; a pinch of cayenne
Chick-fil-A-style chicken sandwich with waffle fries and a Coke:
- One small chicken breast (~6 oz); one-half cup of whole milk; one egg; one-half cup of all-purpose flour; one tablespoon of powdered sugar; half a teaspoon each of kosher salt, paprika and black pepper; one-fourth teaspoon each of garlic and onion powder; a pinch of cayenne
- Peanut oil (for frying)
- One soft potato bun; one tablespoon of butter; six to eight dill pickle chips
- Five ounces of frozen waffle fries
- 16 to 21 fluid ounces of Coca-Cola
Chipotle-style chicken burrito bowl (chicken, cilantro-lime rice and black beans):
- Seven ounces of boneless, skinless chicken thigh; one-half tablespoon of oil; one teaspoon of minced chipotles in adobo; one-fourth teaspoon of ground cumin; a pinch of dried oregano; one small minced garlic clove; one-half teaspoon of white vinegar; kosher salt
- Three-fourths to one cup of cooked white rice; one to two teaspoons of fresh lime juice; one to two tablespoons of chopped cilantro; a pinch of salt; a small drizzle of neutral oil or butter
- One-half cup of cooked black beans or canned beans, seasoned with a pinch of salt; optional additions include a tiny piece of bay leaf and garlic
- Optional toppings include pico de gallo, corn salsa, shredded lettuce, shredded cheese, sour cream and guacamole
Starbucks-style cold brew:
- Two ounces (56 grams) of medium-coarse ground coffee
- 16 fluid ounces of cold water to brew concentrate, served over ice
- Two teaspoons of sugar and two tablespoons of half-and-half, optional
Taco Bell-style cantina chicken burrito meal (burrito with chips and queso):
- One extra-large, 10-inch flour tortilla; six ounces of cooked chipotle chicken, sautéed with one to two tablespoons of chipotles in adobo, one cup of shredded red cabbage, one-fourth cup of shredded cheddar, one-fourth to one-half sliced avocado, one tablespoon of ranch and two tablespoons of pico de gallo
- About two ounces of tortilla chips and two ounces of jarred queso, warmed
For each restaurant order, we selected the closest frozen or ready-to-serve retail items that matched the core format, protein and flavor profile, with no added components beyond what was purchased.
- Buffalo Wild Wings 10 wings: Frozen buffalo-style bone-in wings, portioned to 10 wings.
- Chick-fil-A chicken sandwich meal (medium fries, medium Coke): Frozen chicken sandwich; 4.4 oz frozen waffle-fried potatoes as a medium proxy; 20 oz cola. Portion-costed by item/weight.
- Chipotle chicken burrito bowl (chicken): Frozen chicken burrito bowl (12 oz); single-serve, heat-and-eat.
- Starbucks grande cold brew: Bottled cold brew, assumed to be half a bottle per drink.
- Taco Bell cantina chicken burrito meal (medium Pepsi): Frozen burrito; three taquitos; 1 oz tortilla chips; 1 oz queso dip; 20 oz cola. Portion-costed as consumed.
To estimate cost differences across metros, researchers first calculated the price of the meals using Walmart prices in the New York metro. We then applied regional price parity adjustments for the other nine metros to estimate comparable costs in each location.
Additionally, LendingTree commissioned QuestionPro to conduct an online survey of 2,000 U.S. consumers ages 18 to 79 from Sept. 2 to 4, 2025. The survey was administered using a nonprobability-based sample, and quotas were used to ensure the sample base represented the overall population. Researchers reviewed all responses for quality control.
We defined generations as the following ages in 2025:
- Generation Z: 18 to 28
- Millennials: 29 to 44
- Generation X: 45 to 60
- Baby boomers: 61 to 79