Gas Prices Surge Across the US, Rising in Nearly Every State
Gas prices have risen sharply across the U.S., increasing in every state except Indiana.
The national average reached $3.79 per gallon on July 7, 2026, up 20.5% from a year earlier. Nearly every state and many metropolitan areas recorded double-digit percentage increases.
After rising rapidly in recent months, gas prices remain among the highest in years. Average prices increased by double digits in every state except Indiana, where they fell 1.4%.
- The U.S. average gas price was $3.79 per gallon on July 7, 2026, up 20.5% from $3.14 per gallon a year earlier.
- The average monthly gas price was $4.05 per gallon in June 2026, down from $4.48 in May 2026 and $4.10 in April, but it remained elevated.
- Hawaii had the highest average gas price at $5.46 per gallon, followed by California ($5.37) and Washington ($5.02).
- Indiana had the lowest average gas price at $3.06 per gallon, followed by Oklahoma and Texas (both $3.32).
- Average gas prices increased by double digits in every state except Indiana between July 7, 2025, and July 7, 2026. New Mexico recorded the largest increase (34.0%), followed by New York (27.2%) and Mississippi (27.1%).
- Indiana was the only state where average gas prices declined, falling (1.4%) between July 7, 2025, and July 7, 2026. The smallest increases were in Oregon (13.3%) and Washington (13.8%).
- Among metros, average gas prices increased the most in Durango, Colo. (52.0%), Farmington, N.M. (40.7%), and Flagstaff, Ariz. (40.3%).
- The 10 largest year-over-year declines in average metro gas prices all occurred in Indiana. Columbus recorded the largest decrease (6.6%), followed by Lafayette (5.6%) and Fort Wayne (4.9%).
How much have gas prices increased?
The average U.S. gas price was $3.79 per gallon on July 7, 2026, up 20.5% from $3.14 per gallon on July 7, 2025.
The average monthly gas price fell to $4.05 per gallon in June 2026 after averaging $4.48 in May and $4.10 in April. June 2026 tied June 2008 for the ninth-highest monthly average on record at $4.05 per gallon.
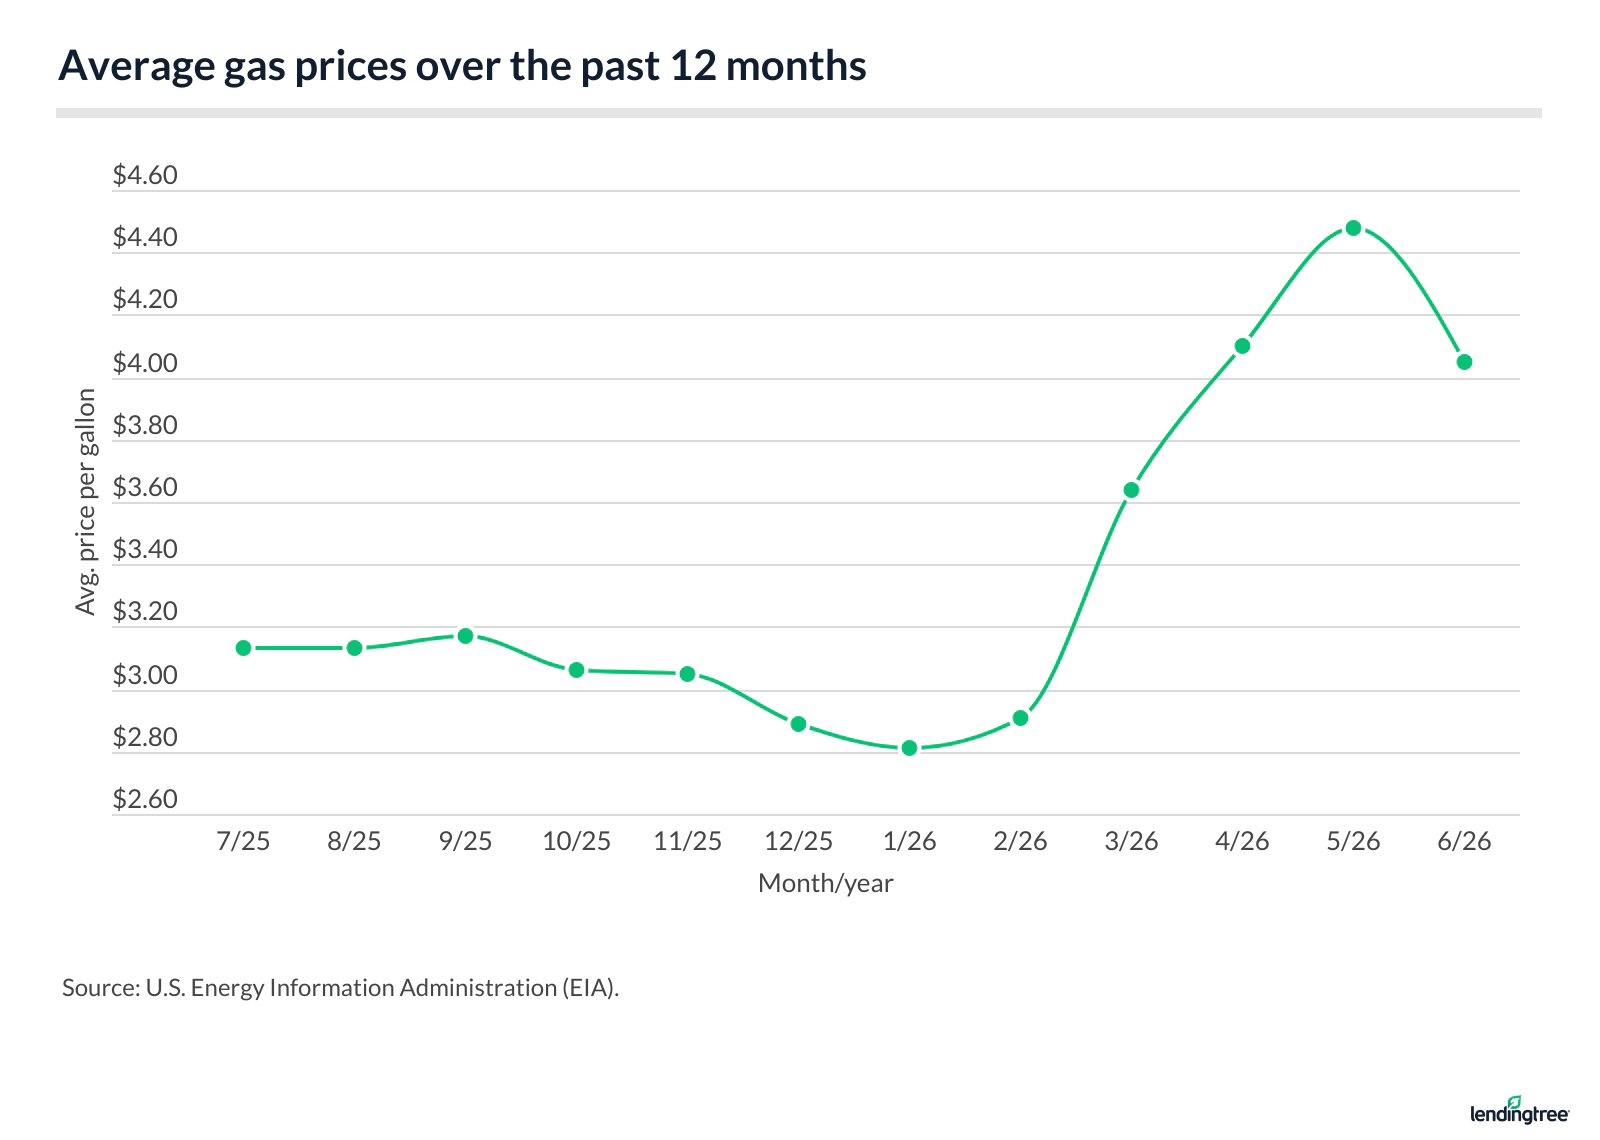
Average gas prices over the past 12 months
| Month | Avg. price per gallon |
|---|---|
| June 2026 | $4.05 |
| May 2026 | $4.48 |
| April 2026 | $4.10 |
| March 2026 | $3.64 |
| February 2026 | $2.91 |
| January 2026 | $2.81 |
| December 2025 | $2.89 |
| November 2025 | $3.05 |
| October 2025 | $3.06 |
| September 2025 | $3.17 |
| August 2025 | $3.13 |
| July 2025 | $3.13 |
Five of the 10 highest-priced months on record since 1992 occurred in 2022, including the top two. June 2026 became the latest month to average more than $4.00 per gallon, tying with June 2008 at $4.05. At $4.48 per gallon, May 2026 remains the third-highest month for average gas prices on record, behind only June and July 2022.
Highest gas prices (historical)
| Rank | Month | Avg. price per gallon |
|---|---|---|
| 1 | June 2022 | $4.93 |
| 2 | July 2022 | $4.56 |
| 3 | May 2026 | $4.48 |
| 4 | May 2022 | $4.44 |
| 5 | March 2022 | $4.22 |
| 6 | April 2022 | $4.11 |
| 7 | April 2026 | $4.10 |
| 8 | July 2008 | $4.06 |
| 9 | June 2008 | $4.05 |
| 9 | June 2026 | $4.05 |
However, 2022 didn’t have the highest inflation-adjusted gas prices. After adjusting for inflation, 2012 had the highest annual average at $5.07 per gallon, compared with an unadjusted average of $3.62.
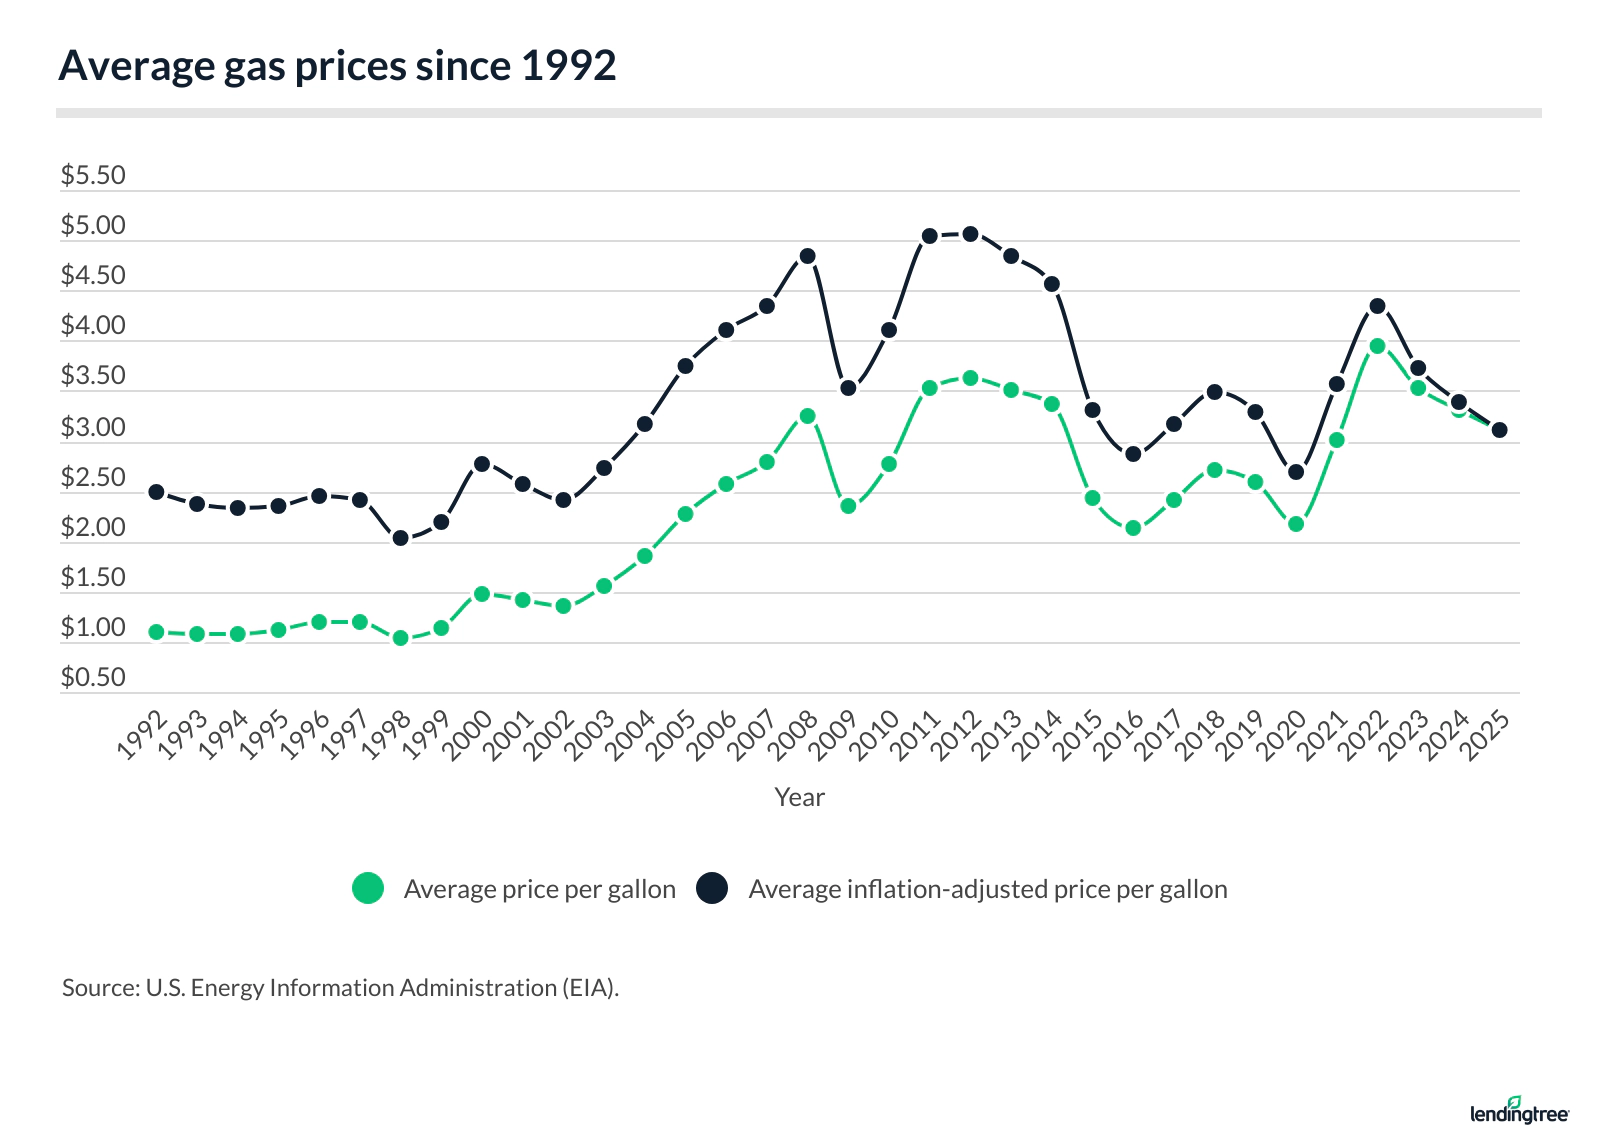
Average gas prices since 1992
| Year | Avg. price per gallon | Avg. inflation-adjusted price per gallon |
|---|---|---|
| 2025 | $3.10 | $3.10 |
| 2024 | $3.30 | $3.39 |
| 2023 | $3.52 | $3.72 |
| 2022 | $3.95 | $4.35 |
| 2021 | $3.01 | $3.57 |
| 2020 | $2.17 | $2.70 |
| 2019 | $2.60 | $3.28 |
| 2018 | $2.72 | $3.49 |
| 2017 | $2.42 | $3.17 |
| 2016 | $2.14 | $2.87 |
| 2015 | $2.43 | $3.30 |
| 2014 | $3.36 | $4.57 |
| 2013 | $3.51 | $4.84 |
| 2012 | $3.62 | $5.07 |
| 2011 | $3.52 | $5.04 |
| 2010 | $2.78 | $4.11 |
| 2009 | $2.35 | $3.53 |
| 2008 | $3.25 | $4.85 |
| 2007 | $2.80 | $4.34 |
| 2006 | $2.57 | $4.11 |
| 2005 | $2.27 | $3.74 |
| 2004 | $1.85 | $3.16 |
| 2003 | $1.56 | $2.73 |
| 2002 | $1.35 | $2.41 |
| 2001 | $1.42 | $2.58 |
| 2000 | $1.48 | $2.77 |
| 1999 | $1.14 | $2.20 |
| 1998 | $1.03 | $2.03 |
| 1997 | $1.20 | $2.41 |
| 1996 | $1.20 | $2.46 |
| 1995 | $1.11 | $2.35 |
| 1994 | $1.08 | $2.34 |
| 1993 | $1.07 | $2.38 |
| 1992 | $1.09 | $2.49 |
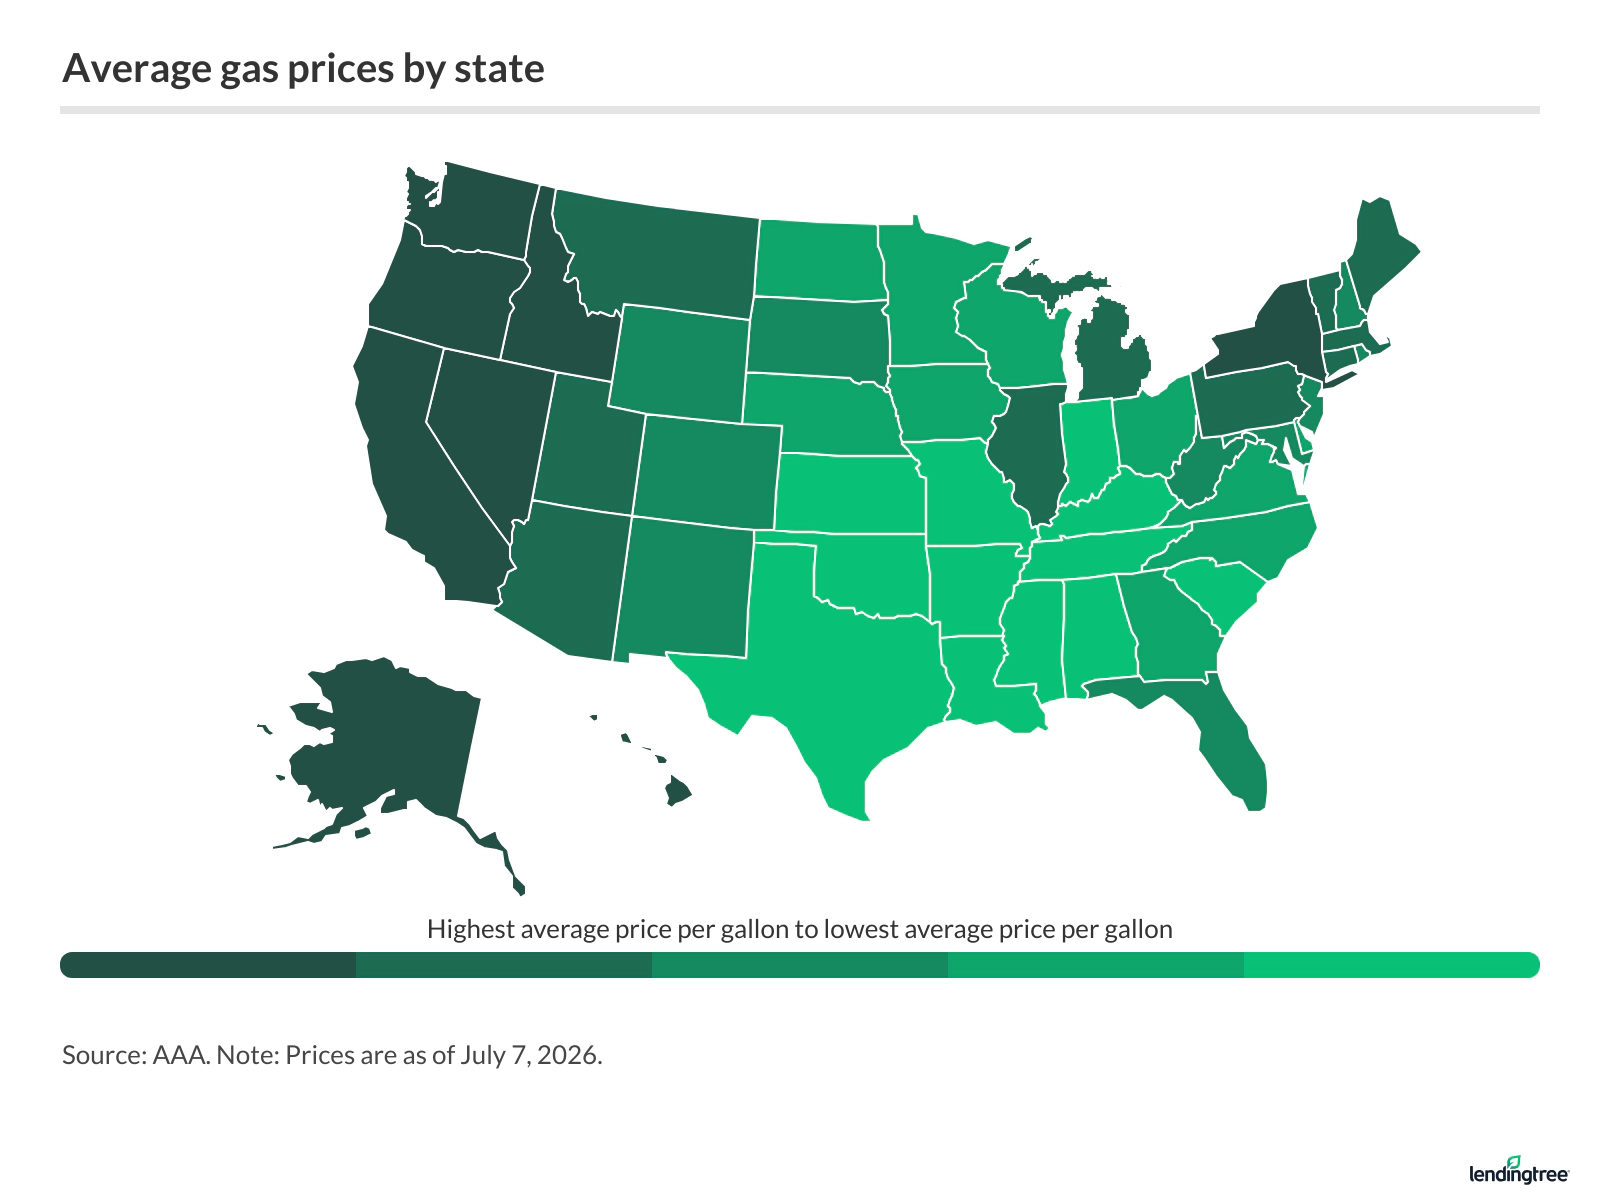
Where are gas prices highest and lowest?
As of July 7, 2026, Hawaii had the nation’s highest average gas price at $5.46 per gallon, followed by California ($5.37) and Washington ($5.02). They were the only states with average gas prices above $5.00 per gallon.
States with the highest average gas prices
| Rank | State | Avg. price per gallon |
|---|---|---|
| 1 | Hawaii | $5.46 |
| 2 | California | $5.37 |
| 3 | Washington | $5.02 |
| 4 | Alaska | $4.74 |
| 5 | Oregon | $4.56 |
Indiana had the nation’s lowest average gas price at $3.06 per gallon, followed by Oklahoma and Texas (both $3.32).
States with the lowest average gas prices
| Rank | State | Avg. price per gallon |
|---|---|---|
| 1 | Indiana | $3.06 |
| 2 | Oklahoma | $3.32 |
| 2 | Texas | $3.32 |
| 4 | Kentucky | $3.38 |
| 4 | Tennessee | $3.38 |
Full rankings
Average gas prices by state
| Rank | State | Avg. price per gallon | % difference from avg. U.S. gas price |
|---|---|---|---|
| 1 | Hawaii | $5.46 | 44.1% |
| 2 | California | $5.37 | 41.7% |
| 3 | Washington | $5.02 | 32.5% |
| 4 | Alaska | $4.74 | 25.1% |
| 5 | Oregon | $4.56 | 20.3% |
| 6 | Nevada | $4.54 | 19.8% |
| 7 | New York | $4.06 | 7.1% |
| 7 | District of Columbia | $4.06 | 7.1% |
| 9 | Idaho | $4.01 | 5.8% |
| 10 | Illinois | $3.98 | 5.0% |
| 11 | Vermont | $3.97 | 4.7% |
| 11 | Pennsylvania | $3.97 | 4.7% |
| 13 | Arizona | $3.92 | 3.4% |
| 14 | Michigan | $3.91 | 3.2% |
| 15 | Montana | $3.90 | 2.9% |
| 15 | Connecticut | $3.90 | 2.9% |
| 17 | Massachusetts | $3.87 | 2.1% |
| 18 | Utah | $3.86 | 1.8% |
| 19 | Maine | $3.85 | 1.6% |
| 20 | New Jersey | $3.84 | 1.3% |
| 21 | New Hampshire | $3.83 | 1.1% |
| 22 | Wyoming | $3.82 | 0.8% |
| 23 | New Mexico | $3.79 | 0.0% |
| 24 | Rhode Island | $3.76 | -0.8% |
| 25 | Florida | $3.73 | -1.6% |
| 26 | Maryland | $3.70 | -2.4% |
| 27 | West Virginia | $3.69 | -2.6% |
| 28 | Colorado | $3.66 | -3.4% |
| 29 | South Dakota | $3.65 | -3.7% |
| 30 | Delaware | $3.64 | -4.0% |
| 31 | Virginia | $3.62 | -4.5% |
| 32 | Minnesota | $3.59 | -5.3% |
| 32 | North Dakota | $3.59 | -5.3% |
| 34 | Nebraska | $3.57 | -5.8% |
| 35 | Ohio | $3.56 | -6.1% |
| 36 | Wisconsin | $3.55 | -6.3% |
| 36 | Georgia | $3.55 | -6.3% |
| 38 | Iowa | $3.49 | -7.9% |
| 39 | North Carolina | $3.48 | -8.2% |
| 40 | Missouri | $3.47 | -8.4% |
| 41 | Kansas | $3.46 | -8.7% |
| 42 | Alabama | $3.44 | -9.2% |
| 43 | Arkansas | $3.43 | -9.5% |
| 43 | South Carolina | $3.43 | -9.5% |
| 43 | Louisiana | $3.43 | -9.5% |
| 46 | Mississippi | $3.42 | -9.8% |
| 47 | Kentucky | $3.38 | -10.8% |
| 47 | Tennessee | $3.38 | -10.8% |
| 49 | Oklahoma | $3.32 | -12.4% |
| 49 | Texas | $3.32 | -12.4% |
| 51 | Indiana | $3.06 | -19.3% |
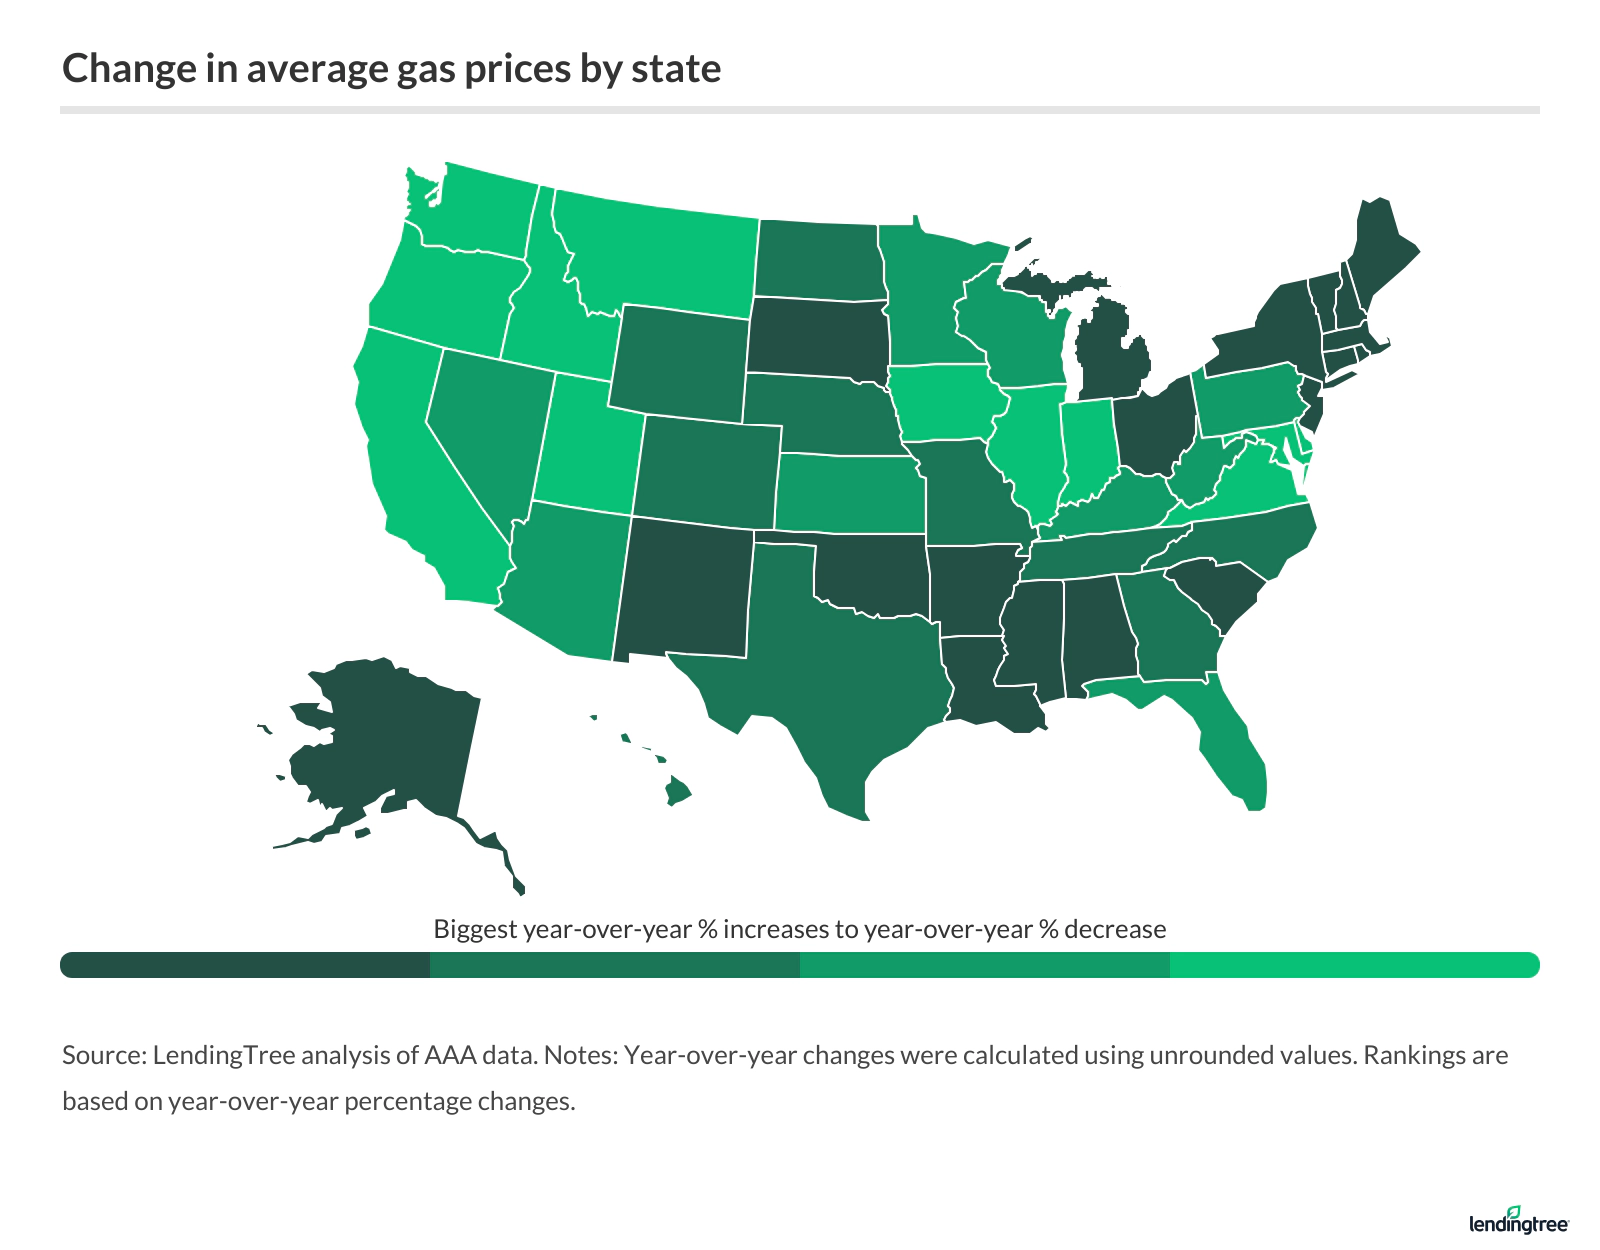
Where have gas prices increased the most?
Average gas prices increased by double digits in every state except Indiana between July 7, 2025, and July 7, 2026.
New Mexico recorded the largest increase in average gas prices, rising 34.0% from $2.83 to $3.79 per gallon. It was followed by New York, where prices increased 27.2% from $3.19 to $4.06, and Mississippi, where prices rose 27.1% from $2.69 to $3.42.
States with the biggest increases in average gas prices
| Rank | State | Avg. gas price, July 7, 2026 | Avg. gas price, July 7, 2025 | YoY % change | YoY $ change |
|---|---|---|---|---|---|
| 1 | New Mexico | $3.79 | $2.83 | 34.0% | $0.96 |
| 2 | New York | $4.06 | $3.19 | 27.2% | $0.87 |
| 3 | Mississippi | $3.42 | $2.69 | 27.1% | $0.73 |
| 4 | New Hampshire | $3.83 | $3.02 | 27.0% | $0.82 |
| 4 | Vermont | $3.97 | $3.12 | 27.0% | $0.84 |
Indiana was the only state where average gas prices declined between July 7, 2025, and July 7, 2026, falling 1.4% from $3.10 to $3.06 per gallon. (Indiana temporarily suspended most of its state gasoline taxes during the spring and summer of 2026.) The smallest increases occurred in Oregon, where prices rose 13.3% from $4.02 to $4.56, and Washington, where prices increased 13.8% from $4.41 to $5.02.
States with the smallest decrease and increases in average gas prices
| Rank | State | Avg. gas price, July 7, 2026 | Avg. gas price, July 7, 2025 | YoY % change | YoY $ change |
|---|---|---|---|---|---|
| 1 | Indiana | $3.06 | $3.10 | -1.4% | -$0.04 |
| 2 | Oregon | $4.56 | $4.02 | 13.3% | $0.54 |
| 3 | Washington | $5.02 | $4.41 | 13.8% | $0.61 |
| 4 | Delaware | $3.64 | $3.15 | 15.3% | $0.48 |
| 5 | Maryland | $3.70 | $3.20 | 15.6% | $0.50 |
Full rankings
Change in average gas prices by state
| Rank | State | Avg. gas price, July 7, 2026 | Avg. gas price, July 7, 2025 | YoY % change | YoY $ change |
|---|---|---|---|---|---|
| 1 | New Mexico | $3.79 | $2.83 | 34.0% | $0.96 |
| 2 | New York | $4.06 | $3.19 | 27.2% | $0.87 |
| 3 | Mississippi | $3.42 | $2.69 | 27.1% | $0.73 |
| 4 | New Hampshire | $3.83 | $3.02 | 27.0% | $0.82 |
| 4 | Vermont | $3.97 | $3.12 | 27.0% | $0.84 |
| 6 | Alaska | $4.74 | $3.73 | 26.9% | $1.01 |
| 7 | Massachusetts | $3.87 | $3.06 | 26.3% | $0.81 |
| 8 | Maine | $3.85 | $3.07 | 25.3% | $0.78 |
| 9 | Ohio | $3.56 | $2.85 | 25.0% | $0.71 |
| 10 | Michigan | $3.91 | $3.14 | 24.7% | $0.78 |
| 11 | Alabama | $3.44 | $2.76 | 24.6% | $0.68 |
| 12 | Rhode Island | $3.76 | $3.02 | 24.3% | $0.73 |
| 13 | Louisiana | $3.43 | $2.76 | 24.2% | $0.67 |
| 14 | Arkansas | $3.43 | $2.76 | 24.0% | $0.66 |
| 15 | South Dakota | $3.65 | $2.95 | 23.9% | $0.70 |
| 16 | South Carolina | $3.43 | $2.77 | 23.8% | $0.66 |
| 17 | Connecticut | $3.90 | $3.16 | 23.5% | $0.74 |
| 18 | Oklahoma | $3.32 | $2.69 | 23.3% | $0.63 |
| 19 | New Jersey | $3.84 | $3.12 | 23.1% | $0.72 |
| 20 | Wyoming | $3.82 | $3.11 | 22.9% | $0.71 |
| 21 | Tennessee | $3.38 | $2.75 | 22.7% | $0.63 |
| 22 | Texas | $3.32 | $2.71 | 22.6% | $0.61 |
| 23 | Missouri | $3.47 | $2.83 | 22.5% | $0.64 |
| 24 | North Dakota | $3.59 | $2.93 | 22.3% | $0.65 |
| 25 | Georgia | $3.55 | $2.90 | 22.2% | $0.65 |
| 25 | Hawaii | $5.46 | $4.47 | 22.2% | $0.99 |
| 27 | North Carolina | $3.48 | $2.85 | 22.1% | $0.63 |
| 28 | Nebraska | $3.57 | $2.92 | 22.0% | $0.64 |
| 29 | Colorado | $3.66 | $3.01 | 21.7% | $0.65 |
| 30 | Arizona | $3.92 | $3.22 | 21.6% | $0.70 |
| 31 | West Virginia | $3.69 | $3.04 | 21.5% | $0.65 |
| 31 | Florida | $3.73 | $3.07 | 21.5% | $0.66 |
| 33 | District of Columbia | $4.06 | $3.35 | 21.4% | $0.72 |
| 33 | Wisconsin | $3.55 | $2.93 | 21.4% | $0.63 |
| 35 | Nevada | $4.54 | $3.76 | 20.8% | $0.78 |
| 36 | Minnesota | $3.59 | $2.99 | 20.2% | $0.60 |
| 37 | Kentucky | $3.38 | $2.82 | 20.0% | $0.57 |
| 38 | Kansas | $3.46 | $2.89 | 19.9% | $0.58 |
| 39 | Pennsylvania | $3.97 | $3.31 | 19.8% | $0.66 |
| 40 | Montana | $3.90 | $3.27 | 19.5% | $0.64 |
| 41 | Virginia | $3.62 | $3.05 | 18.8% | $0.57 |
| 42 | Iowa | $3.49 | $2.95 | 18.4% | $0.54 |
| 43 | California | $5.37 | $4.56 | 17.7% | $0.81 |
| 44 | Idaho | $4.01 | $3.42 | 17.4% | $0.60 |
| 45 | Utah | $3.86 | $3.30 | 17.1% | $0.56 |
| 46 | Illinois | $3.98 | $3.41 | 16.5% | $0.56 |
| 47 | Maryland | $3.70 | $3.20 | 15.6% | $0.50 |
| 48 | Delaware | $3.64 | $3.15 | 15.3% | $0.48 |
| 49 | Washington | $5.02 | $4.41 | 13.8% | $0.61 |
| 50 | Oregon | $4.56 | $4.02 | 13.3% | $0.54 |
| 51 | Indiana | $3.06 | $3.10 | -1.4% | -$0.04 |
Largest metro gas price declines were concentrated in Indiana
Indiana accounted for the 10 metros with the largest year-over-year declines in average gas prices during the period analyzed.
Among metros, Durango, Colo., recorded the largest increase in average gas prices, rising 52.0% from $2.91 to $4.42 per gallon. It was followed by Farmington, N.M., where prices increased 40.7% from $2.94 to $4.14, and Flagstaff, Ariz., where prices rose 40.3%, from $3.12 to $4.37.
Metros with the biggest increases in average gas prices
| Rank | Metro | Avg. gas price, July 7, 2026 | Avg. gas price, July 7, 2025 | YoY % change | YoY $ change |
|---|---|---|---|---|---|
| 1 | Durango, CO | $4.42 | $2.91 | 52.0% | $1.51 |
| 2 | Farmington, NM | $4.14 | $2.94 | 40.7% | $1.20 |
| 3 | Flagstaff, AZ | $4.37 | $3.12 | 40.3% | $1.25 |
| 4 | Yuma, AZ | $4.08 | $2.95 | 38.2% | $1.13 |
| 5 | Sierra Vista-Douglas, AZ | $4.19 | $3.04 | 38.0% | $1.15 |
| 6 | McAllen-Edinburg-Mission, TX | $3.38 | $2.46 | 37.6% | $0.92 |
| 7 | Brownsville-Harlingen, TX | $3.39 | $2.48 | 36.7% | $0.91 |
| 8 | Springfield, OH | $3.59 | $2.63 | 36.3% | $0.96 |
| 9 | Glenwood Springs, CO | $4.54 | $3.34 | 36.2% | $1.20 |
| 10 | Prescott, AZ | $4.32 | $3.18 | 35.9% | $1.14 |
Columbus, Ind., recorded the largest decline in average gas prices, falling 6.6% from $3.14 to $2.93 per gallon. It was followed by Lafayette, Ind., where prices decreased 5.6% from $3.29 to $3.11, and Fort Wayne, Ind., where prices fell 4.9% from $3.10 to $2.95.
Metros with the largest decreases in average gas prices
| Rank | Metro | Avg. gas price, July 7, 2026 | Avg. gas price, July 7, 2025 | YoY % change | YoY $ change |
|---|---|---|---|---|---|
| 1 | Columbus, IN | $2.93 | $3.14 | -6.6% | -$0.21 |
| 2 | Lafayette, IN | $3.11 | $3.29 | -5.6% | -$0.18 |
| 3 | Fort Wayne, IN | $2.95 | $3.10 | -4.9% | -$0.15 |
| 4 | Terre Haute, IN | $2.97 | $3.09 | -3.8% | -$0.12 |
| 5 | Indianapolis, IN | $2.97 | $3.07 | -3.4% | -$0.10 |
| 6 | Kokomo, IN | $2.98 | $3.07 | -3.0% | -$0.09 |
| 6 | Elkhart, IN | $3.09 | $3.18 | -3.0% | -$0.09 |
| 8 | Bloomington, IN | $3.11 | $3.18 | -2.4% | -$0.07 |
| 9 | South Bend, IN | $3.11 | $3.18 | -2.3% | -$0.07 |
| 10 | Michigan City-La Porte, IN | $3.17 | $3.22 | -1.5% | -$0.05 |
How can you use credit cards to earn cash back on gas purchases?
The U.S. Energy Information Administration (EIA) forecasts that gas prices will average $3.64 per gallon in 2026 before falling to $3.09 per gallon in 2027.
LendingTree chief consumer finance analyst Matt Schulz says drivers can take several steps to reduce fuel costs, starting with comparing prices at nearby stations.
“It doesn’t make sense to drive across town to save 3 cents a gallon, but gas prices can vary quite a bit even within a small area,” he says. “Driving a few extra blocks for a lower price can add up over the course of a year, especially if you fill up frequently.”
Schulz also recommends using a credit card that offers strong rewards on gas purchases.
“Whether you’re loyal to a specific gas station chain or simply want to save no matter where you fill up, plenty of credit cards can help,” he says. “Just know that gas station-specific cards tend to have higher-than-average APRs, so pay your balance in full every month if you use one. Otherwise, the interest you accrue can quickly outweigh any savings at the pump.”
Methodology
LendingTree researchers analyzed AAA data on average regular gas prices across states and metropolitan areas. Prices were as of July 7, 2026, and were compared with those from July 7, 2025.
LendingTree researchers also analyzed U.S. Energy Information Administration (EIA) data to calculate historical average prices for regular gas per gallon.