Snapshots of Black and White Disparities in Income, Wealth, Unemployment and More
Racial disparities in finances have long existed in the U.S. In recognition of Black History Month, LendingTree researchers updated this compilation of data on income, wealth, savings, employment, credit and retirement to highlight key gaps between Black and white Americans.
Below are the key findings that illustrate the scope of Black and white economic inequality.
- The median income for Black households in the U.S. is 36.3% lower than that of white households. Black households earned a median of $56,020 in 2024, compared with $88,010 for white households. This represents a widening from the 33.3% gap in 2023, when median incomes were $56,490 for Black households and $84,630 for white households.
- Black workers earn less than white workers in nearly every major industry. In financial activities (which include banking, insurance and real estate), Black workers make 30.4% less than white workers ($80,792 versus $116,120). In wholesale and retail trade, they earn 30.0% less ($52,847 versus $75,455). And in transportation and utilities, Black workers take home 29.7% less ($61,897 versus $88,057). Across these three sectors, Black workers earn 70% of what white workers earn.
- Black Americans hold $5.71 trillion in wealth, compared with $139.73 trillion held by white Americans. As of the second quarter of 2025, white Americans hold 83.5% of the country’s wealth, while Black Americans hold 3.4%, despite representing 57.5% and 13.7% of the population, respectively.
- About 2 in 3 Black adults say they’re doing OK financially. In 2024, 65% of Black adults reported feeling financially OK, down from 68% in 2023. That compares with 77% of white adults in 2024, up from 76% the year before.
- The unemployment rate among Black Americans is more than double that of white Americans. As of Q3 2025, 7.8% of Black Americans were unemployed, compared with 3.8% of white Americans. The rate is higher among Black women (8.0%) than Black men (7.5%).
- Black adults are significantly more likely to be denied credit or approved for less than requested than their white counterparts. In 2024, 51% of Black adults who applied for credit were denied or approved for less than requested, compared with 26% of white adults.
Income
The Black and white income gap across the U.S. has remained wide since 1970:
- 1970: The median income for Black households in 2018 dollars was $30,400, according to a 2020 Pew Research Center report. That compares with $54,100 for white households — a difference of $23,700, meaning Black households earned 43.8% less.
- 2024: The median income for Black households was $56,020, according to the U.S. Census Bureau Current Population Survey (CPS) 2025 Annual Social and Economic (ASEC) Supplement. That compares with $88,010 for white households — a difference of $31,990, or 36.3% less.
Household income nationally (2024)
| Median | Avg. | |
|---|---|---|
| White households | $88,010 | $124,500 |
| Black households | $56,020 | $83,810 |
| Difference ($) | -$31,990 | -$40,690 |
| Difference (%) | -36.3% | -32.7% |
The 2024 gap was wider compared to 2023, when the median household income gap stood at 33.3%. That year, Black households earned a median of $56,490, compared with $84,630 for white households.
In the third quarter of 2025, median weekly wages for full-time Black workers equaled 78.4% of the wages earned by full-time white workers, according to an analysis of U.S. Bureau of Labor Statistics (BLS) data. That translates to $970 per week for Black workers versus $1,238 for white workers — a difference of $268 per week, or $13,936 annually.
Average earnings vary widely by industry and race. For example, Census Bureau data shows that full-time Black workers in the financial activities industry earned $80,792 annually as of March 2025, while full-time white workers in that same industry earned $116,120. That means Black workers in financial activities earn 70 cents for every dollar earned by their white counterparts. Similar gaps exist in the wholesale and retail trade and transportation and utilities industries, where Black workers also earn 70 cents on the dollar.
Here are examples of roles in those industries:
- Financial activities: Bankers, insurers and real estate agents
- Wholesale and retail trade: Truck drivers, wholesale sales representatives, cashiers and customer service representatives
- Transportation and utilities: Airline pilots, school bus drivers and meter readers
In just one sector — agriculture — full-time Black workers earn more on average than white workers, with annual wages of $88,679 versus $75,435.
Annual wages by industry and race (full-time workers)
| Industry | Annual wages (white workers) | Annual wages (Black workers) | Difference ($) | Difference (%) | Cents on the dollar (Black vs. white) |
|---|---|---|---|---|---|
| Agriculture, forestry, fishing and hunting | $75,435 | $88,679 | $13,244 | 17.6% | $1.18 |
| Other services | $71,105 | $67,773 | -$3,332 | -4.7% | $0.95 |
| Construction | $83,234 | $77,070 | -$6,164 | -7.4% | $0.93 |
| Educational and health services | $81,374 | $68,776 | -$12,598 | -15.5% | $0.85 |
| Public administration | $94,088 | $79,001 | -$15,087 | -16.0% | $0.84 |
| Leisure and hospitality | $59,248 | $49,029 | -$10,219 | -17.2% | $0.83 |
| Mining | $115,445 | $94,150 | -$21,295 | -18.4% | $0.82 |
| Manufacturing | $92,156 | $74,938 | -$17,218 | -18.7% | $0.81 |
| Information | $122,640 | $90,519 | -$32,081 | -26.2% | $0.74 |
| Professional and business services | $113,893 | $82,994 | -$30,899 | -27.1% | $0.73 |
| Transportation and utilities | $88,057 | $61,897 | -$26,160 | -29.7% | $0.70 |
| Wholesale and retail trade | $75,455 | $52,847 | -$22,608 | -30.0% | $0.70 |
| Financial activities | $116,120 | $80,792 | -$35,328 | -30.4% | $0.70 |
Wealth
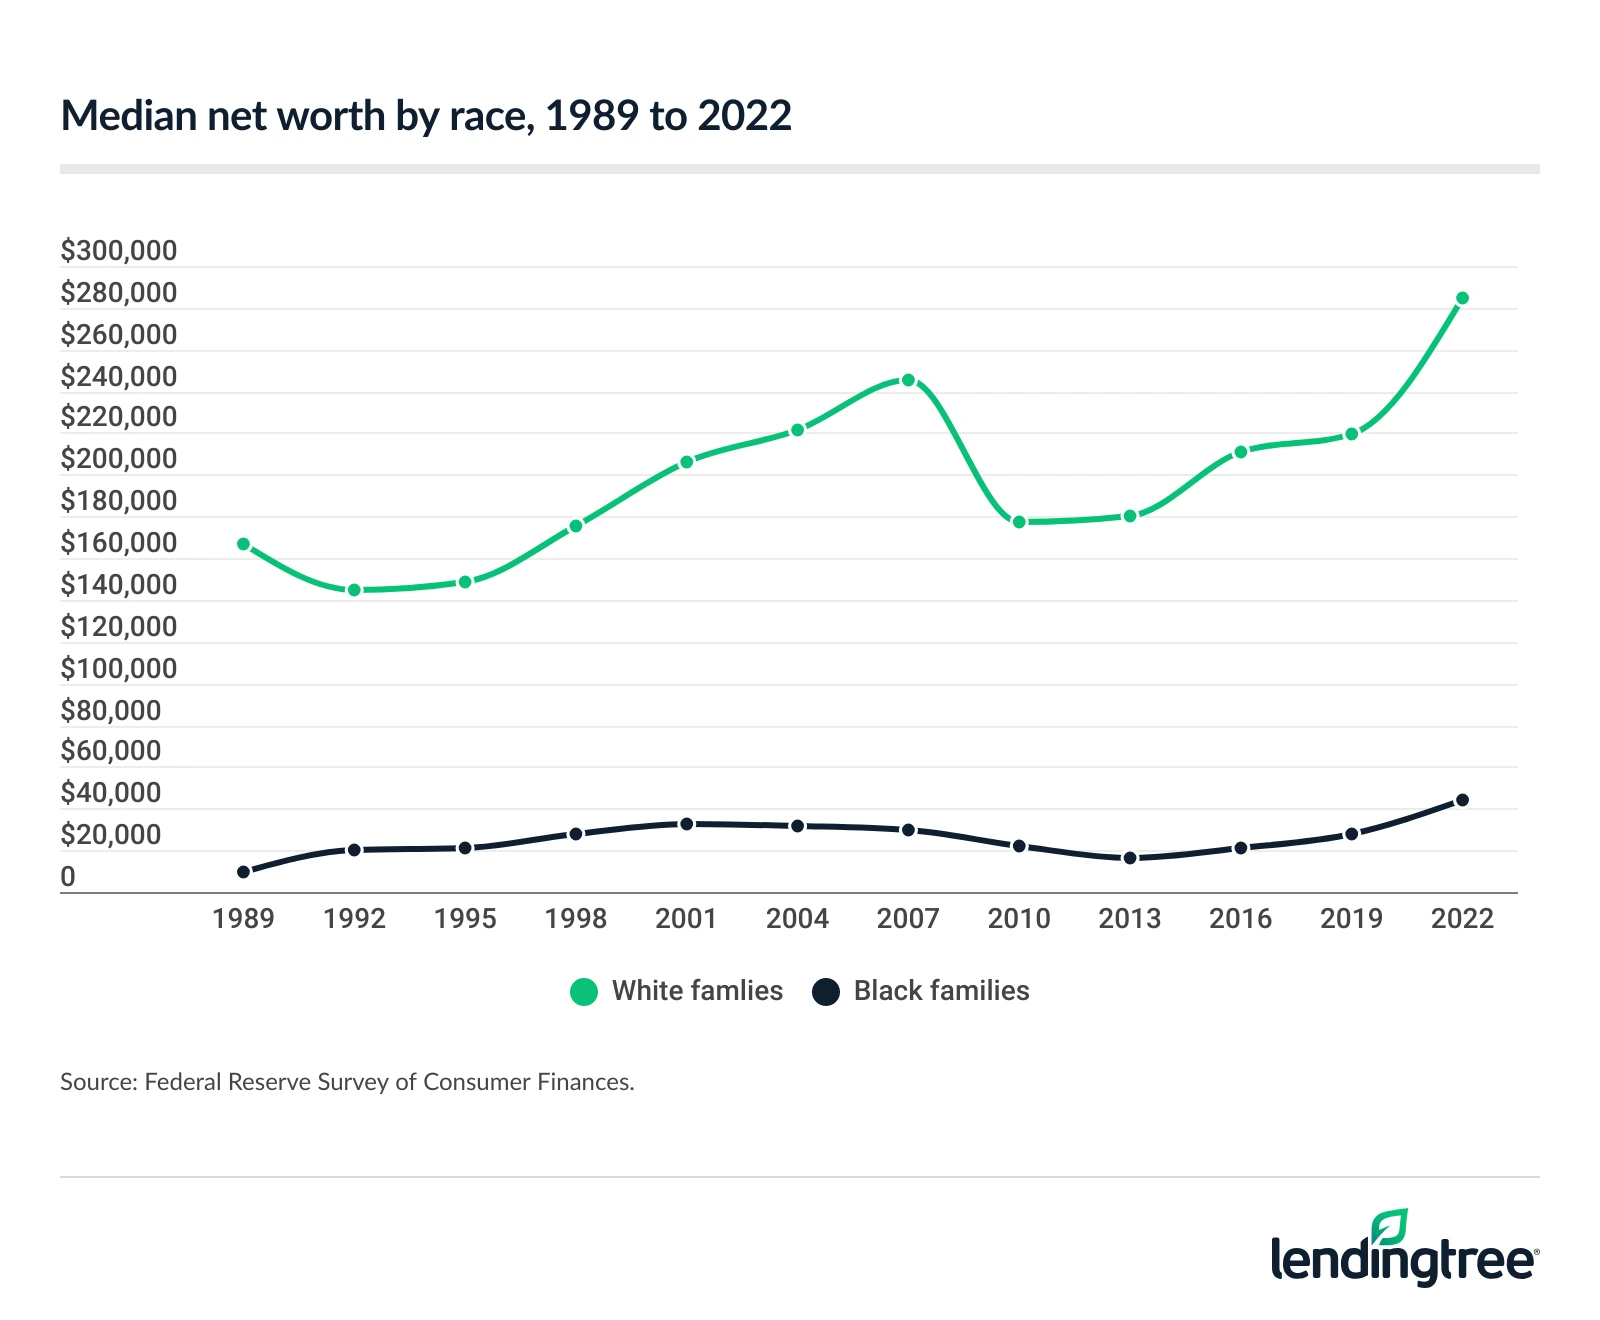
Median net worth for Black and white families has fluctuated over time, though the gap remains wide. (Note: The triennial Federal Reserve Survey of Consumer Finances isn’t scheduled for release until late 2026, so most of the data in this section is unchanged from last year’s report.)
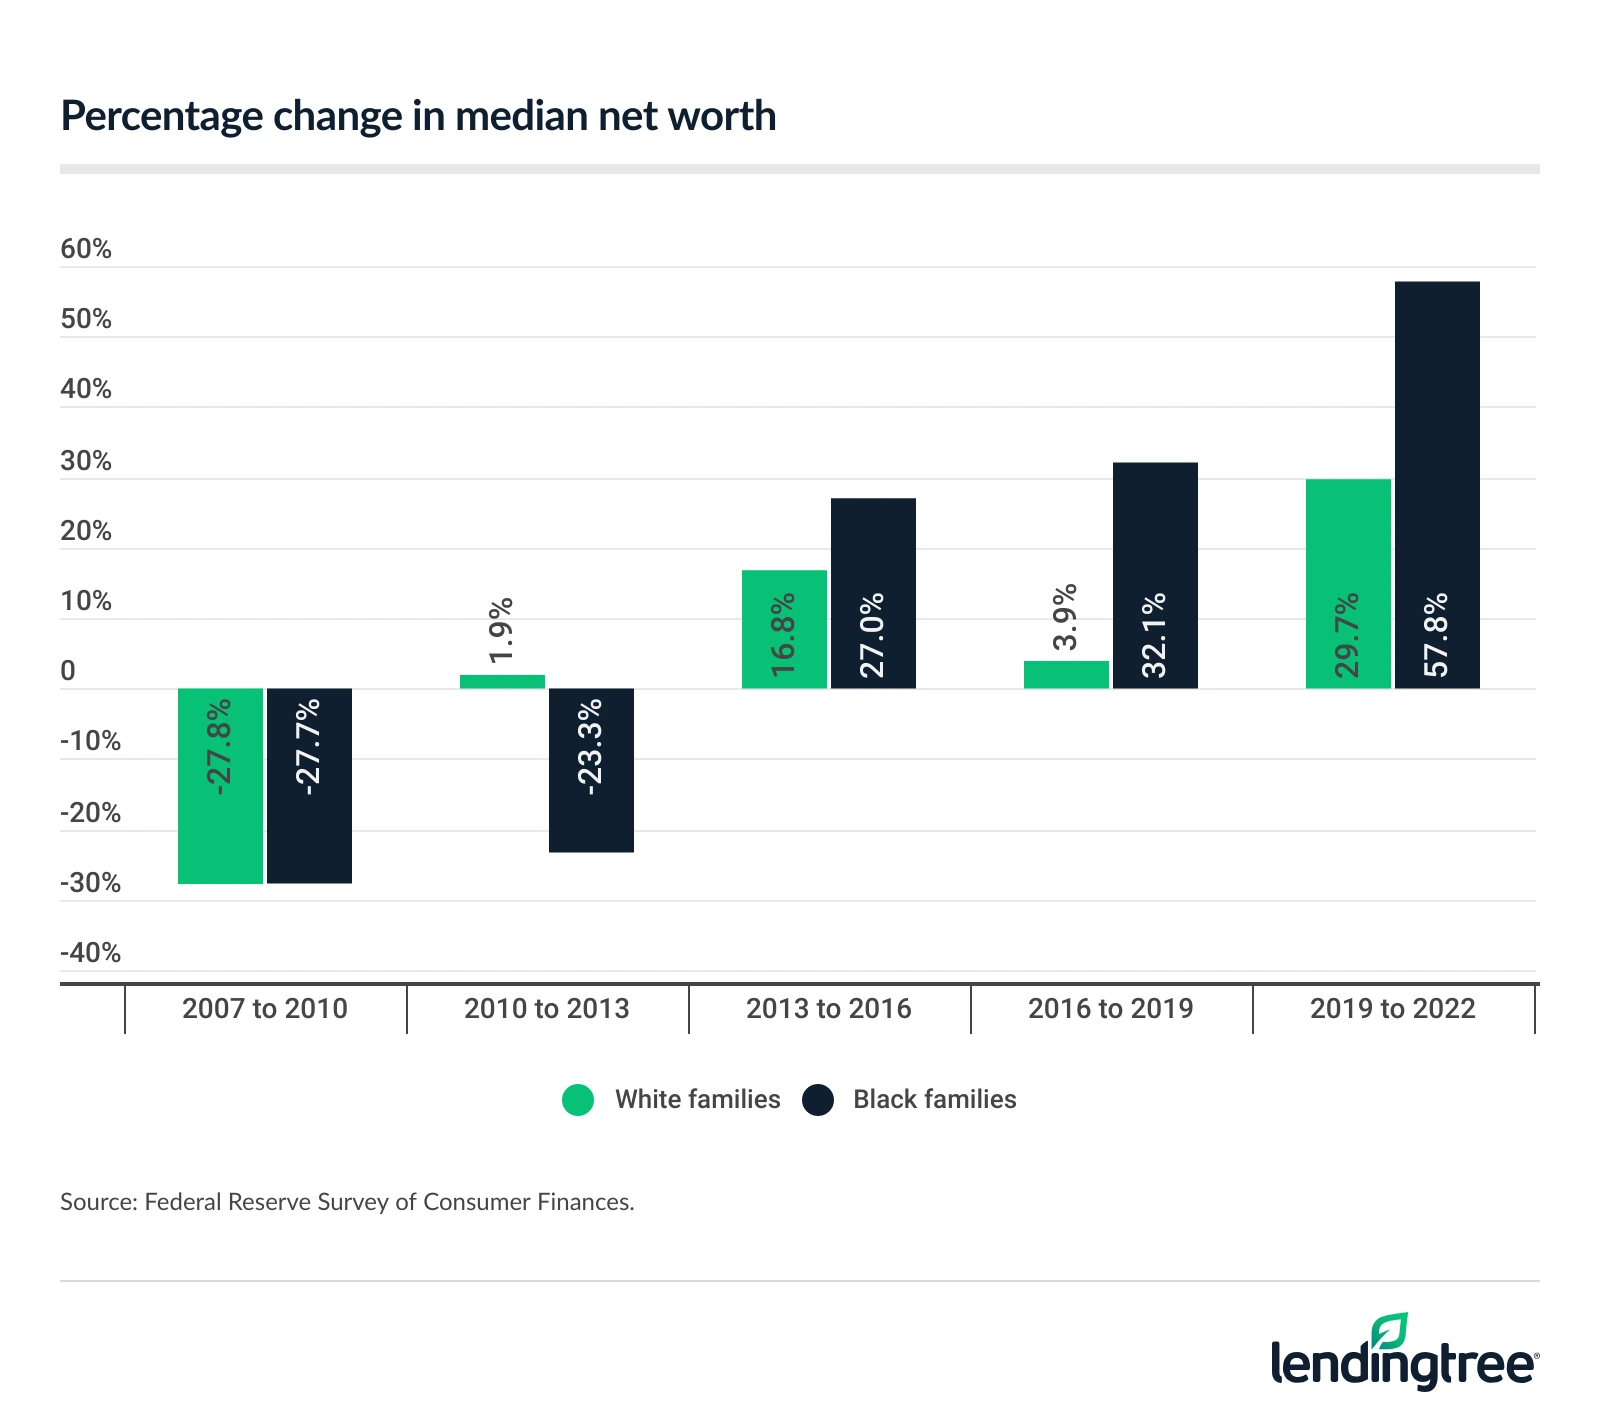
- Black and white families saw similar declines of 27.7% and 27.8%, respectively, in median net worth from 2007 to 2010 amid the Great Recession of 2007 to 2009. The median net worth for Black families fell from $30,050 to $21,720, while the median net worth for white families dropped from $245,450 to $177,210.
- Between 2010 and 2013, the median net worth for Black families saw another sharp decline (23.3%) to $16,650, while white families’ net worth rebounded modestly, rising 1.9% to $180,620.
- Between 2013 and 2016, however, the median net worth for Black families rose sharply, increasing 27.0% to $21,150. Over the same period, white families’ median net worth climbed 16.8% to $210,910.
- That growth continued between 2016 and 2019, with median net worth rising 32.1% to $27,940 for Black families and 3.9% to $219,210 for white families.
- Between 2019 and 2022, the median net worth for Black families surged 57.8% to $44,100, while the median net worth for white families rose 29.7% to $284,310.
That said, the difference in median net worth between Black and white families widened from $155,490 in 2010 — after peaking in the lead-up to the Great Recession — to $240,210 in 2022.
It’s encouraging that there has been some median wealth growth among Black families, says LendingTree chief consumer finance analyst Matt Schulz, but he notes that the data doesn’t tell the whole story.
“It may tell you more about where these two groups were starting from than anything else,” he says. “That’s because it’s a lot easier to have high-percentage growth when starting with a low base than when starting with a much larger one.”
In other words, someone who earns $20,000 and receives a $5,000 raise sees a much larger percentage increase than someone who earns $100,000 and receives the same $5,000 raise. Either way, Schulz says, a $5,000 raise is meaningful, but it’s likely more consequential for the person who started with the smaller income.
The data reflects a similar dynamic. In fact, Black families’ median and average net worth in 2022 remained significantly lower than that of white families.
Net worth among families
| Median net worth | Avg. net worth | |||
|---|---|---|---|---|
| Black families | White families | Black families | White families | |
| 1989 | $9,910 | $166,420 | $95,670 | $533,320 |
| 1992 | $20,510 | $144,420 | $99,800 | $462,080 |
| 1995 | $21,130 | $148,640 | $85,160 | $488,520 |
| 1998 | $28,260 | $175,000 | $116,840 | $617,770 |
| 2001 | $32,310 | $205,740 | $119,960 | $818,570 |
| 2004 | $32,050 | $221,500 | $176,500 | $884,570 |
| 2007 | $30,050 | $245,450 | $192,400 | $991,120 |
| 2010 | $21,720 | $177,210 | $135,590 | $886,600 |
| 2013 | $16,650 | $180,620 | $126,040 | $886,540 |
| 2016 | $21,150 | $210,910 | $170,270 | $1,146,830 |
| 2019 | $27,940 | $219,210 | $164,990 | $1,136,660 |
| 2022 | $44,100 | $284,310 | $211,600 | $1,361,810 |
Black Americans held a significantly smaller share of U.S. wealth as of the second quarter of 2025, according to the Federal Reserve. Black Americans held 3.4% — or $5.71 trillion — of the nation’s wealth, compared with 83.5% — or $139.73 trillion — held by white Americans.
This disparity doesn’t reflect population shares, according to the Census Bureau. Black and white Americans account for 13.7% and 57.5% of the population, respectively.
Savings
In 2024, 13% of Black adults were unbanked, compared with just 3% of white adults. (“Unbanked” refers to respondents or their spouses or partners who lack a checking, savings or money market account.)
Even among those with bank accounts, Black adults were more than twice as likely as white adults to incur an overdraft fee (21% versus 9%).
The gap extends to savings: In 2024, 60% of white adults had at least three months of emergency savings, compared with 41% of Black adults.
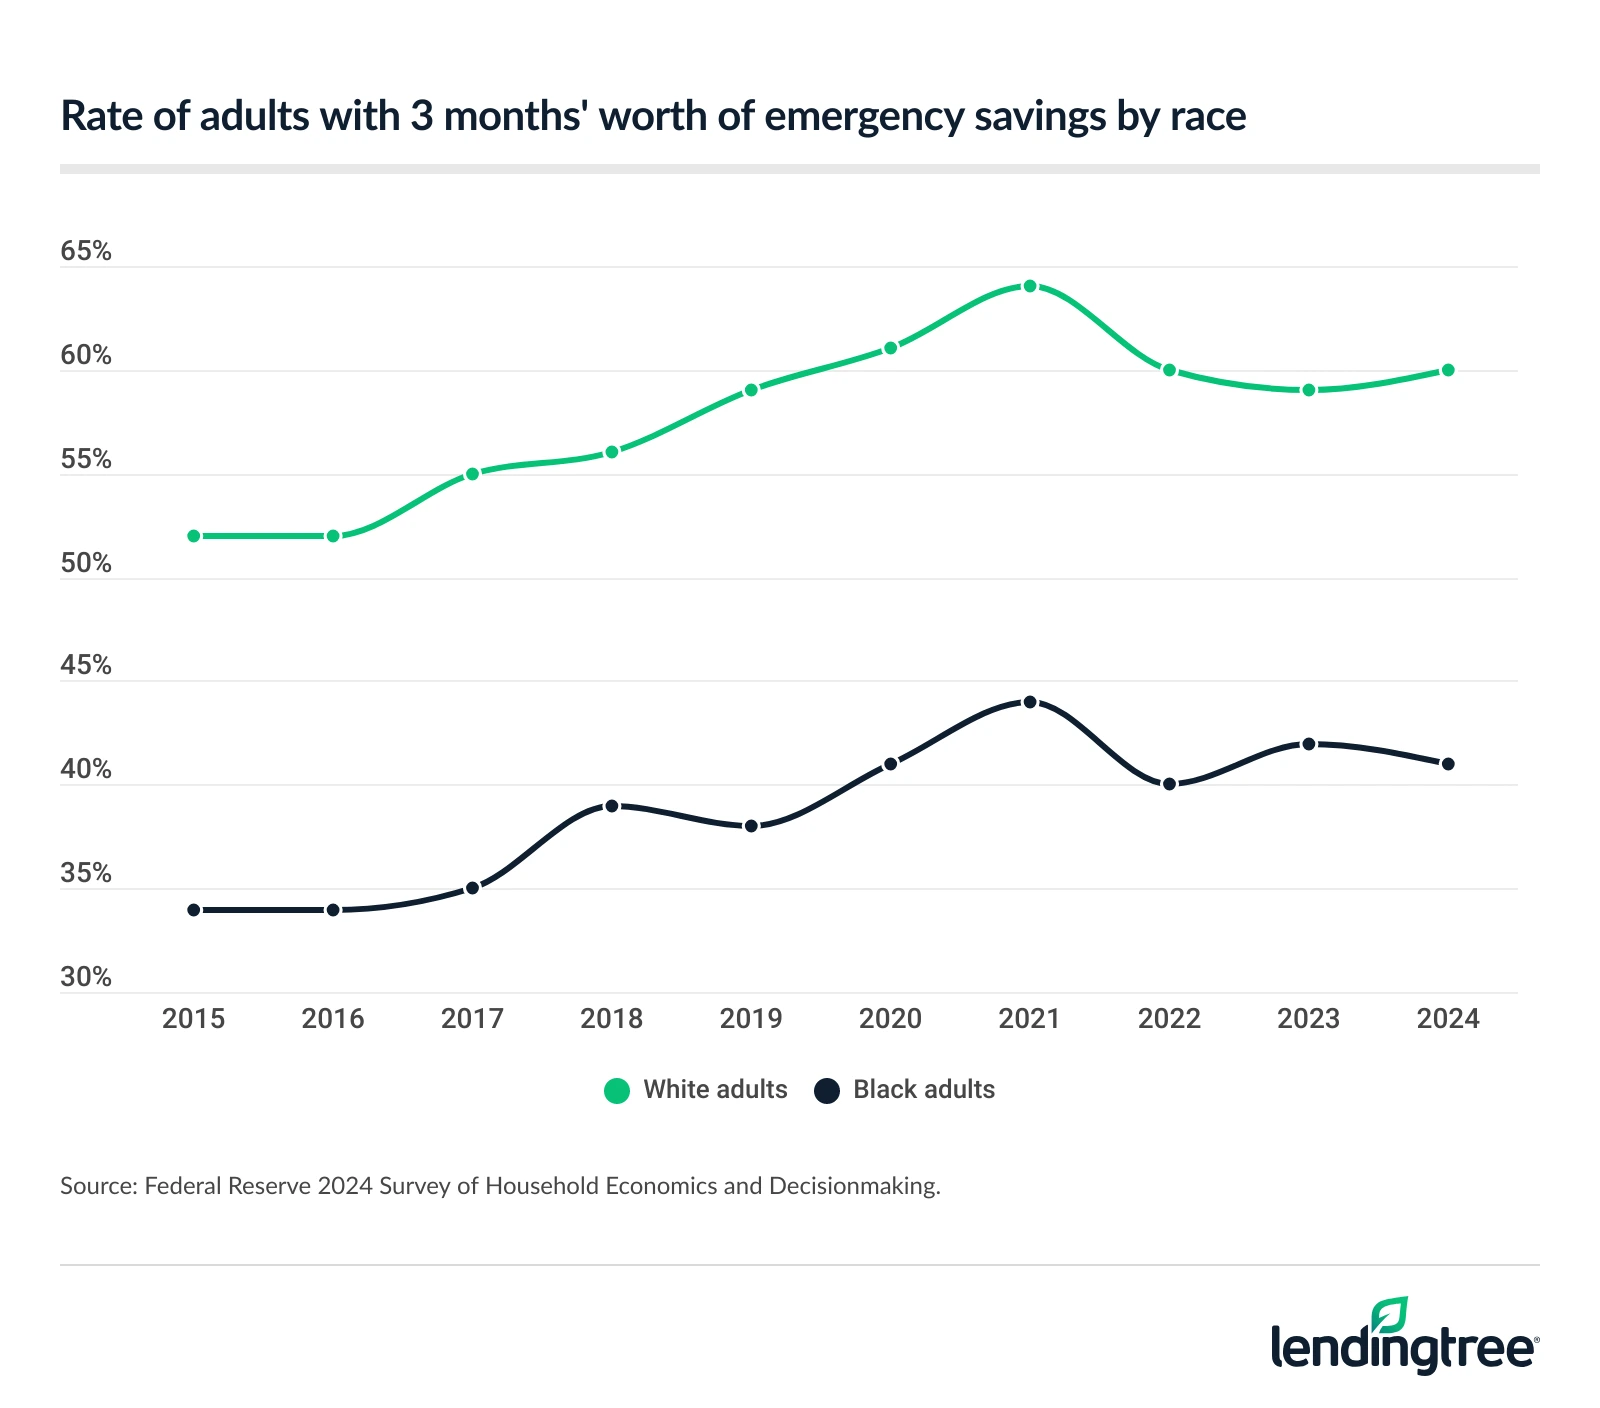
“Black households often have less financial margin for error than white households because of income disparities,” Schulz says. “That’s a problem at any time, but it’s particularly troubling during periods of inflation. Higher prices leave people with even less wiggle room, meaning less money to pay down credit card debt, build emergency savings or put toward college, a mortgage or other major goals.”
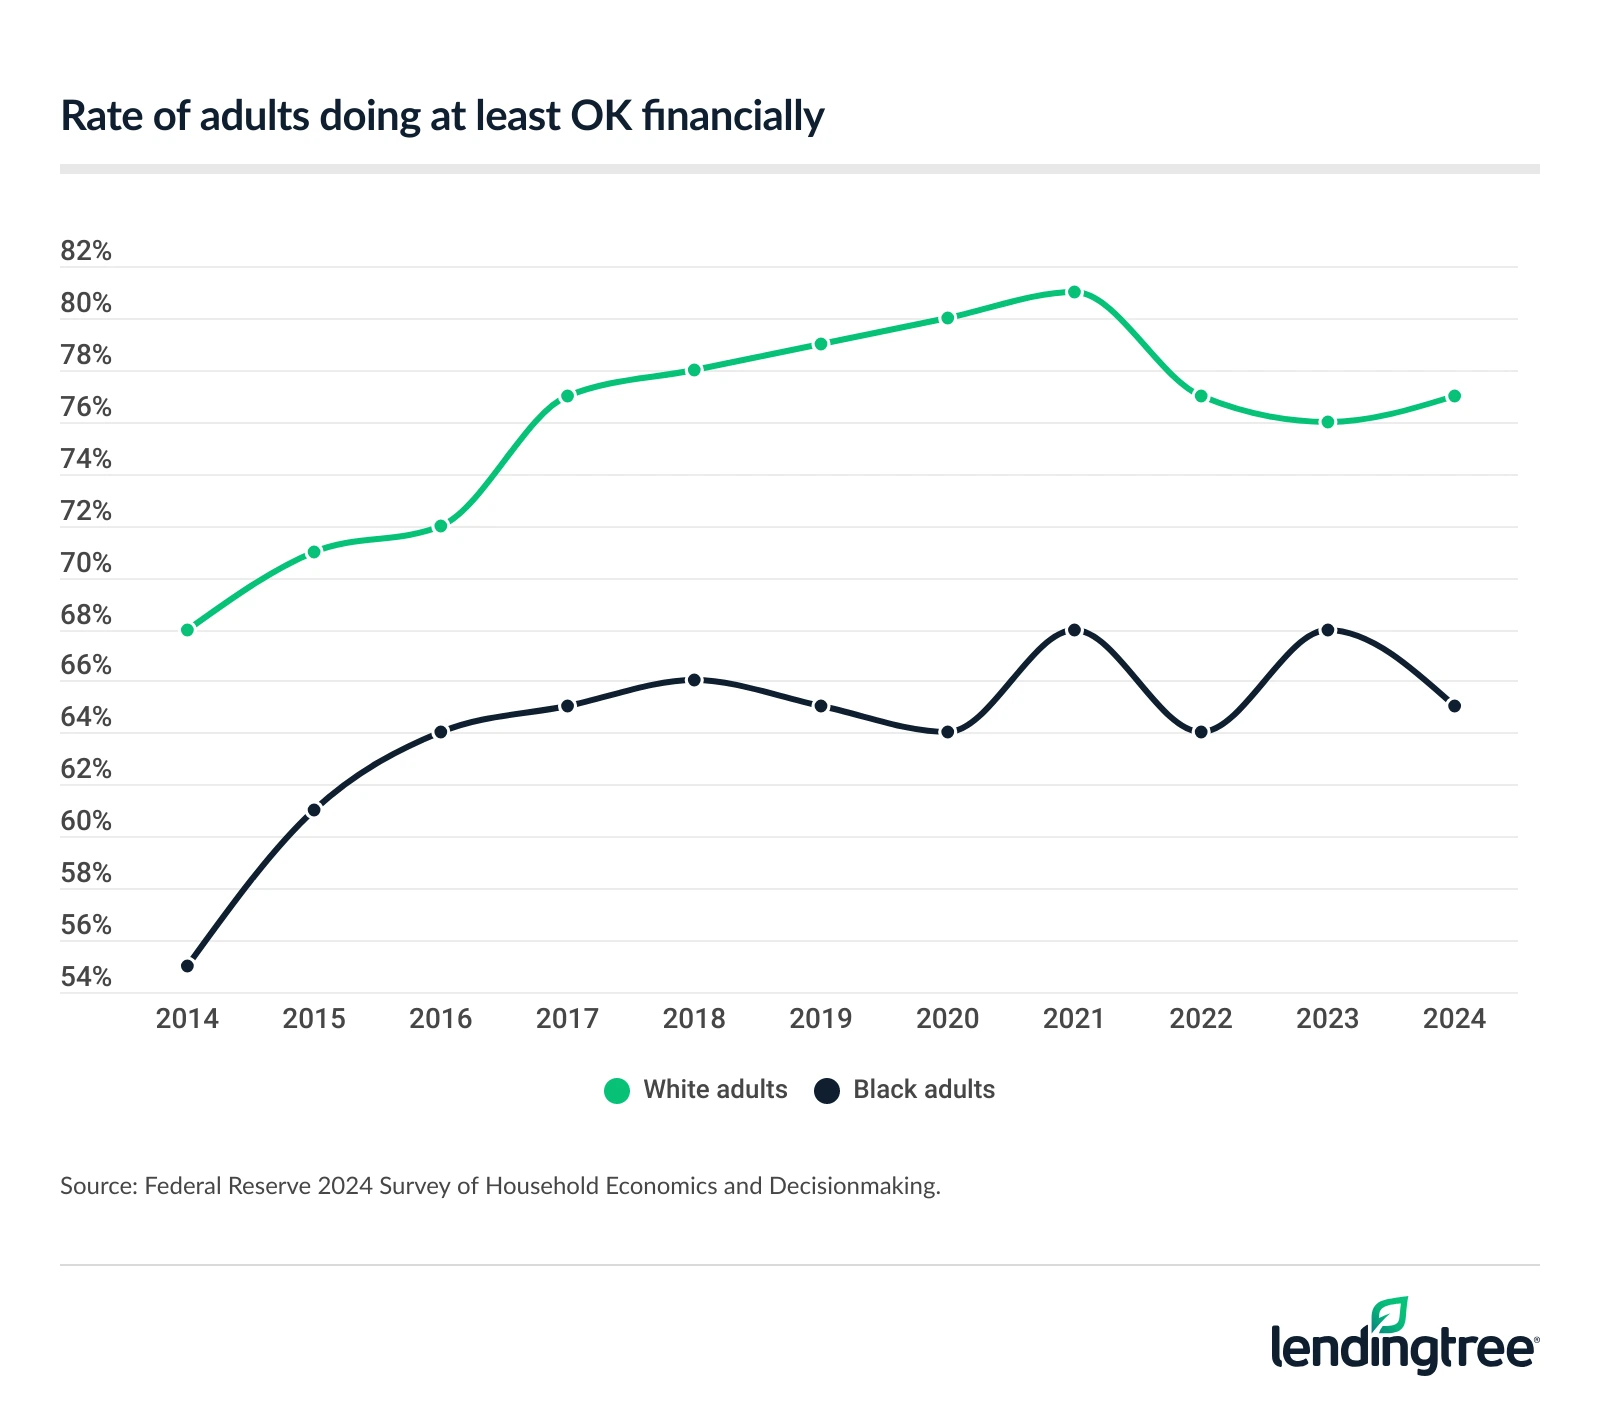
Overall, 65% of Black adults said they were doing OK financially in 2024, according to the Federal Reserve — down from 68% the previous year but up from 55% in 2014. Meanwhile, 77% of white adults said they were OK financially, up from 76% in 2023 and 68% in 2014.
For those looking for a boost despite the tumultuous market, Schulz recommends looking for a high-yield savings account.
“For many years, savings accounts offered minuscule returns,” he says. “That’s no longer the case. Savers can still find accounts with APYs of 4% or higher, though they may need to look beyond traditional megabanks. Recent Fed rate cuts mean the days of earning 5% or more are probably over, and further cuts could push yields down even more. Still, it’s worth taking the time to shop for a high-yield savings account.”
Unemployment
The unemployment rate among Black households was 7.8% in the third quarter of 2025, more than double the rate among white households of 3.8%. (Note: According to the BLS, reliable Q4 2025 estimates couldn’t be produced because October data wasn’t collected due to the federal government shutdown.)
In Q3, the unemployment rate was 8.0% among Black women and 7.5% among Black men.
The Black household unemployment rate — regardless of gender — rose sharply from 6.2% in Q2. Similar increases were seen among Black women (up from 6.2%) and Black men (up from 6.3%).
Credit
In 2024, 51% of Black adults who applied for credit were either denied or approved for less than they requested, according to the Federal Reserve, compared with 26% of white adults.
Credit access gaps extend to card ownership as well: In 2024, 86% of white adults had a credit card, versus 69% of Black adults.
Schulz says income disparities may help explain why Black applicants are more likely to receive lower credit limits.
“As for being approved for less than requested, there’s no question that income levels play a big role,” he says. “While income isn’t factored into your credit score, it’s considered when banks decide how much credit to extend. All else equal, people with higher incomes may receive higher credit limits than those with lower incomes.”
If you’re overwhelmed by debt and struggling to make on-time payments, Schulz suggests consolidating balances with a personal loan.
“Low-interest personal loans can be incredibly helpful,” he says. “They can save you significant money on interest and simplify your finances by allowing you to replace several smaller debts with a single monthly payment.”
Retirement
Just over 1 in 3 (34.8%) Black families had retirement accounts — including 401(k) and individual retirement accounts — in 2022, compared with 61.8% of white families. (Note: The triennial Federal Reserve Survey of Consumer Finances isn’t scheduled for release until late 2026, so most of the data in this section is unchanged from last year’s report.)
Retirement accounts by race
| Median retirement account value | Avg. retirement account value | |||
|---|---|---|---|---|
| Black families | White families | Black families | White families | |
| 1989 | $13,830 | $27,670 | $42,920 | $92,430 |
| 1992 | $11,400 | $31,080 | $40,660 | $98,970 |
| 1995 | $15,480 | $35,030 | $43,200 | $119,490 |
| 1998 | $20,060 | $47,410 | $58,630 | $147,540 |
| 2001 | $14,230 | $58,930 | $53,980 | $196,220 |
| 2004 | $23,570 | $64,420 | $93,840 | $214,870 |
| 2007 | $37,210 | $75,840 | $97,770 | $240,460 |
| 2010 | $24,580 | $73,750 | $72,150 | $264,390 |
| 2013 | $24,180 | $96,740 | $71,670 | $301,160 |
| 2016 | $30,460 | $94,970 | $92,170 | $321,810 |
| 2019 | $40,570 | $92,740 | $126,510 | $341,030 |
| 2022 | $39,000 | $100,000 | $117,530 | $380,330 |
In 2024, just over half of Black nonretired adults (52%) had tax-preferred retirement savings accounts, versus 68% of white nonretired adults.
Sources
- U.S. Census Bureau Current Population Survey (CPS) Annual Social and Economic (ASEC) Supplement
- Federal Reserve Distributional Financial Accounts
- U.S. Census Bureau QuickFacts
- Federal Reserve Board Survey of Household Economics and Decisionmaking (SHED)
- U.S. Bureau of Labor Statistics (BLS)
- Federal Reserve Survey of Consumer Finances
Get debt consolidation loan offers from up to 5 lenders in minutes