As St. Patrick’s Day Approaches, Bar Spending Struggles to Reach Pre-Pandemic Levels


St. Patrick’s Day observes the death of the eponymous patron saint of Ireland, but many Americans spend the holiday bar-hopping and drinking until they’re Irish. In March 2020, as the coronavirus began to spread throughout the country, many St. Patrick’s Day celebrations were canceled. One year later, and the COVID-19 pandemic is likely to put a damper on the booze-fueled holiday once again.
The bar industry hasn’t fully recovered since the coronavirus pandemic began, a new study of 30,000 LendingTree users found. Even in February 2021, the number of people spending money at bars was just 66% of what it was compared to February 2020, before the pandemic began. See what else we found in the analysis below.
Key findings
- St. Patrick’s Day is likely to be affected by decreased bar patronage (again). Last March, the emergence of the coronavirus pandemic canceled many holiday celebrations. Relatedly, the number of bar patrons dropped 27% from March 2019 to March 2020.
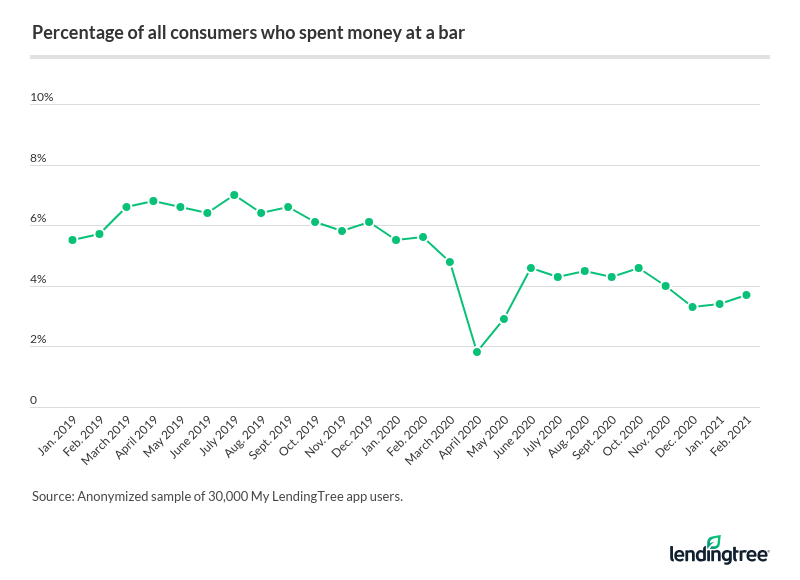
- When COVID-19 first hit, Americans almost completely stopped going to bars. Of all transactions made in April 2020, just 0.05% took place at a bar, more than four times lower than the percentage a year prior.
- People still aren’t visiting bars at pre-pandemic levels. In January and February 2021, 3.4% and 3.7% of people, respectively, visited bars each month, which is lower when compared to January 2020 (5.5%) and February 2020 (5.6%).
- Overall, alcohol spending has increased over the past several years. Americans were spending $445 a year on alcohol in 2013. By 2019, that number had risen 30% to $579.
- Certain metros have higher alcohol spending than others. Of the 22 metros we could track, San Diego residents spend the most proportionally, as alcohol accounts for 1.4% of their annual expenditures. Meanwhile, people who live in the nation’s capital — Washington, D.C. — spend the highest dollar amount on alcohol, at $1,203 annually.
St. Patrick’s Day festivities may be impacted again by COVID-19
Reflecting on the early days of the COVID-19 pandemic, we knew virtually nothing about how the coronavirus spread. Even though the first cases of the disease were reported in Wuhan, China, on Dec. 31, 2019, we wouldn’t have a full picture of the impact of the disease until much later.
In fact, it wasn’t really until last St. Patrick’s Day that the pandemic began to impact our day-to-day lives. On March 15, 2020, shortly before the holiday celebrations could commence, the Centers for Disease Control and Prevention (CDC) issued guidance recommending the cancellation of all events involving 50 or more people.
This reality is present in our data. The percentage of people who spent money at a bar dropped 27% from March 2019 to March 2020:
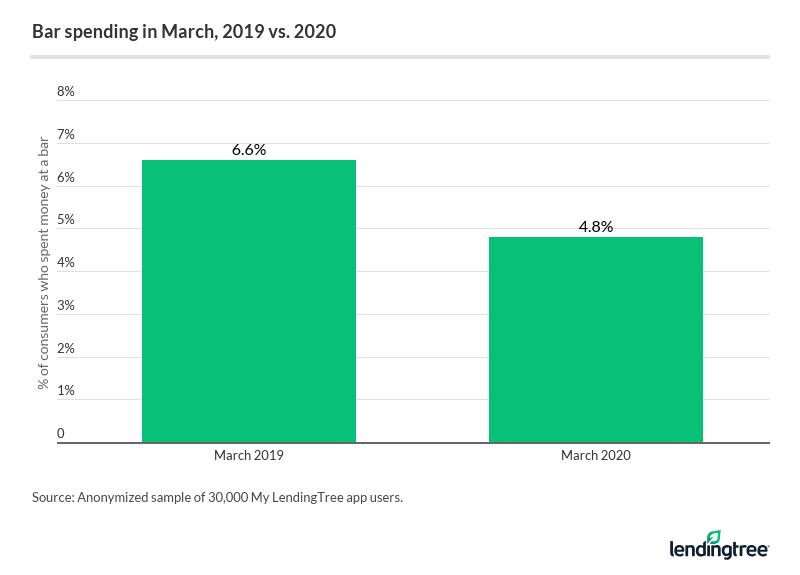
It’s evident by the activity of My LendingTree app users that people didn’t stop going to bars altogether starting in March 2020. Remember that the CDC didn’t issue its guidance until halfway through the month, and the pandemic hadn’t reached all corners of the country by then. However, bar patronage continued to drop, particularly the following month.
The pandemic effectively shut down bars when it first began
Although bar patronage was down year over year in March, it saw the sharpest drop in April 2020, when only 1.8% of consumers made a purchase at a bar — that’s compared with 6.8% the previous April.
Plus, just 0.05% of all transactions made in April 2020 took place at a bar, compared to 0.23% the year prior. See how the pandemic affected bar activity in the graph below:

Bar patronage hasn’t fully recovered since COVID-19 emerged
The coronavirus vaccine rollout has given many people hope that we may soon be on the other side of this pandemic, but recovery is still underway for many industries. Although bars in many states have begun to reopen, they’re only seeing a fraction of their customer base compared to pre-pandemic times, according to our data.
The line graph below shows the staggered recovery of bar patronage, and how My LendingTree app users still aren’t visiting bars at pre-pandemic levels:
The table below shows the drop in the percentage of customers who made a transaction at a bar compared with the same month of the previous year. For example, bar patronage was 56% lower in May 2020 than it was in May 2019.
How much bar patronage dropped relative to a year prior
| March 2020 | 27% |
| April 2020 | 73% |
| May 2020 | 56% |
| June 2020 | 28% |
| July 2020 | 39% |
| August 2020 | 30% |
| September 2020 | 35% |
| October 2020 | 24% |
| November 2020 | 31% |
| December 2020 | 47% |
| January 2021 | 37% |
| February 2021 | 34% |
How alcohol spending has changed over the years
Bar patronage is down year over year due in part to the coronavirus pandemic, but that doesn’t mean people won’t still find a way to have an alcoholic beverage or two this St. Patrick’s Day. But while going out to bars might pose too much of a risk for contracting COVID-19, Americans can still channel the luck of the Irish from the comfort of home.
Overall spending on alcoholic beverages, including alcohol consumed at home, was up 30% from 2013 to 2019 — the latest available data. The average American household spent $579 a year on alcohol in 2019, compared with $445 in 2013.
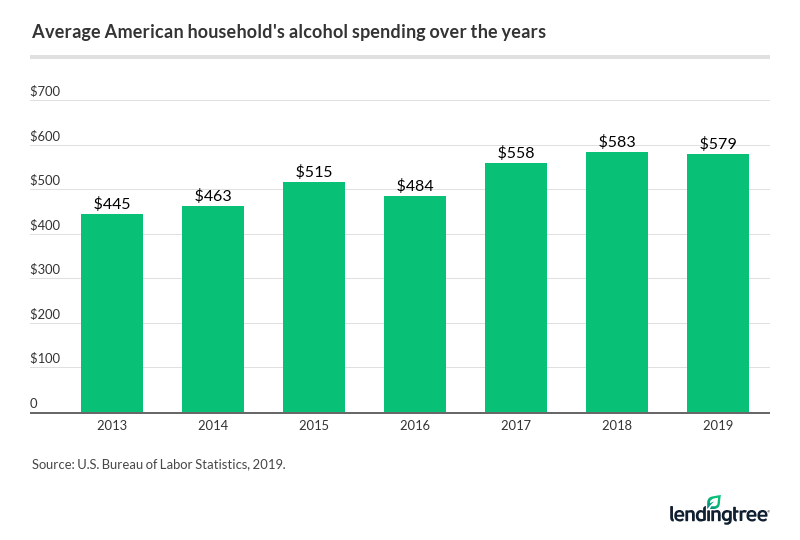
That increase roughly tracks with the increase in household income during this time. Household income as measured by the U.S. Bureau of Labor Statistics Consumer Expenditures Survey is up 27% from 2013 to 2019.
Where consumers spend the most money on alcohol
Alcohol spending is proportionally higher in some metros than it is in others. Of the 22 metro areas included in the Consumer Expenditure Survey data, San Diego spends the most on alcohol relative to their annual expenditures, which includes all expenses such as mortgage or rent, groceries, loans and debt repayment. The average household there spends $1,108 a year on alcohol, equal to 1.4% of total annual spending.
Tampa, Fla., households also dedicate 1.4% of their budget toward alcoholic beverages, though the dollar amount is just $811. Tampa’s lower cost of living and — therefore — annual expenditures explains this.
In contrast, the average household in Houston or Baltimore dedicates just 0.6% of their budget to alcohol. See how alcohol spending compares in different metro areas in the map below:
When you simply look at total dollar spending, residents of Washington, D.C., are spending the most on alcohol each year, at $1,203 as of 2019. However, because of differences in cost of living and annual expenditures, they’re actually spending less proportionally than San Diego residents, at 1.3%.
Where people spend the most and least on alcohol, in dollar amounts
| Highest spending | Lowest spending | ||
|---|---|---|---|
| Washington, D.C. | $1,203 | Houston | $450 |
| Minneapolis | $1,112 | Baltimore | $476 |
| San Diego | $1,108 | Miami | $510 |
Methodology
LendingTree researchers analyzed a sample of more than 30,000 LendingTree users to estimate the number of people who spend money at bars each month. Specifically, we looked at the total number of people spending money at bars and compared it to the total sample of people spending each month.
Researchers also compared alcohol spending over time and by metro. Alcohol spending data is from 2019 and comes from the Bureau of Labor Statistics.
Get debt consolidation loan offers from up to 5 lenders in minutes