LendingTree Finds Google Searches for ‘Homes for Sale’ Rebounding From 2020 Lows
Since the start of the COVID-19 crisis, millions of Americans have modified their spending habits, with many putting their home-shopping plans on hold. However, as states begin to reopen and stay-at-home orders expire, some potential homebuyers may be more eager to resume their house hunt.
One way to gauge people’s interest in purchasing homes is to measure internet searches, especially because many homebuyers start the homebuying process online. With that in mind, LendingTree analyzed Google search data to see how popular the search term “homes for sale” is in 50 of the nation’s largest metros. Google defines search popularity using what LendingTree calls “search-interest values.” These values exist on a scale of 0 to 100; 100 means the search term is at peak popularity.
LendingTree found that searches for the term “homes for sale” have increased from their 2020 lows in each metro featured in this study. Furthermore, interest in the term also rose from March to April in all but one metro.
Key findings
- Searches for “homes for sale” have increased from their 2020 lows in each metro featured in this study. The average lowest search-interest value in 2020 for all 50 metros was about 56. By the end of April, that number grew by 54%, to 86.
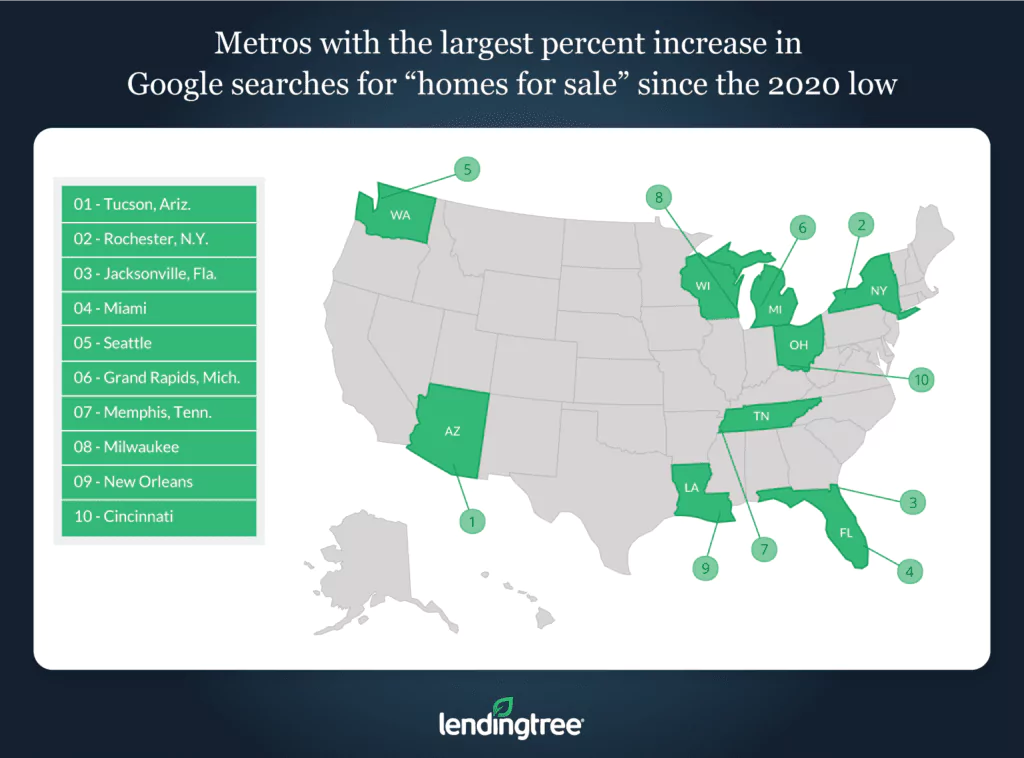
- Tucson, Ariz., Rochester, N.Y. and Jacksonville, Fla., have seen the largest increases in search interest since their lowest points this year. On average, the search-interest values in these areas spiked 126.57% from their 2020 lows, bringing their search-interest values up to 90, 81 and 100, respectively.
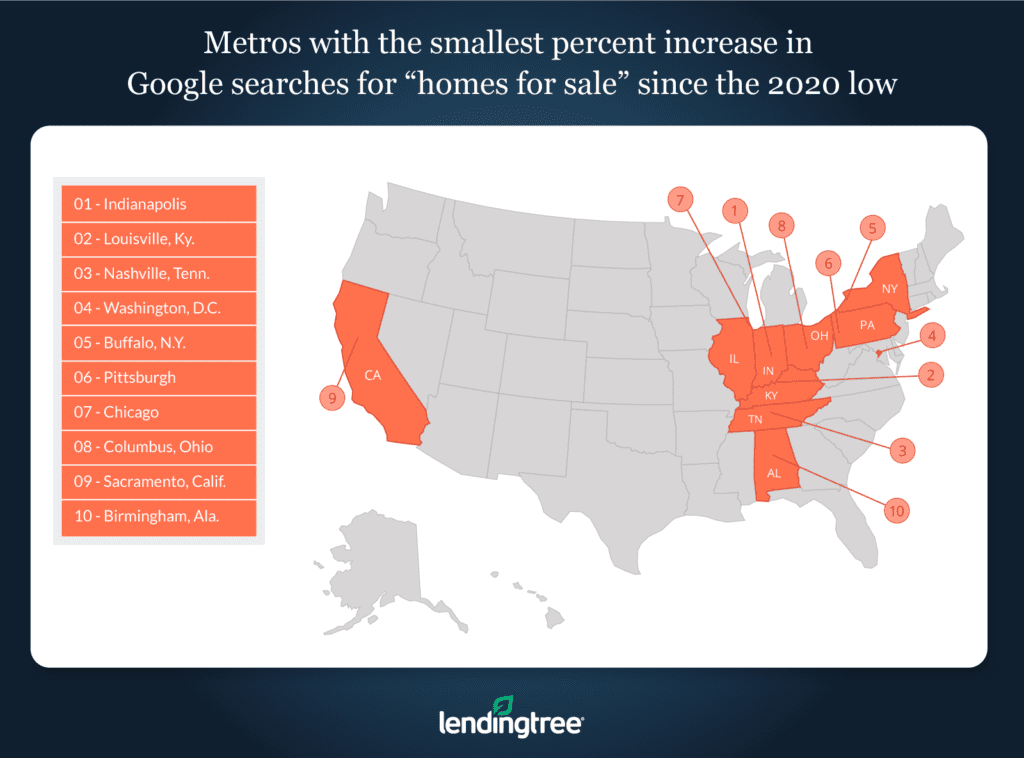
- Indianapolis, Louisville, Ky. and Nashville, Tenn., have seen the smallest growth in searches since their low points this year. In these three metros, the popularity of the search term rose by only 17.60% from its lowest value, resulting in current search-interest values of 63, 65 and 78, respectively.
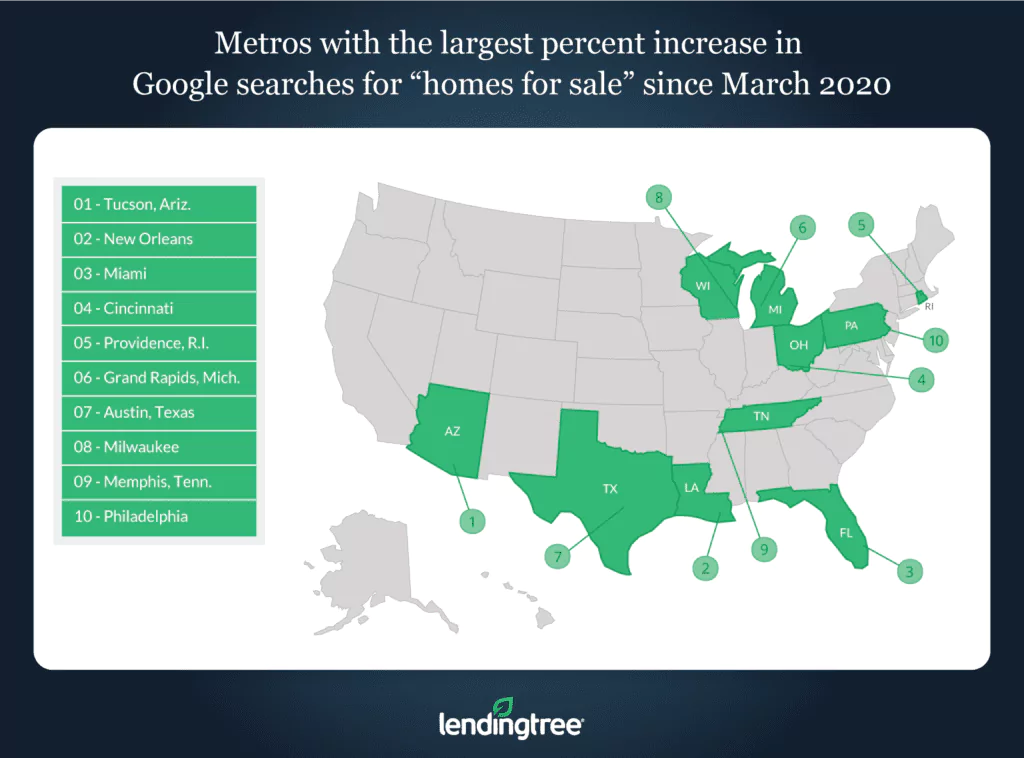
- Tucson, Ariz., New Orleans and Miami are the metros with the largest month-over-month search growth. Search-interest values in these metros grew an average of 84.46% from the end of March to the end of April.
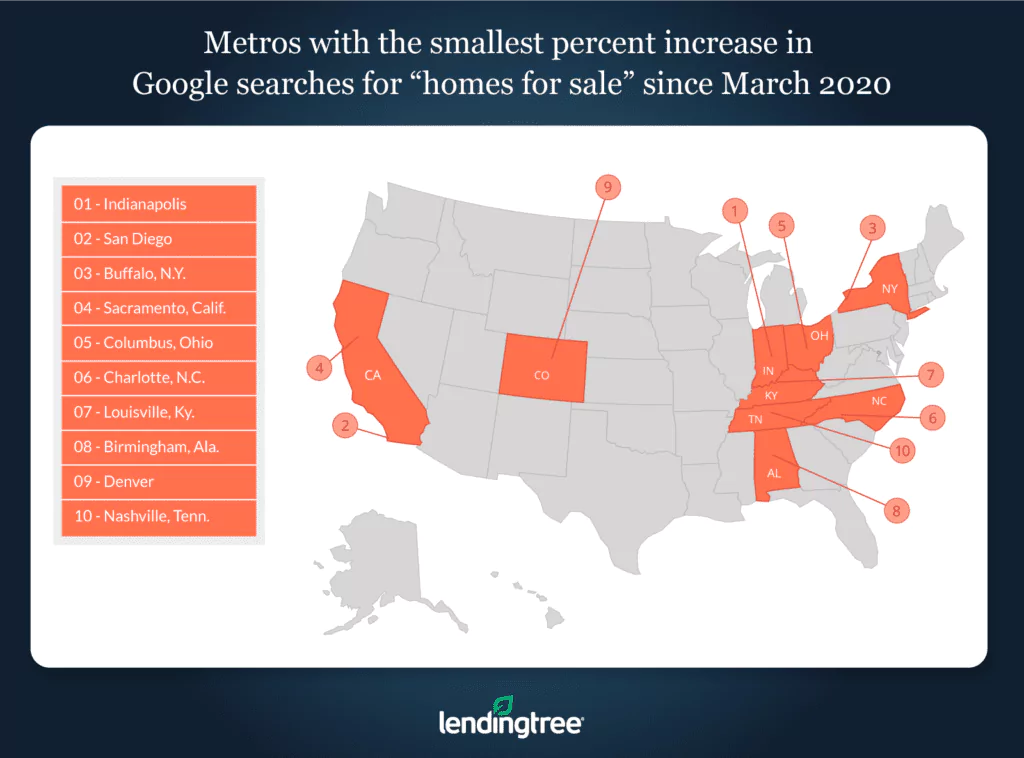
- Indianapolis, San Diego and Buffalo, N.Y., saw the smallest month-over-month gain in searches from March to April. While San Diego and Buffalo saw modest increases, Indianapolis is the only metro featured in this study to see a decline in search-interest values, with the month-over-month search-interest value down by 1.56%, from 64 to 63.
Metros with largest percentage increase in Google searches for ‘homes for sale’ since 2020 low
No. 1: Tucson, Ariz.
- End of April 2020 search-interest value: 90
- 2020 search-interest value low: 34
- Percentage increase in search-interest value from 2020 low to end of April: 164.71%
No. 2: Rochester, N.Y.
- End of April 2020 search-interest value: 81
- 2020 search-interest value low: 37
- Percentage increase in search-interest value from 2020 low to end of April: 118.92%
No. 3: Jacksonville, Fla.
- End of April 2020 search-interest value: 100
- 2020 search-interest value low: 51
- Percentage increase in search-interest value from 2020 low to end of April: 96.08%
Metros with smallest percentage increase in Google searches for ‘homes for sale’ since 2020 low
No. 1: Indianapolis
- End of April 2020 search-interest value: 63
- 2020 search-interest value low: 58
- Percentage increase in search-interest value from 2020 low to end of April: 8.62%
No. 2: Louisville, Ky.
- End of April 2020 search-interest value: 65
- 2020 search-interest value low: 54
- Percentage increase in search-interest value from 2020 low to end of April: 20.37%
No. 3: Nashville, Tenn.
- End of April 2020 search-interest value: 78
- 2020 search-interest value low: 63
- Percentage increase in search-interest value from 2020 low to end of April: 23.81%
Metros with largest percentage increase in Google searches for ‘homes for sale’ since March 2020
No. 1: Tucson, Ariz.
- End of April 2020 search-interest value: 90
- End of March 2020 search-interest value: 42
- Percentage increase in search-interest value from March to April: 114.29%
No. 2: New Orleans
- End of April 2020 search-interest value: 100
- End of March 2020 search-interest value: 58
- Percentage increase in search-interest value from March to April: 72.41%
No. 3: Miami
- End of April 2020 search-interest value: 100
- End of March 2020 search-interest value: 60
- Percentage increase in search-interest value from March to April: 66.67%
Metros with smallest percentage increase in Google searches for ‘homes for sale’ since March 2020
No. 1: Indianapolis
- End of April 2020 search-interest value: 63
- End of March 2020 search-interest value: 64
- Percentage increase in search-interest value from March to April: -1.56%
No. 2: San Diego
- End of April 2020 search-interest value: 81
- End of March 2020 search-interest value: 80
- Percentage increase in search-interest value from March to April: 1.25%
No. 3: Buffalo, N.Y.
- End of April 2020 search-interest value: 54
- End of March 2020 search-interest value: 52
- Percentage increase in search-interest value from March to April: 3.85%
Methodology
The data for this piece comes from Google Trends. The “search-interest numbers/values” are defined by Google in the following way: “Numbers represent search interest relative to the highest point on the chart for the given region and time. A value of 100 is the peak popularity for the term. A value of 50 means that the term is half as popular. A score of 0 means there was not enough data for this term.”
The search-interest value at the end of April is defined as the search-interest value for the week beginning on April 26, 2020, while the value at the end of March is defined as the search-interest value for the week beginning March 29, 2020.
LendingTree research analyst Jacob Channel contributed to this study.
View mortgage loan offers from up to 5 lenders in minutes