Metros Where Homeowners Stay Put the Longest
A lack of housing supply has been a persistent challenge for homebuyers since the financial crisis. As the supply of affordable homes dwindles, prices tend to rise as would-be buyers compete for a smaller number of homes in a given area. Although low mortgage rates could help offset some of the burden that higher prices bring, some homeowners may not be able to move up from their current homes.
LendingTree analyzed data from the U.S. Census Bureau to determine where people are staying put the longest in the nation’s 50 largest metropolitan areas. In general, we found that homeowners in the Northeast tend to stay in their homes the longest while homeowners in warmer areas move more often.
Additionally, our study found that there’s an inverse relationship between home price and the length of time people stay in their homes. In other words, prices rise more quickly when people stay in their homes for shorter time periods.
Key findings
- Metros where people stay in their homes the longest have seen significantly less home-value appreciation than metros where people stay in their homes for shorter periods of time. Home values in the 10 metros with the longest housing tenure appreciated an average of 8.7% from 2015 to 2018. Over that same period, home values appreciated an average of 24.3% in the 10 metros with the shortest housing tenure.
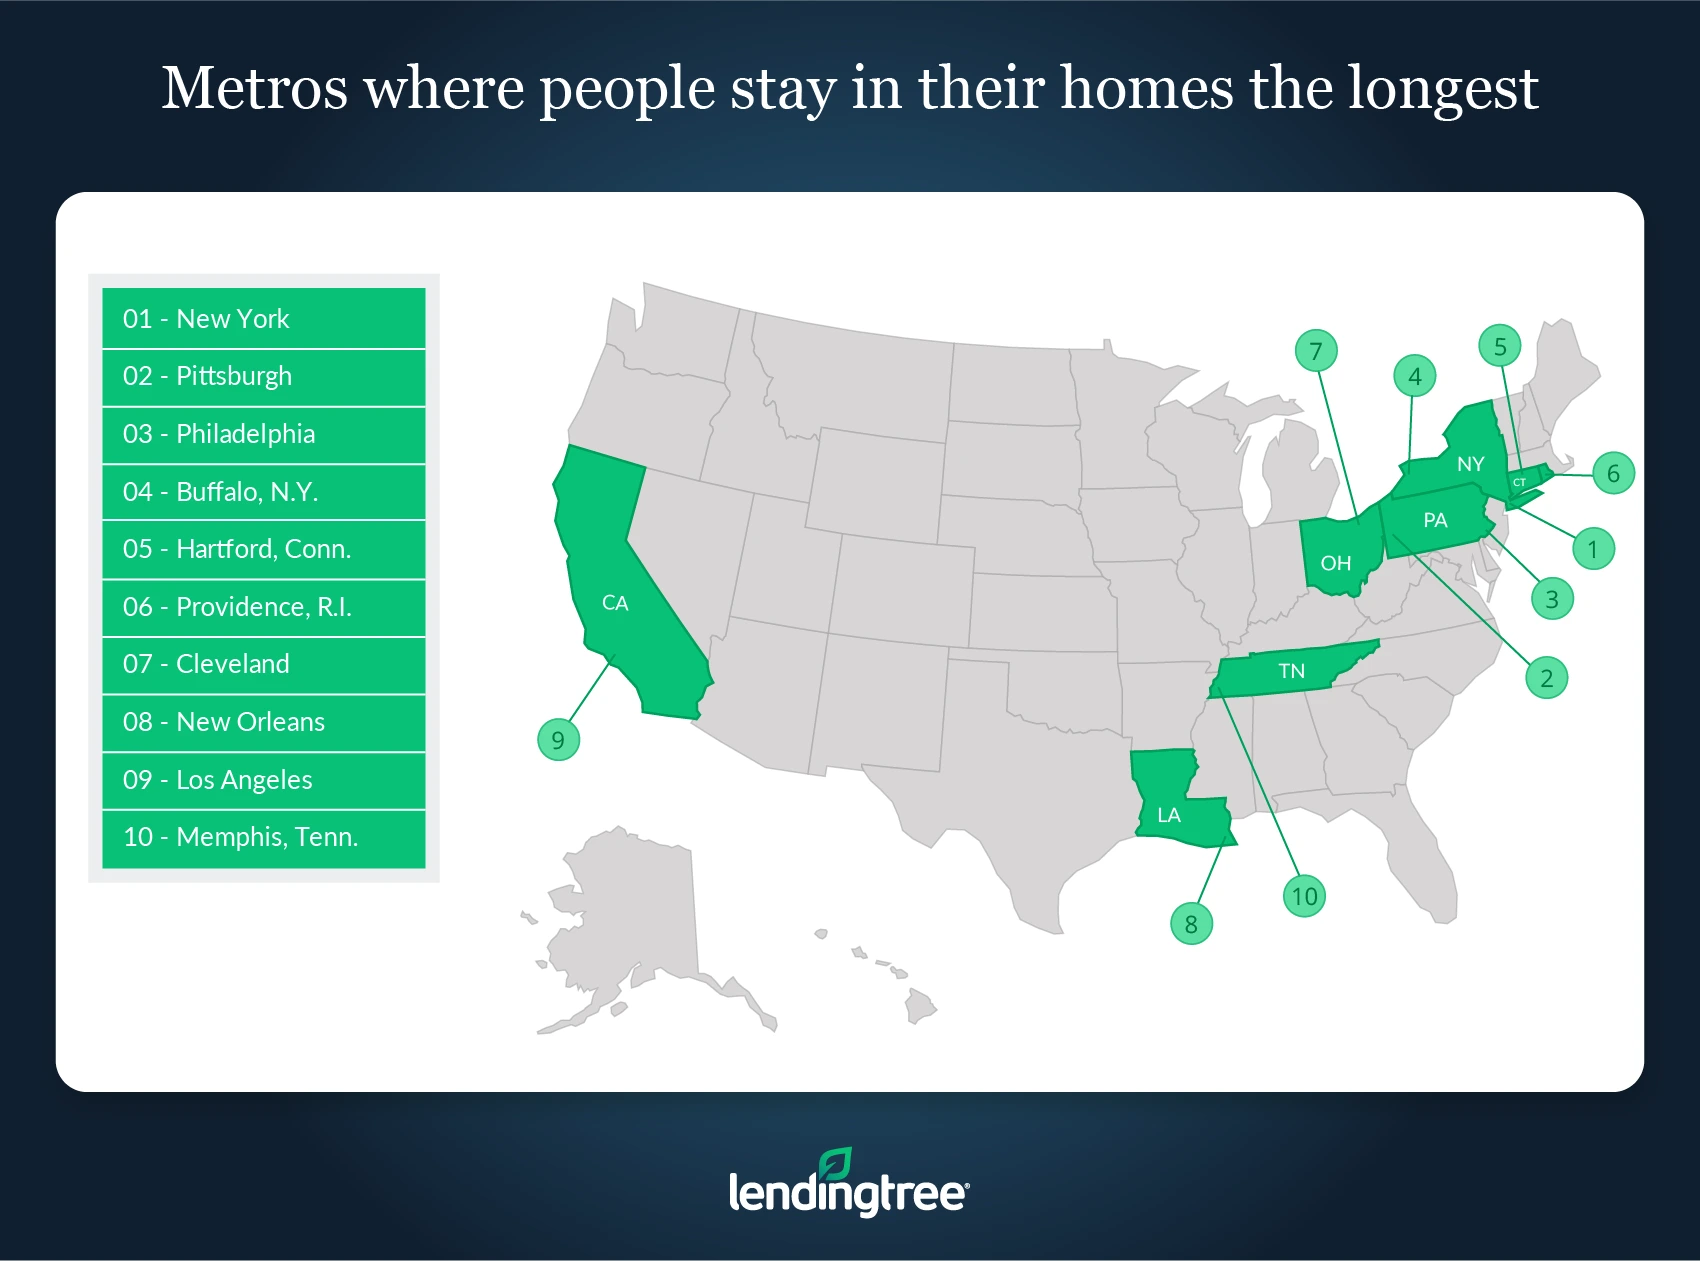
- New York, Pittsburgh and Philadelphia are the three metros where homeowners stay put the longest. In these metros, homeowners live in their homes for an average of 8.6 years. Two additional metros located in the Northeast — Buffalo, N.Y. and Hartford, Conn. — round out the top five metros where people stay in their homes the longest.
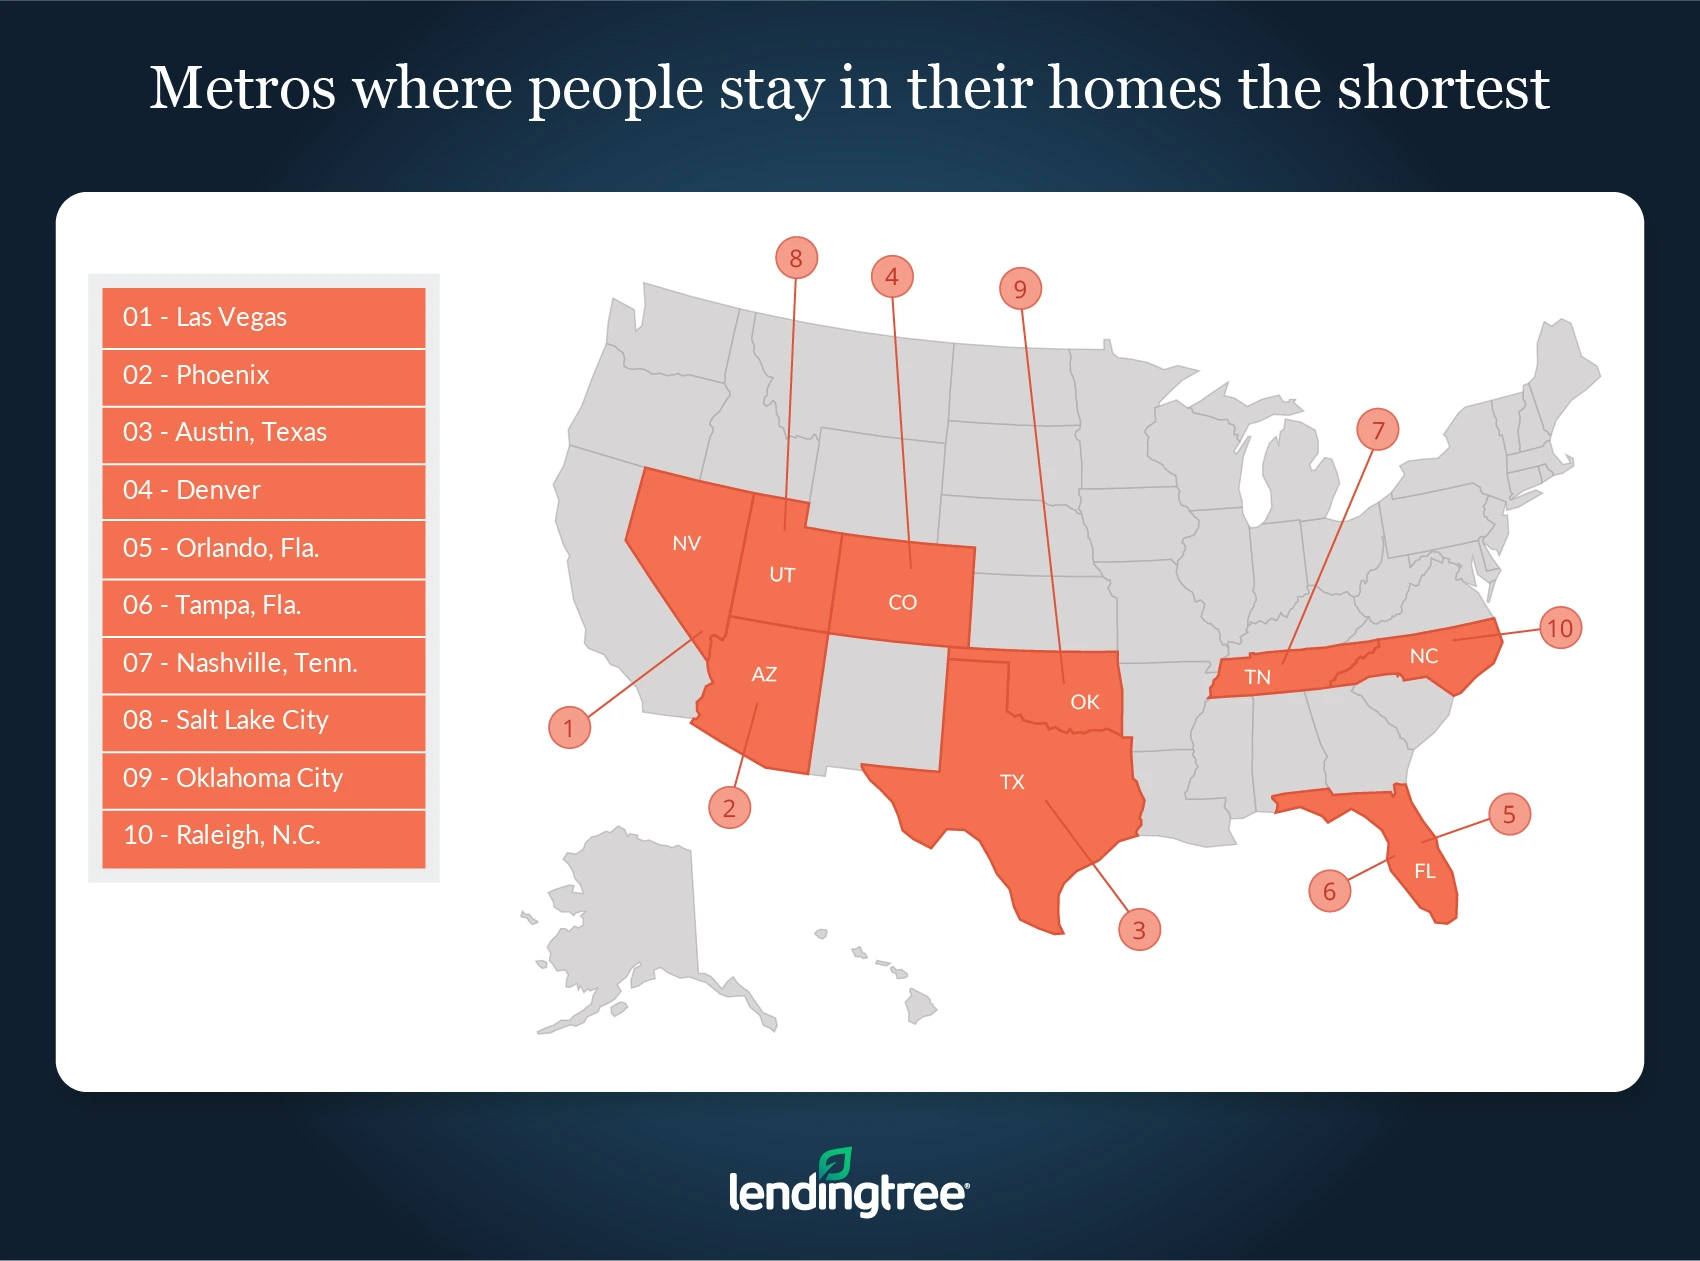
- Las Vegas, Phoenix and Austin, Texas are the metros with the shortest tenure among homeowners. Homeowners in these metros tend to move after an average of 7.5 years.
- In general, metros that are warm year-round tend to see shorter housing tenures, while metros with more variety in their weather see longer housing tenures. There are some exceptions to this rule: Denver has one of the shortest average housing tenures in our study, while Los Angeles has one of the longest.
Metros where people stay in their homes the longest
No. 1: New York City
- Average housing tenure: 8.65 years
- Median home value: $426,100
- 3-year home-value appreciation: 6.8%
No. 2: Pittsburgh
- Average housing tenure: 8.64 years
- Median home value: $148,000
- 3-year home-value appreciation: 11.7%
No. 3: Philadelphia
- Average housing tenure: 8.63 years
- Median home value: 245,000
- 3-year home-value appreciation: 3.6%
No. 4: Buffalo, N.Y.
- Average housing tenure: 8.64 years
- Median home value: $148,000
- 3-year home-value appreciation: 11.7%
No. 5: Hartford, Conn.
- Average housing tenure: 8.59 years
- Median home value: $246,600
- 3-year home-value appreciation: 0.7%
Metros where people stay in their homes the shortest
No. 1: Las Vegas
- Average housing tenure: 7.44 years
- Median home value: $238,300
- 3-year home-value appreciation: 39.8%
No. 2: Phoenix
- Average housing tenure: 7.53 years
- Median home value: $234,300
- 3-year home-value appreciation: 30.8%
No. 3: Austin, Texas
- Average housing tenure: 7.57 years
- Median home value: $261,400
- 3-year home-value appreciation: 25.3%
No. 4: Denver
- Average housing tenure: 7.73 years
- Median home value: $350,500
- 3-year home-value appreciation: 31.3%
No. 5: Orlando, Fla.
- Average housing tenure: 7.78 years
- Median home value: $201,600
- 3-year home-value appreciation: 27.7%
Methodology
The data used in this piece comes from the U.S. Census Bureau’s 2018 American Community Survey With 5-Year Estimates (the latest survey available at the time of publication.)
To calculate home value appreciation, we took the median home value in 2018, subtracted it by the median home value in 2015 then divided the difference by the median home value in 2015. Finally, we multiplied that number by 100 to get the value as a percentage.
LendingTree research analyst Jacob Channel contributed to this report.
View mortgage loan offers from up to 5 lenders in minutes