One At-Fault Accident Can Add Thousands to Drivers’ Insurance Costs — Here’s Where It Hurts Most


One mistake behind the wheel can stick with you long after the repairs are done.
In LendingTree’s analysis, an at-fault accident that results in at least $2,000 in property damage raises full coverage premiums by 45.0% on average. That’s about $1,031 more per year, or roughly $3,093 over three years. And the pain isn’t evenly spread: Some states and age groups see far bigger jumps than others.
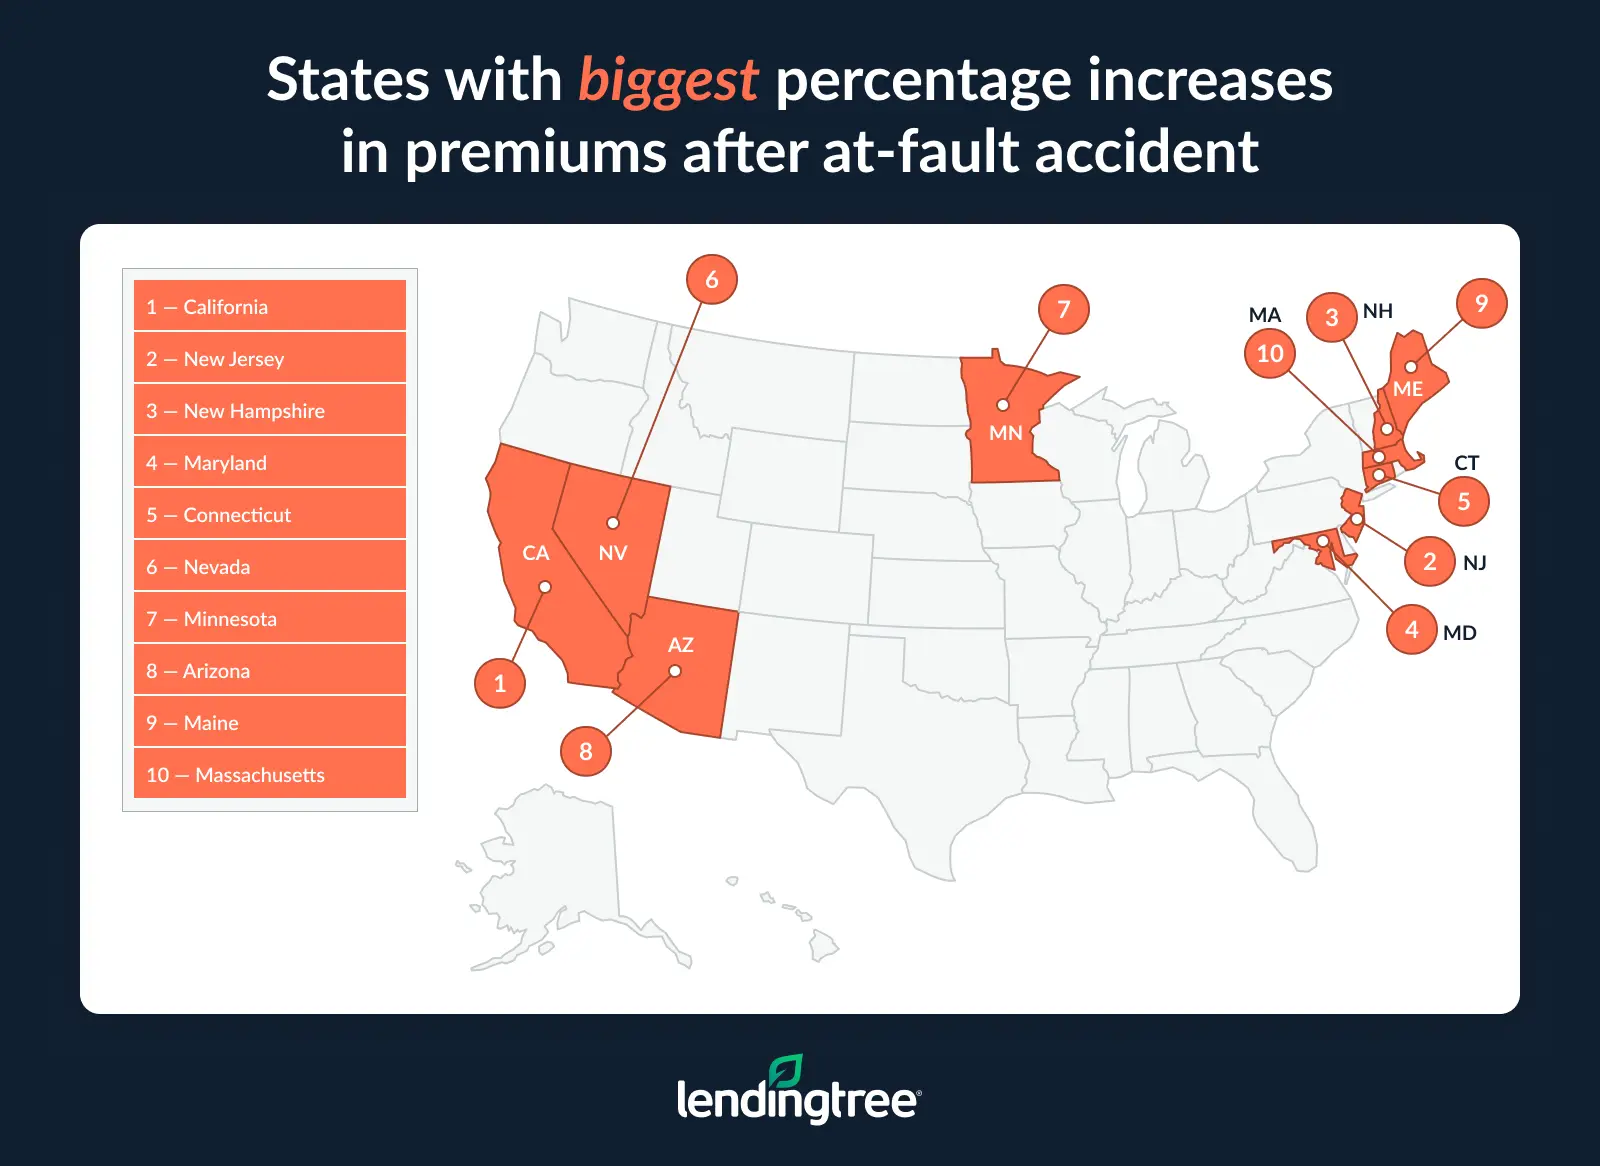
- Auto insurance premiums increase by an average of 45.0% nationwide after an at-fault accident causing at least $2,000 in property damage. By percentage, rates after an at-fault accident rise the most in California, surging 70.7% from $2,382.91 to $4,066.73. New Jersey (62.7%) and New Hampshire (60.5%) follow closely.
- An at-fault accident increases a driver’s three-year insurance costs by thousands of dollars nationwide. After an accident, premiums across the U.S. rise by an average of $85.91 a month, $1,030.95 annually or $3,092.84 over three years.
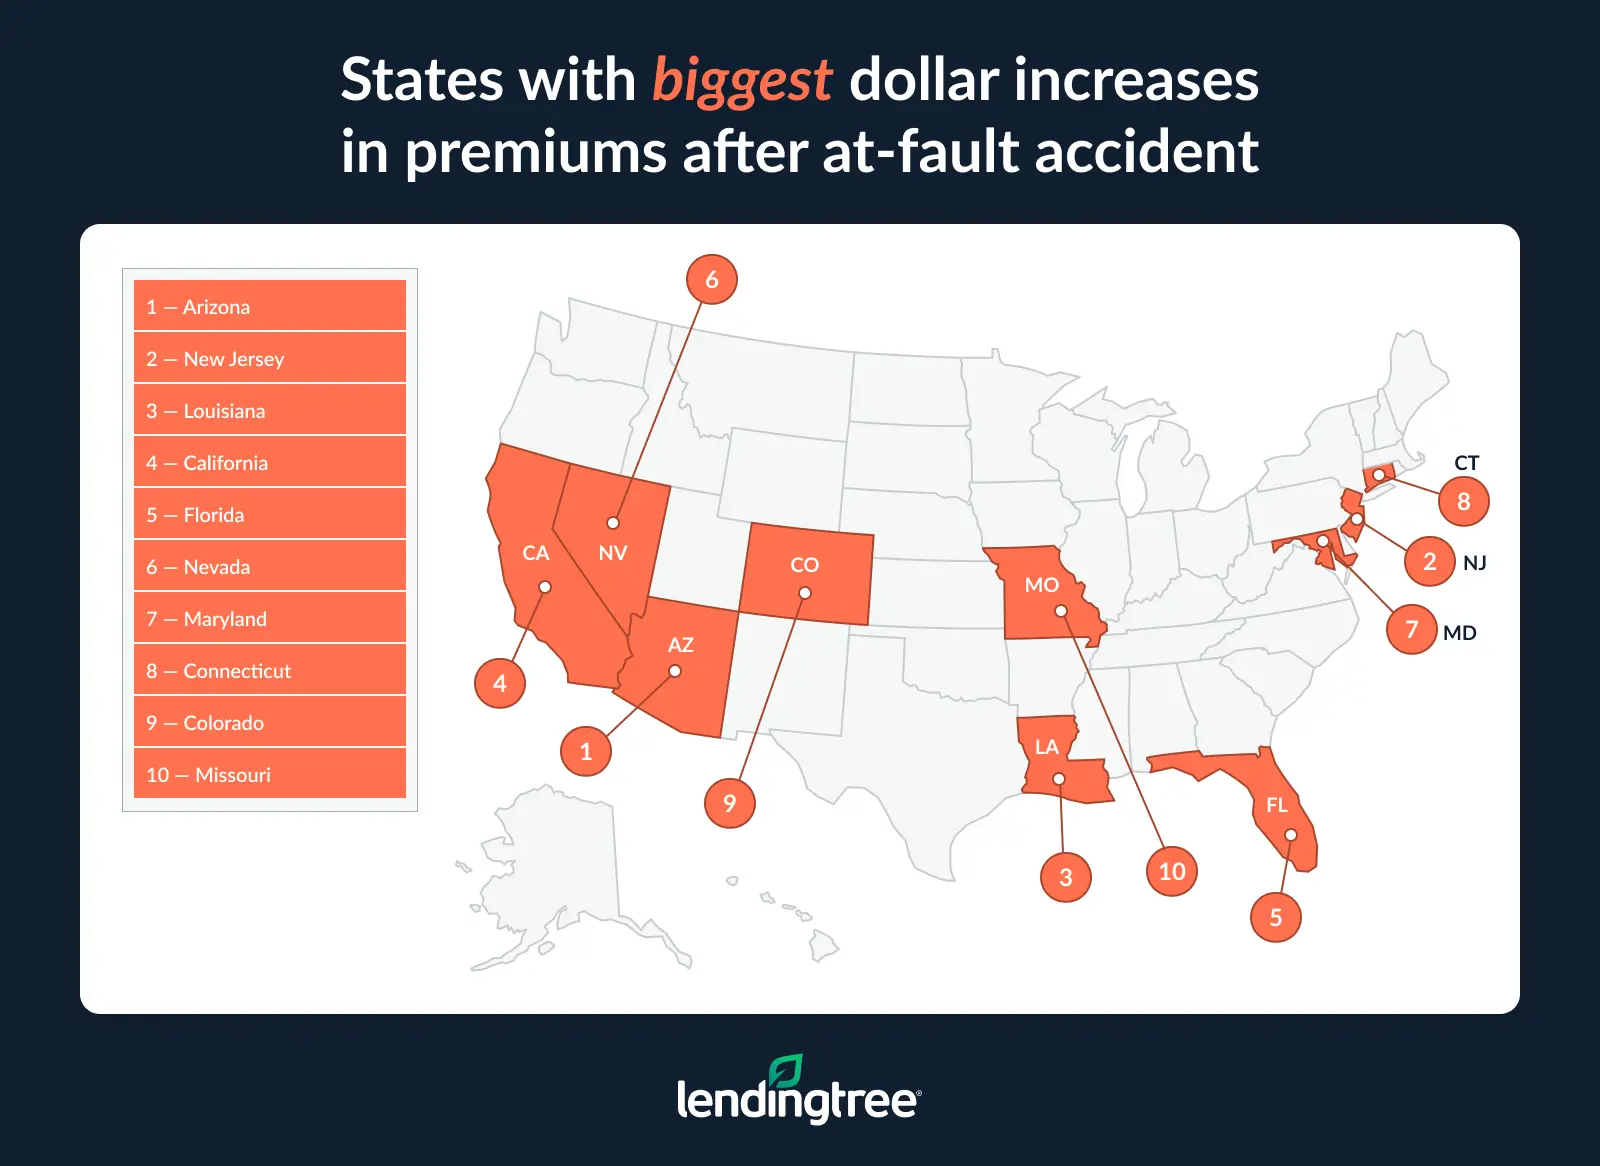
- Arizona and New Jersey see the largest dollar increases in auto insurance costs after an at-fault accident, with annual premiums rising by about $2,000 or more. Arizona drivers see costs increase by $2,091.75, followed closely by New Jersey at $1,999.64. In contrast, Pennsylvania ($351.60), Wyoming ($419.17) and North Carolina ($499.33) are the only states where annual increases are below $500.
- Younger drivers face the steepest dollar increases after an at-fault accident, even though older drivers see larger percentage increases. Because younger drivers start with higher premiums, a 20-year-old pays an average of $2,024 more a year after an accident, compared with about $1,072 annually for drivers in their 50s and 60s.
Drivers pay 45.0% more on average after an at-fault accident
Drivers nationwide can expect their car insurance premiums to jump by an average of 45.0% after filing an at-fault accident claim of $2,000 or more.
The national average premium for full coverage car insurance currently stands at $2,277.15. After an at-fault accident, premiums shoot up by over $1,000 to $3,308.10.
Drivers in California, New Jersey and New Hampshire face the steepest post-accident hikes. In these states, rates rise 70.7%, 62.7% and 60.5%, respectively.
These steep increases help explain a previous LendingTree survey, which found that roughly 4 in 10 insured drivers who’ve been in a car accident or incident have chosen to pay for repairs without going through insurance. Among those drivers, 42% said they avoided filing a claim because they didn’t want their premiums to rise.
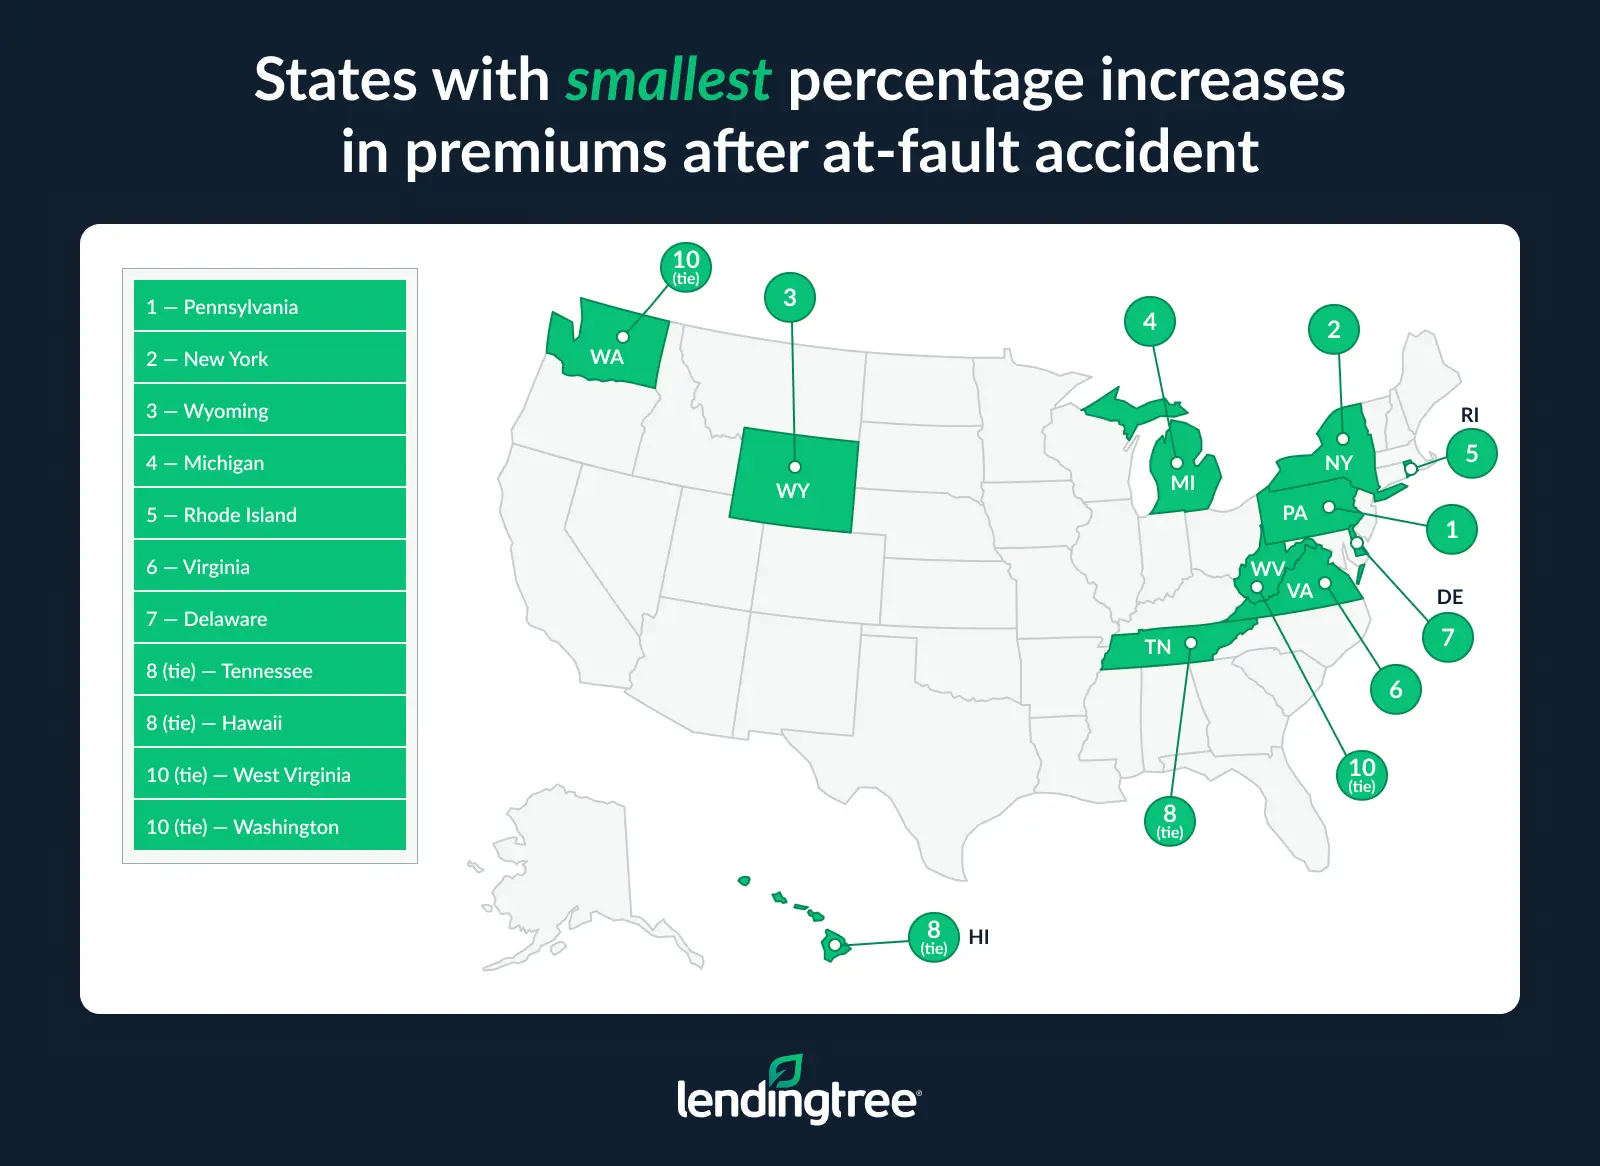
Not all states are as unlucky. Pennsylvania premiums only rise by 16.5% after an at-fault accident claim. Not only does Pennsylvania experience the smallest percentage increase after an at-fault accident, but also the smallest annual premium increase, at $351.60.
Full rankings: States with biggest percentage change in auto insurance premiums after at-fault accident
| Rank | State | Avg. annual premium before | Avg. annual premium after | % increase |
|---|---|---|---|---|
| 1 | California | $2,382.91 | $4,066.73 | 70.7% |
| 2 | New Jersey | $3,188.46 | $5,188.09 | 62.7% |
| 3 | New Hampshire | $1,531.30 | $2,457.40 | 60.5% |
| 4 | Maryland | $2,536.33 | $4,065.11 | 60.3% |
| 5 | Connecticut | $2,711.90 | $4,238.30 | 56.3% |
| 6 | Nevada | $2,782.85 | $4,334.85 | 55.8% |
| 7 | Minnesota | $2,256.33 | $3,513.67 | 55.7% |
| 8 | Arizona | $3,819.67 | $5,911.42 | 54.8% |
| 9 | Maine | $1,245.60 | $1,921.40 | 54.3% |
| 10 | Massachusetts | $1,710.15 | $2,637.69 | 54.2% |
| 11 | Idaho | $1,630.18 | $2,511.09 | 54.0% |
| 12 | Illinois | $2,114.67 | $3,247.42 | 53.6% |
| 13 | South Dakota | $1,997.50 | $3,048.75 | 52.6% |
| 14 | Utah | $2,219.70 | $3,384.90 | 52.5% |
| 15 | Kentucky | $2,237.73 | $3,404.73 | 52.2% |
| 16 | Missouri | $2,559.00 | $3,844.00 | 50.2% |
| 17 | Wisconsin | $1,867.25 | $2,760.75 | 47.9% |
| 18 | Mississippi | $2,106.91 | $3,114.18 | 47.8% |
| 19 | Oregon | $2,146.46 | $3,164.91 | 47.4% |
| 20 | Louisiana | $4,005.50 | $5,881.00 | 46.8% |
| 21 | Indiana | $1,703.82 | $2,497.64 | 46.6% |
| 22 | Georgia | $2,696.14 | $3,946.86 | 46.4% |
| 23 | Florida | $3,411.14 | $4,983.14 | 46.1% |
| 23 | Texas | $2,635.50 | $3,851.50 | 46.1% |
| 25 | Vermont | $1,345.40 | $1,958.60 | 45.6% |
| 26 | Alaska | $1,862.33 | $2,697.17 | 44.8% |
| 27 | Ohio | $1,677.82 | $2,421.27 | 44.3% |
| 28 | Kansas | $2,391.08 | $3,418.62 | 43.0% |
| 29 | Arkansas | $2,771.85 | $3,952.62 | 42.6% |
| 30 | Colorado | $3,289.00 | $4,686.38 | 42.5% |
| 31 | District of Columbia | $2,886.40 | $4,084.40 | 41.5% |
| 32 | Alabama | $2,117.00 | $2,993.91 | 41.4% |
| 32 | Oklahoma | $2,284.80 | $3,231.40 | 41.4% |
| 34 | North Carolina | $1,212.11 | $1,711.44 | 41.2% |
| 35 | Iowa | $2,015.62 | $2,841.54 | 41.0% |
| 36 | Nebraska | $2,250.58 | $3,169.25 | 40.8% |
| 36 | New Mexico | $2,363.29 | $3,328.43 | 40.8% |
| 38 | Montana | $2,365.86 | $3,275.86 | 38.5% |
| 39 | North Dakota | $1,944.36 | $2,686.64 | 38.2% |
| 40 | South Carolina | $1,947.11 | $2,672.44 | 37.3% |
| 41 | Washington | $2,616.18 | $3,586.73 | 37.1% |
| 41 | West Virginia | $1,705.78 | $2,338.78 | 37.1% |
| 43 | Hawaii | $1,562.71 | $2,134.29 | 36.6% |
| 43 | Tennessee | $1,943.27 | $2,654.82 | 36.6% |
| 45 | Delaware | $2,945.56 | $4,020.89 | 36.5% |
| 46 | Virginia | $1,718.50 | $2,335.20 | 35.9% |
| 47 | Rhode Island | $2,898.33 | $3,877.56 | 33.8% |
| 48 | Michigan | $2,460.60 | $3,243.00 | 31.8% |
| 49 | Wyoming | $1,323.00 | $1,742.17 | 31.7% |
| 50 | New York | $2,609.50 | $3,192.80 | 22.4% |
| 51 | Pennsylvania | $2,129.60 | $2,481.20 | 16.5% |
We asked LendingTree auto insurance expert and licensed insurance agent Rob Bhatt why the same accident can have a different effect on premiums, depending on the state in which the driver is insured.
“Insurance companies generally follow the math. They compare the amounts they spend on claims for risky drivers and adjust rates accordingly. Several factors cause these costs to vary by state.
“Some states have higher crash rates, and some have more expensive costs for medical treatment and car repairs. These are just some of the factors that affect how much it costs to insure drivers with prior accidents — and how much these drivers get charged.”
What does that mean for drivers? Where you live can change how much an at-fault accident affects your rate.
In states where claims tend to be more common and/or more expensive, insurers may view any at-fault crash as a bigger increase in risk. The resulting premium hike can be larger than it would be in a lower-claim, lower-cost state.
This is bad news for a riskier state like California, where — unrelated to car insurance — a LendingTree survey also found debt payments were the highest.
One at-fault crash can raise premiums by $1,000, on average
Almost 60% of insured drivers say that car insurance premiums are a burden, with 22% calling it a large one. An at-fault accident’s impact could further tighten the squeeze.
Nationwide, an at-fault accident results in an average jump of about $86 a month, leading to an annual increase of $1,030.95. But the costs don’t stop there.
At-fault accidents typically impact car insurance premiums for three to five years. That means that just one at-fault accident could cost nearly $3,100 in total, assuming the accident affects the policy for three years.
On a state and annual level, Arizona experiences the highest dollar increase after an at-fault accident ($2,092). New Jersey ($1,999.64) and Louisiana ($1,875.50) aren’t far behind.
Perhaps not coincidentally, an earlier study conducted by LendingTree found that Louisiana is ranked as the third most expensive state for car ownership, with the fourth most expensive insurance premiums.
On the flip side, premiums tick up by an average of $351.60 per year in Pennsylvania ($29.30 monthly). Wyoming experiences the second-lowest increase, with an average jump of $419.17. North Carolina is the only other state under $500, at $499.33 annually.
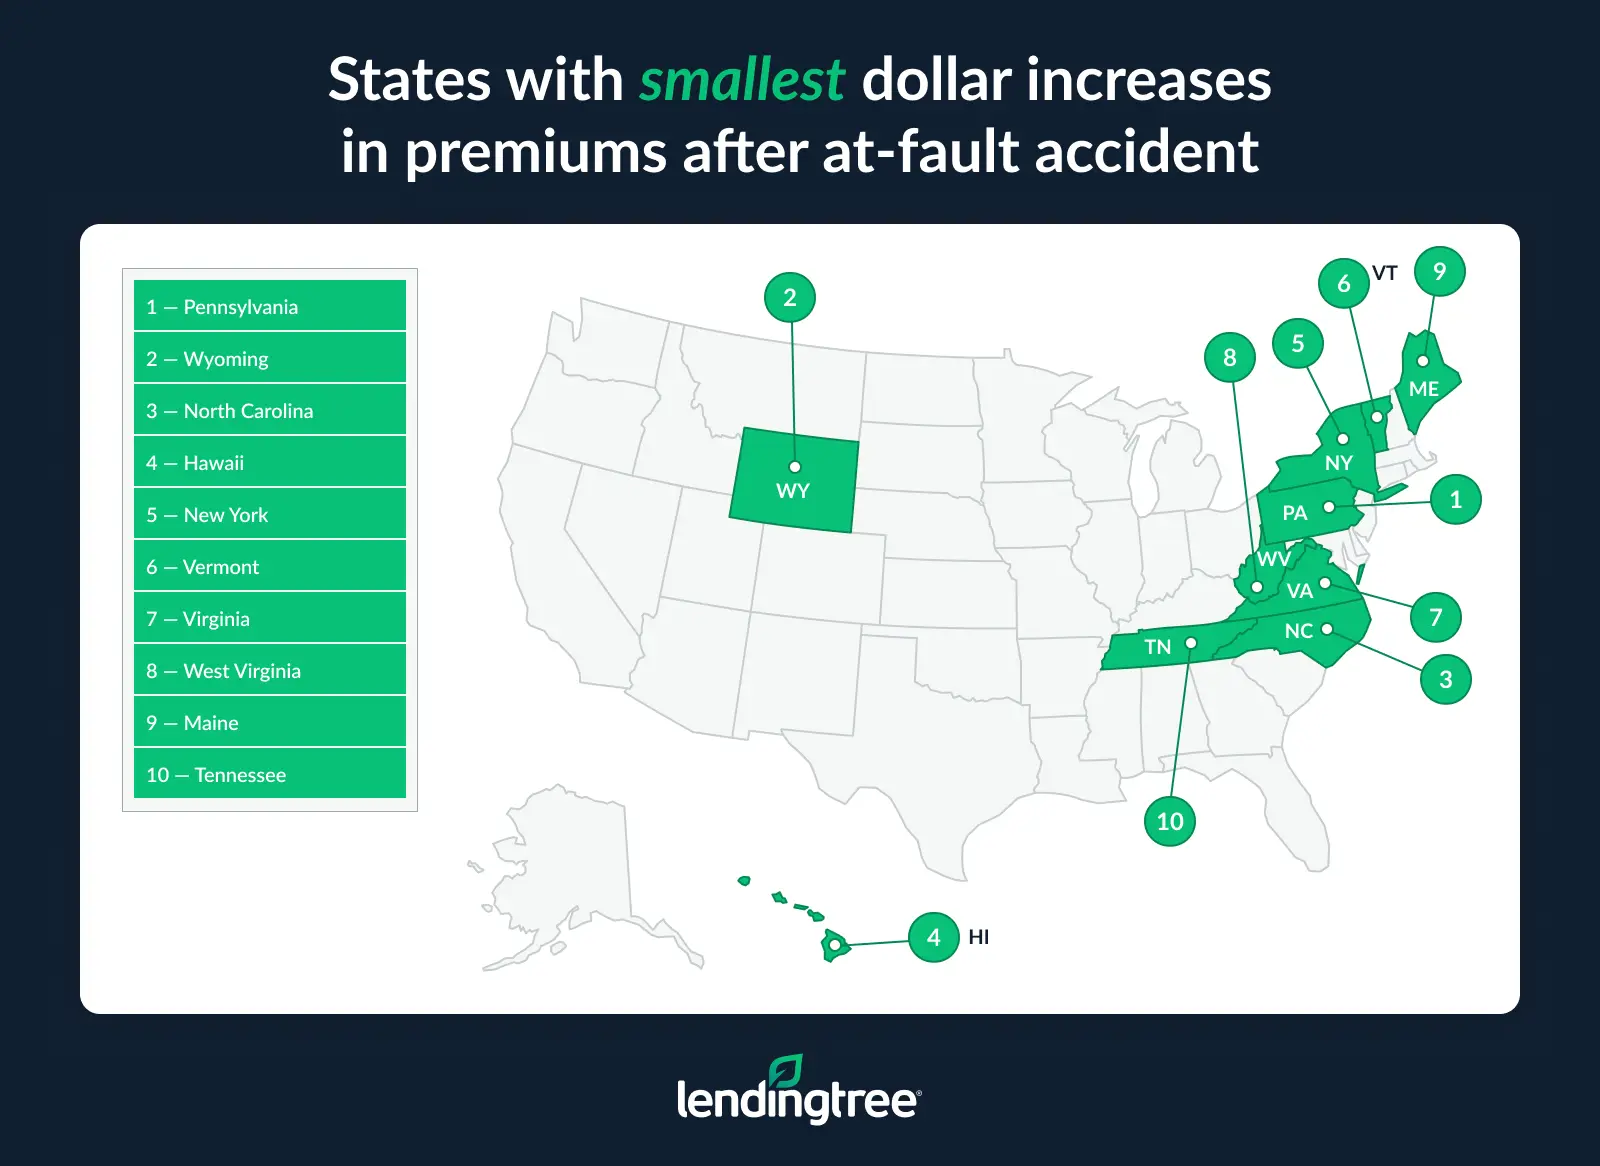
Full rankings: States with biggest dollar increases in auto insurance premiums after at-fault accident
| Rank | State | Monthly increase after | Annual increase after | 3-year increase after |
|---|---|---|---|---|
| 1 | Arizona | $174.31 | $2,091.75 | $6,275.25 |
| 2 | New Jersey | $166.64 | $1,999.64 | $5,998.92 |
| 3 | Louisiana | $156.29 | $1,875.50 | $5,626.50 |
| 4 | California | $140.32 | $1,683.82 | $5,051.46 |
| 5 | Florida | $131.00 | $1,572.00 | $4,716.00 |
| 6 | Nevada | $129.33 | $1,552.00 | $4,656.00 |
| 7 | Maryland | $127.40 | $1,528.78 | $4,586.34 |
| 8 | Connecticut | $127.20 | $1,526.40 | $4,579.20 |
| 9 | Colorado | $116.45 | $1,397.38 | $4,192.14 |
| 10 | Missouri | $107.08 | $1,285.00 | $3,855.00 |
| 11 | Minnesota | $104.78 | $1,257.33 | $3,771.99 |
| 12 | Georgia | $104.23 | $1,250.71 | $3,752.13 |
| 13 | Texas | $101.33 | $1,216.00 | $3,648.00 |
| 14 | District of Columbia | $99.83 | $1,198.00 | $3,594.00 |
| 15 | Arkansas | $98.40 | $1,180.77 | $3,542.31 |
| 16 | Kentucky | $97.25 | $1,167.00 | $3,501.00 |
| 17 | Utah | $97.10 | $1,165.20 | $3,495.60 |
| 18 | Illinois | $94.40 | $1,132.75 | $3,398.25 |
| 19 | Delaware | $89.61 | $1,075.33 | $3,225.99 |
| 20 | South Dakota | $87.60 | $1,051.25 | $3,153.75 |
| 21 | Kansas | $85.63 | $1,027.54 | $3,082.62 |
| 22 | Oregon | $84.87 | $1,018.45 | $3,055.35 |
| 23 | Mississippi | $83.94 | $1,007.27 | $3,021.81 |
| 24 | Rhode Island | $81.60 | $979.22 | $2,937.66 |
| 25 | Washington | $80.88 | $970.55 | $2,911.65 |
| 26 | New Mexico | $80.43 | $965.14 | $2,895.42 |
| 27 | Oklahoma | $78.88 | $946.60 | $2,839.80 |
| 28 | Massachusetts | $77.30 | $927.54 | $2,782.62 |
| 29 | New Hampshire | $77.18 | $926.10 | $2,778.30 |
| 30 | Nebraska | $76.56 | $918.67 | $2,756.01 |
| 31 | Montana | $75.83 | $910.00 | $2,730.00 |
| 32 | Wisconsin | $74.46 | $893.50 | $2,680.50 |
| 33 | Idaho | $73.41 | $880.91 | $2,642.73 |
| 34 | Alabama | $73.08 | $876.91 | $2,630.73 |
| 35 | Alaska | $69.57 | $834.83 | $2,504.49 |
| 36 | Iowa | $68.83 | $825.92 | $2,477.76 |
| 37 | Indiana | $66.15 | $793.82 | $2,381.46 |
| 38 | Michigan | $65.20 | $782.40 | $2,347.20 |
| 39 | Ohio | $61.96 | $743.46 | $2,230.38 |
| 40 | North Dakota | $61.86 | $742.27 | $2,226.81 |
| 41 | South Carolina | $60.44 | $725.33 | $2,175.99 |
| 42 | Tennessee | $59.30 | $711.55 | $2,134.65 |
| 43 | Maine | $56.32 | $675.80 | $2,027.40 |
| 44 | West Virginia | $52.75 | $633.00 | $1,899.00 |
| 45 | Virginia | $51.39 | $616.70 | $1,850.10 |
| 46 | Vermont | $51.10 | $613.20 | $1,839.60 |
| 47 | New York | $48.61 | $583.30 | $1,749.90 |
| 48 | Hawaii | $47.63 | $571.57 | $1,714.71 |
| 49 | North Carolina | $41.61 | $499.33 | $1,497.99 |
| 50 | Wyoming | $34.93 | $419.17 | $1,257.51 |
| 51 | Pennsylvania | $29.30 | $351.60 | $1,054.80 |
Older drivers see the biggest rate hikes, but younger drivers pay more
The older the driver, the bigger the premium increase after an at-fault accident. At least, when it comes to percentages. A 50-year-old driver experiences a hike of around 58%. The average 20-year-old driver sees an increase of 49%.
Lower overall premiums help explain the bigger percentage jump: The same dollar increase looks larger when it’s applied to a lower base premium. When measured in dollars, younger drivers take the worst financial beating.
According to an earlier LendingTree study, Gen Zers are the worst drivers — they pay the highest premiums after an at-fault accident, too. After an at-fault accident, premiums for 20-year-old drivers rise by more than $2,000 a year. For a 50-year-old, the dollar hit is smaller at $1,073.
Change in auto insurance premiums after at-fault accident by age
| Age | Avg. annual premium before | Avg. annual premium after | % increase | $ difference |
|---|---|---|---|---|
| 20 | $4,112 | $6,136 | 49.2% | $2,024 |
| 30 | $2,115 | $3,247 | 53.5% | $1,132 |
| 40 | $1,976 | $3,074 | 55.6% | $1,098 |
| 50 | $1,864 | $2,937 | 57.6% | $1,073 |
| 60 | $1,791 | $2,862 | 59.8% | $1,071 |
| 70 | $2,024 | $3,280 | 62.1% | $1,256 |
| 80 | $2,625 | $4,258 | 62.2% | $1,633 |
Recovering from an at-fault accident: Expert tips
Between insurance hikes, deductibles and other out-of-pocket expenses, at-fault accidents aren’t cheap. We asked Bhatt for ways that drivers could help lower costs now and in the future. He recommends:
- Consider paying out of pocket if the damage is minor: It’s often worth covering minor repairs from an at-fault accident out of your own pocket, instead of using insurance. If you bump into a wall or light post, consider paying for the repairs yourself to keep a claim off your insurance record.
- Shop around (but not necessarily immediately): Your rates usually don’t go up after an accident until your next renewal. It’s a good time to compare quotes from other companies once you know how much your new premium will be, including the accident.
- Consider accident forgiveness for the future: With accident forgiveness, your first at-fault accident won’t make your rate go up. You have to add it to your policy before an accident, and it’s not available from every company. You also usually have to avoid claims for a few years to qualify. Some companies give it to you for free. Others charge a small fee, usually less than $20 a month.
Methodology
LendingTree uses insurance rate data from Quadrant Information Services based on publicly sourced insurance company filings. Rates reflect an analysis of hundreds of thousands of car insurance quotes for a typical driver and are intended for comparative purposes only. Your rates may vary based on factors such as location, driving history, age, credit profile and insurer.
Unless otherwise noted, quotes represent a full coverage policy for a 30-year-old man with good credit and a clean driving record who drives a 2018 Honda CR-V EX. Rates were compared before and after the driver was involved in an at-fault accident that caused $2,000 or more in property damage to illustrate the impact on insurance premiums. Data was collected in January 2026.
The $2,000-plus property range was selected based on findings from the Insurance Information Institute’s “Facts + Statistics: Auto Insurance,” which show that property damage claim severity has risen sharply over the past decade, climbing from about $3,600 in 2015 to nearly $6,800 in 2024, reflecting higher vehicle repair costs, labor expenses and parts prices.
We also used the same methodology to analyze how the impact of an at-fault accident varies by driver age before and after the accident.
Minimum liability policies include only the state’s required minimum coverage limits.
Full coverage policies include collision, comprehensive and liability coverage with the following limits and deductibles:
- Bodily injury liability: $50,000 per person and $100,000 per accident
- Property damage liability: $50,000
- Uninsured and underinsured motorist bodily injury: $50,000 per person and $100,000 per accident
- Personal injury protection: Minimum limits, where required by law
- Collision: $500 deductible
- Comprehensive: $500 deductible