Worst Cities for Drunken Driving


Driving under the influence — a crime also known as DUI — is a major public safety concern throughout the country. Yet depending on where you live, the risk of encountering a drunken driver could be higher or lower.
To better understand where DUIs occur most often and what factors might drive those trends, LendingTree turned to the data. By analyzing QuoteWizard by LendingTree quotes from the 50 largest U.S. cities, we learned that Omaha has the highest DUI rate — and that three of the top five cities for DUIs are in California.
We also looked at DUI rates by age group and vehicle make, as well as auto insurance premium increases after a DUI conviction. Read on for the full findings.
Key findings
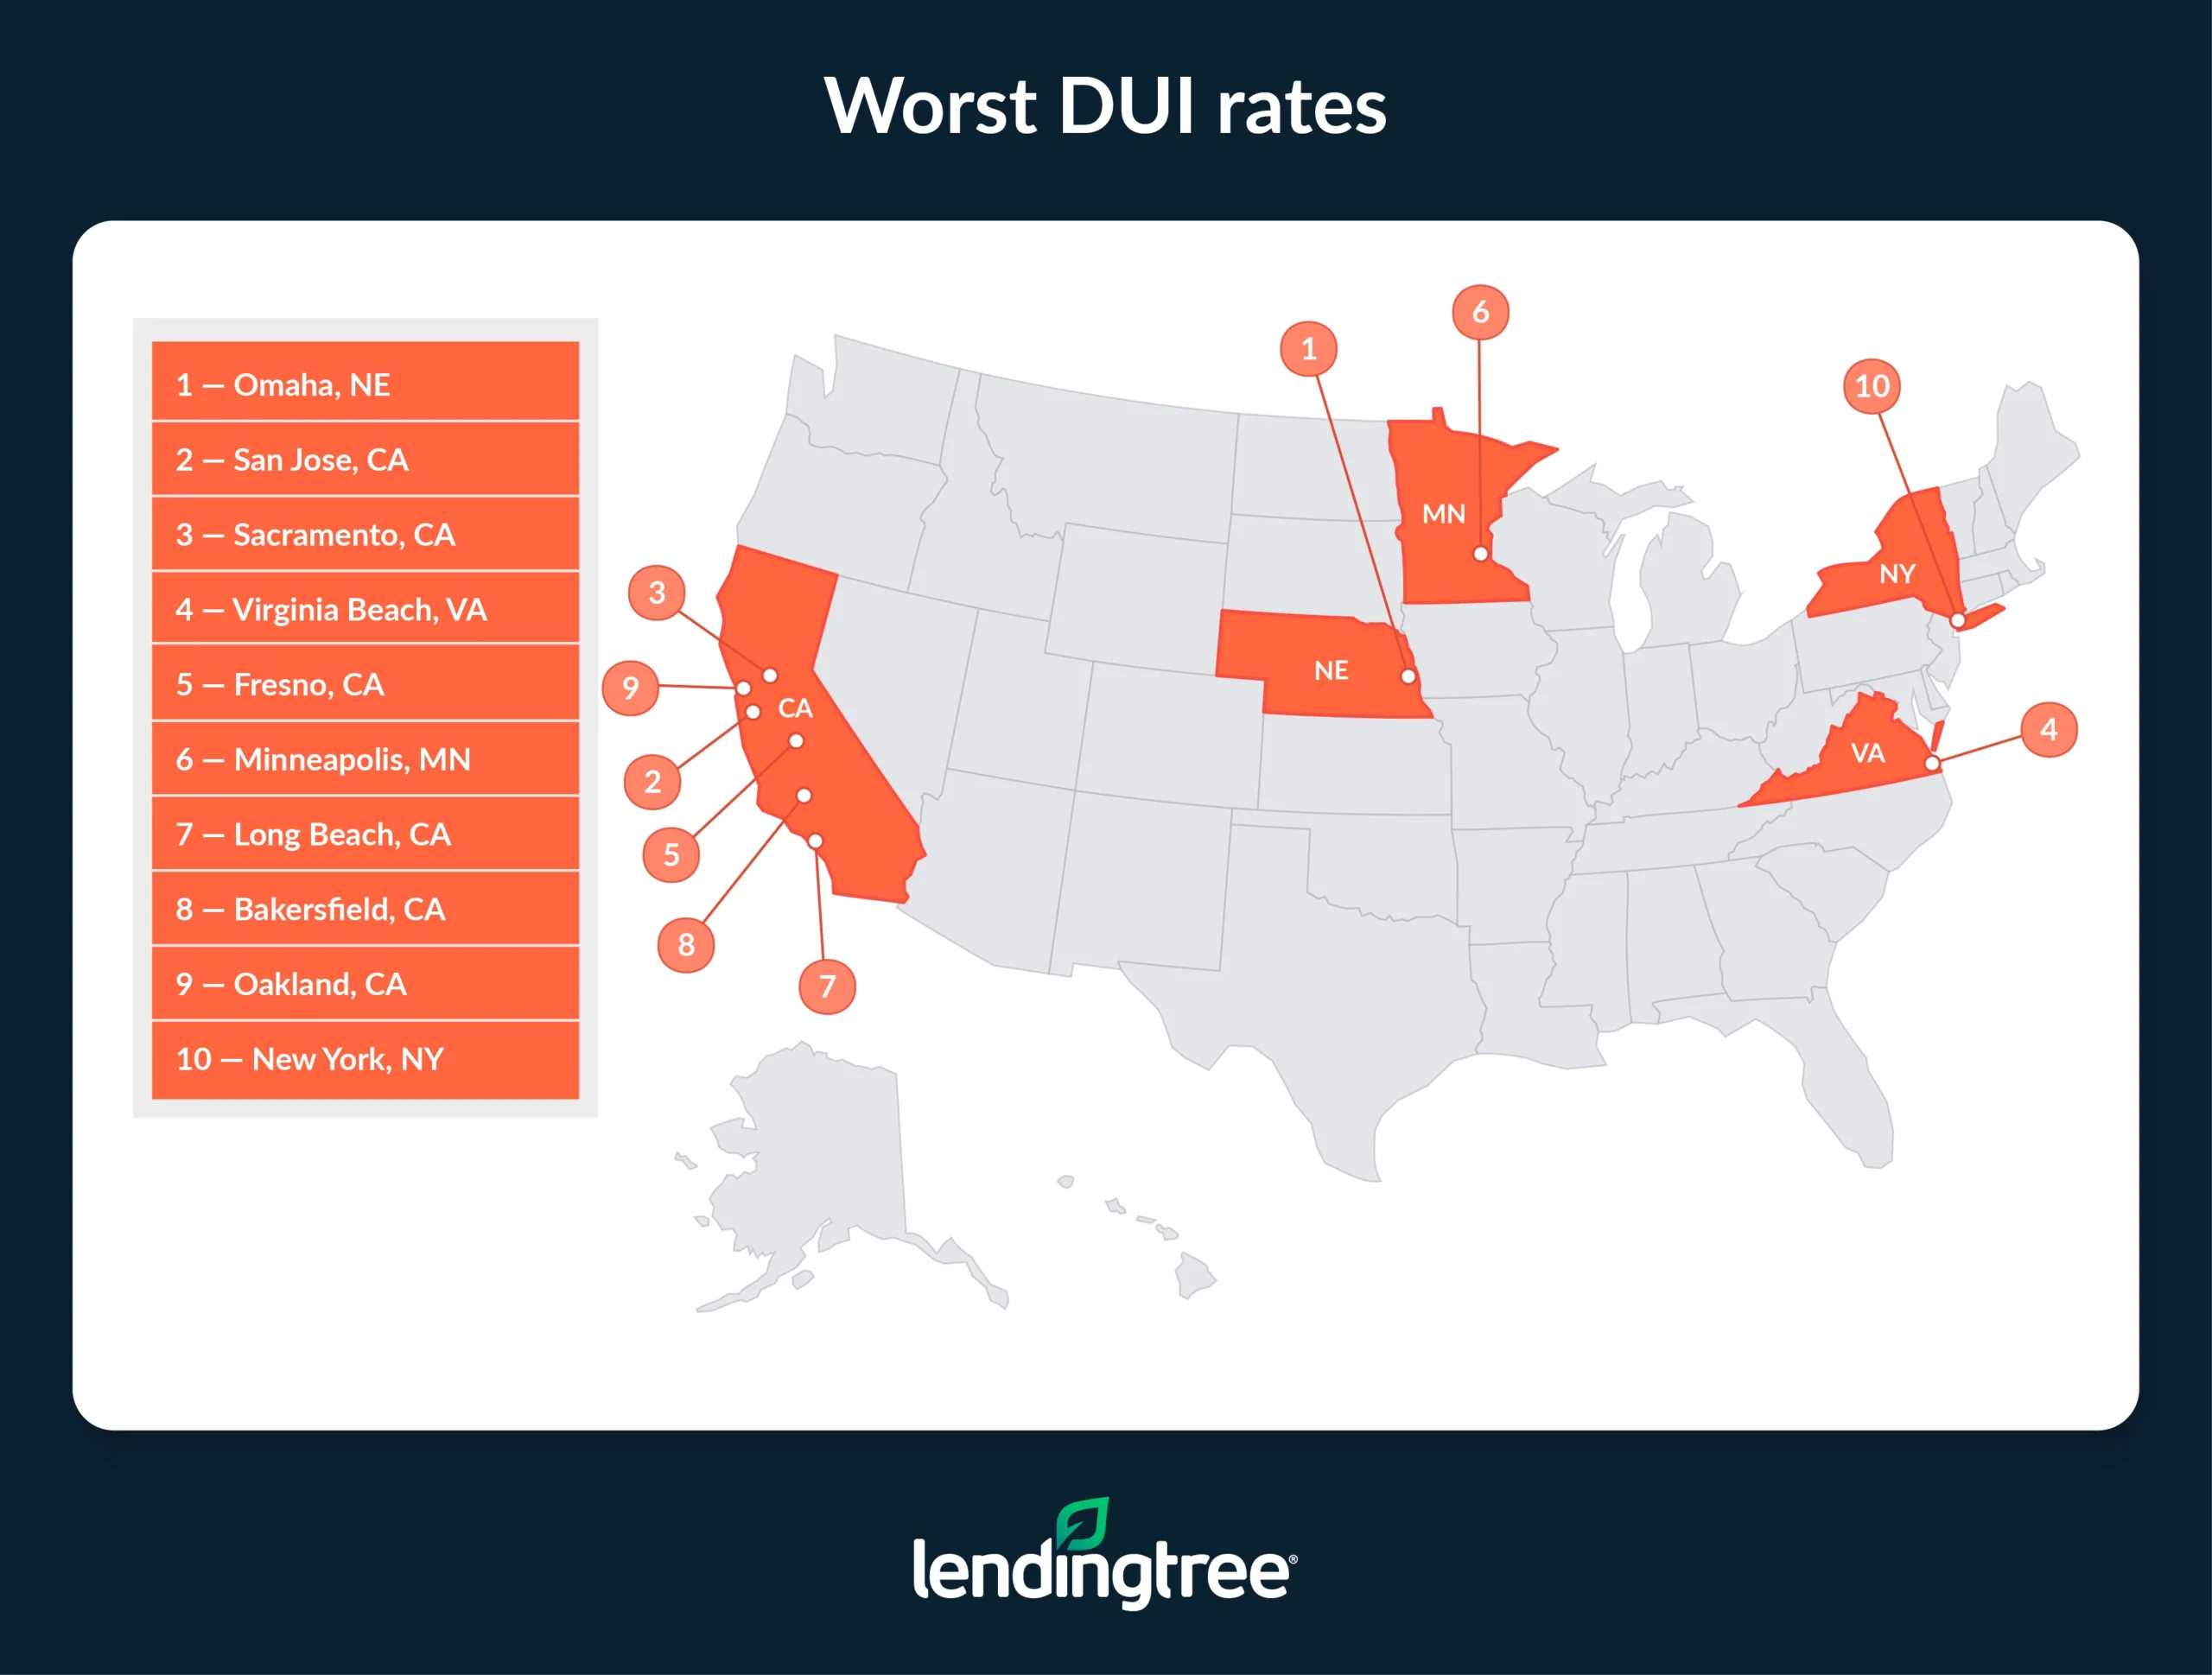
- Omaha, Neb., and San Jose and Sacramento, Calif., drivers have the highest DUI rates among the 50 largest U.S. cities. These cities see 4.48, 3.68 and 3.55 DUIs per 1,000 drivers, respectively.
- Gen Z drivers are most likely to be caught driving under the influence, but millennials aren’t far behind. Gen Zers in the 50 largest cities have the highest DUI rate at 2.62 per 1,000 drivers, with millennials trailing at 2.40.
- BMW drivers have the highest DUI rate among the car brands analyzed. Across the 50 largest cities, this brand sees 3.09 DUIs per 1,000 drivers, with the next highest being Ram (3.00) and Acura (2.69).
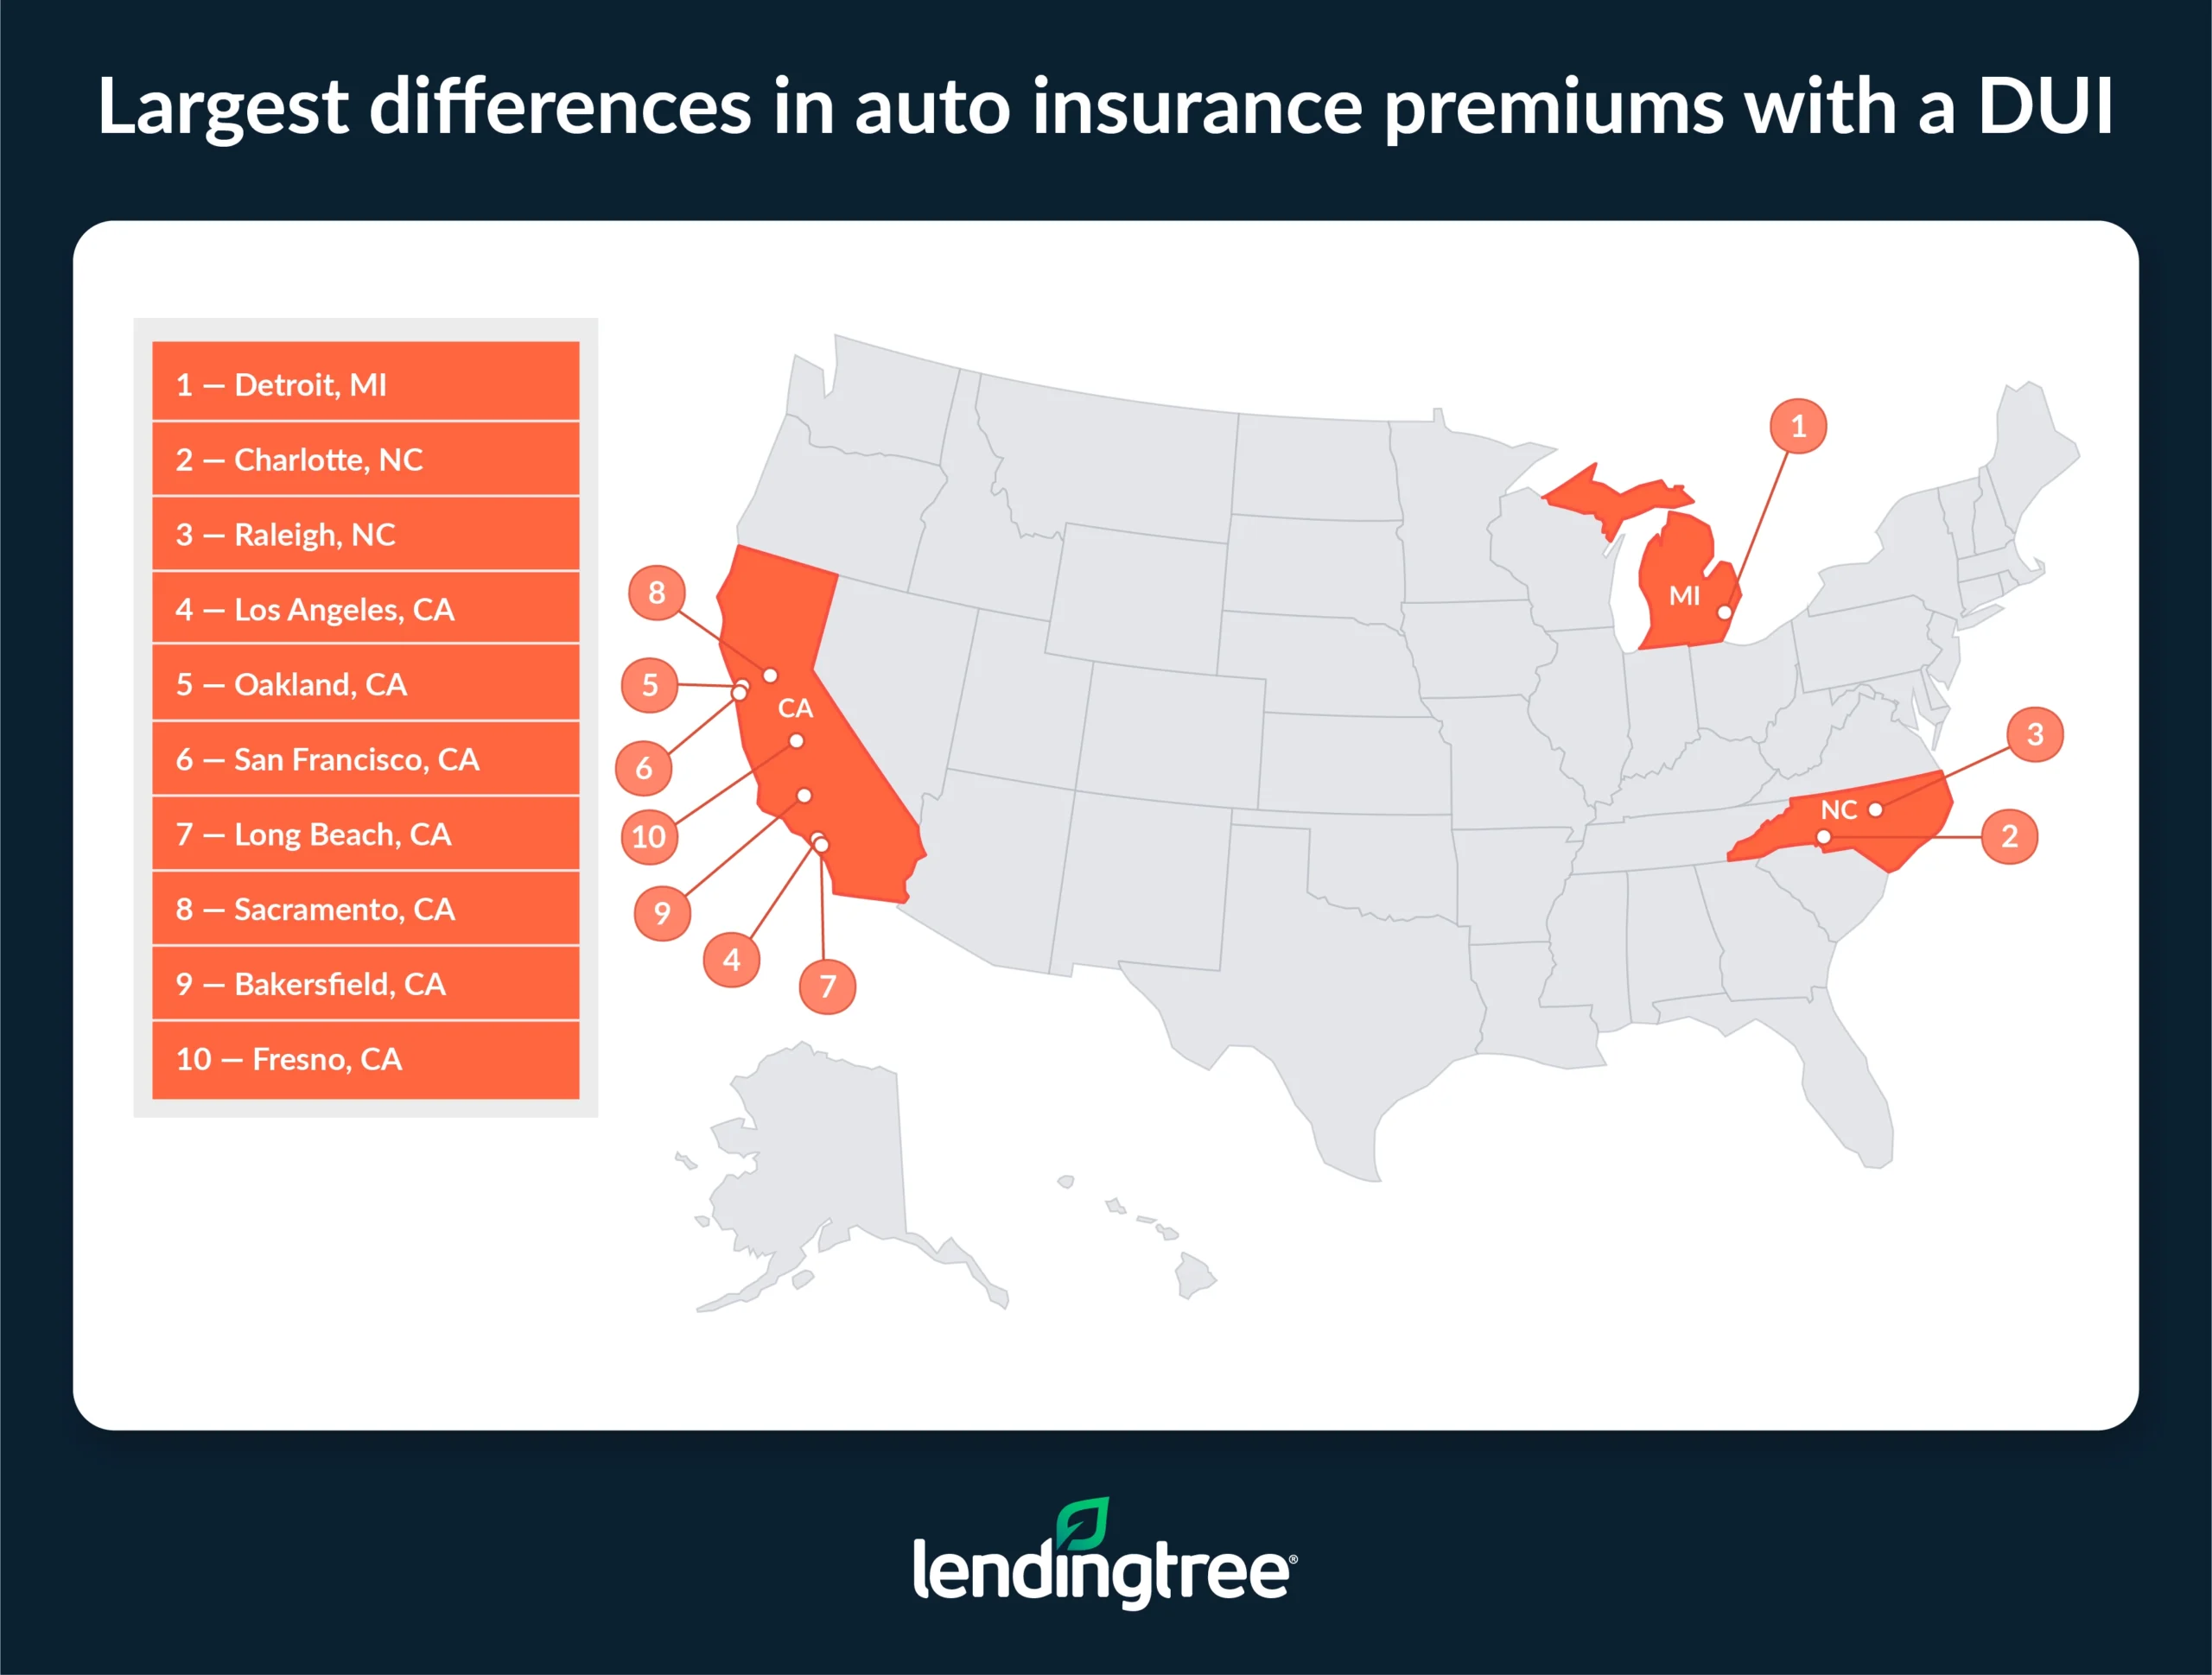
- Drivers see their annual auto insurance rates increase by an average of $2,449 after a DUI — over $200 a month. Detroit has the highest increase among the largest cities by far, with rates rising an average of $12,627 annually after a DUI. North Carolina cities Charlotte ($6,057) and Raleigh ($5,187) follow.
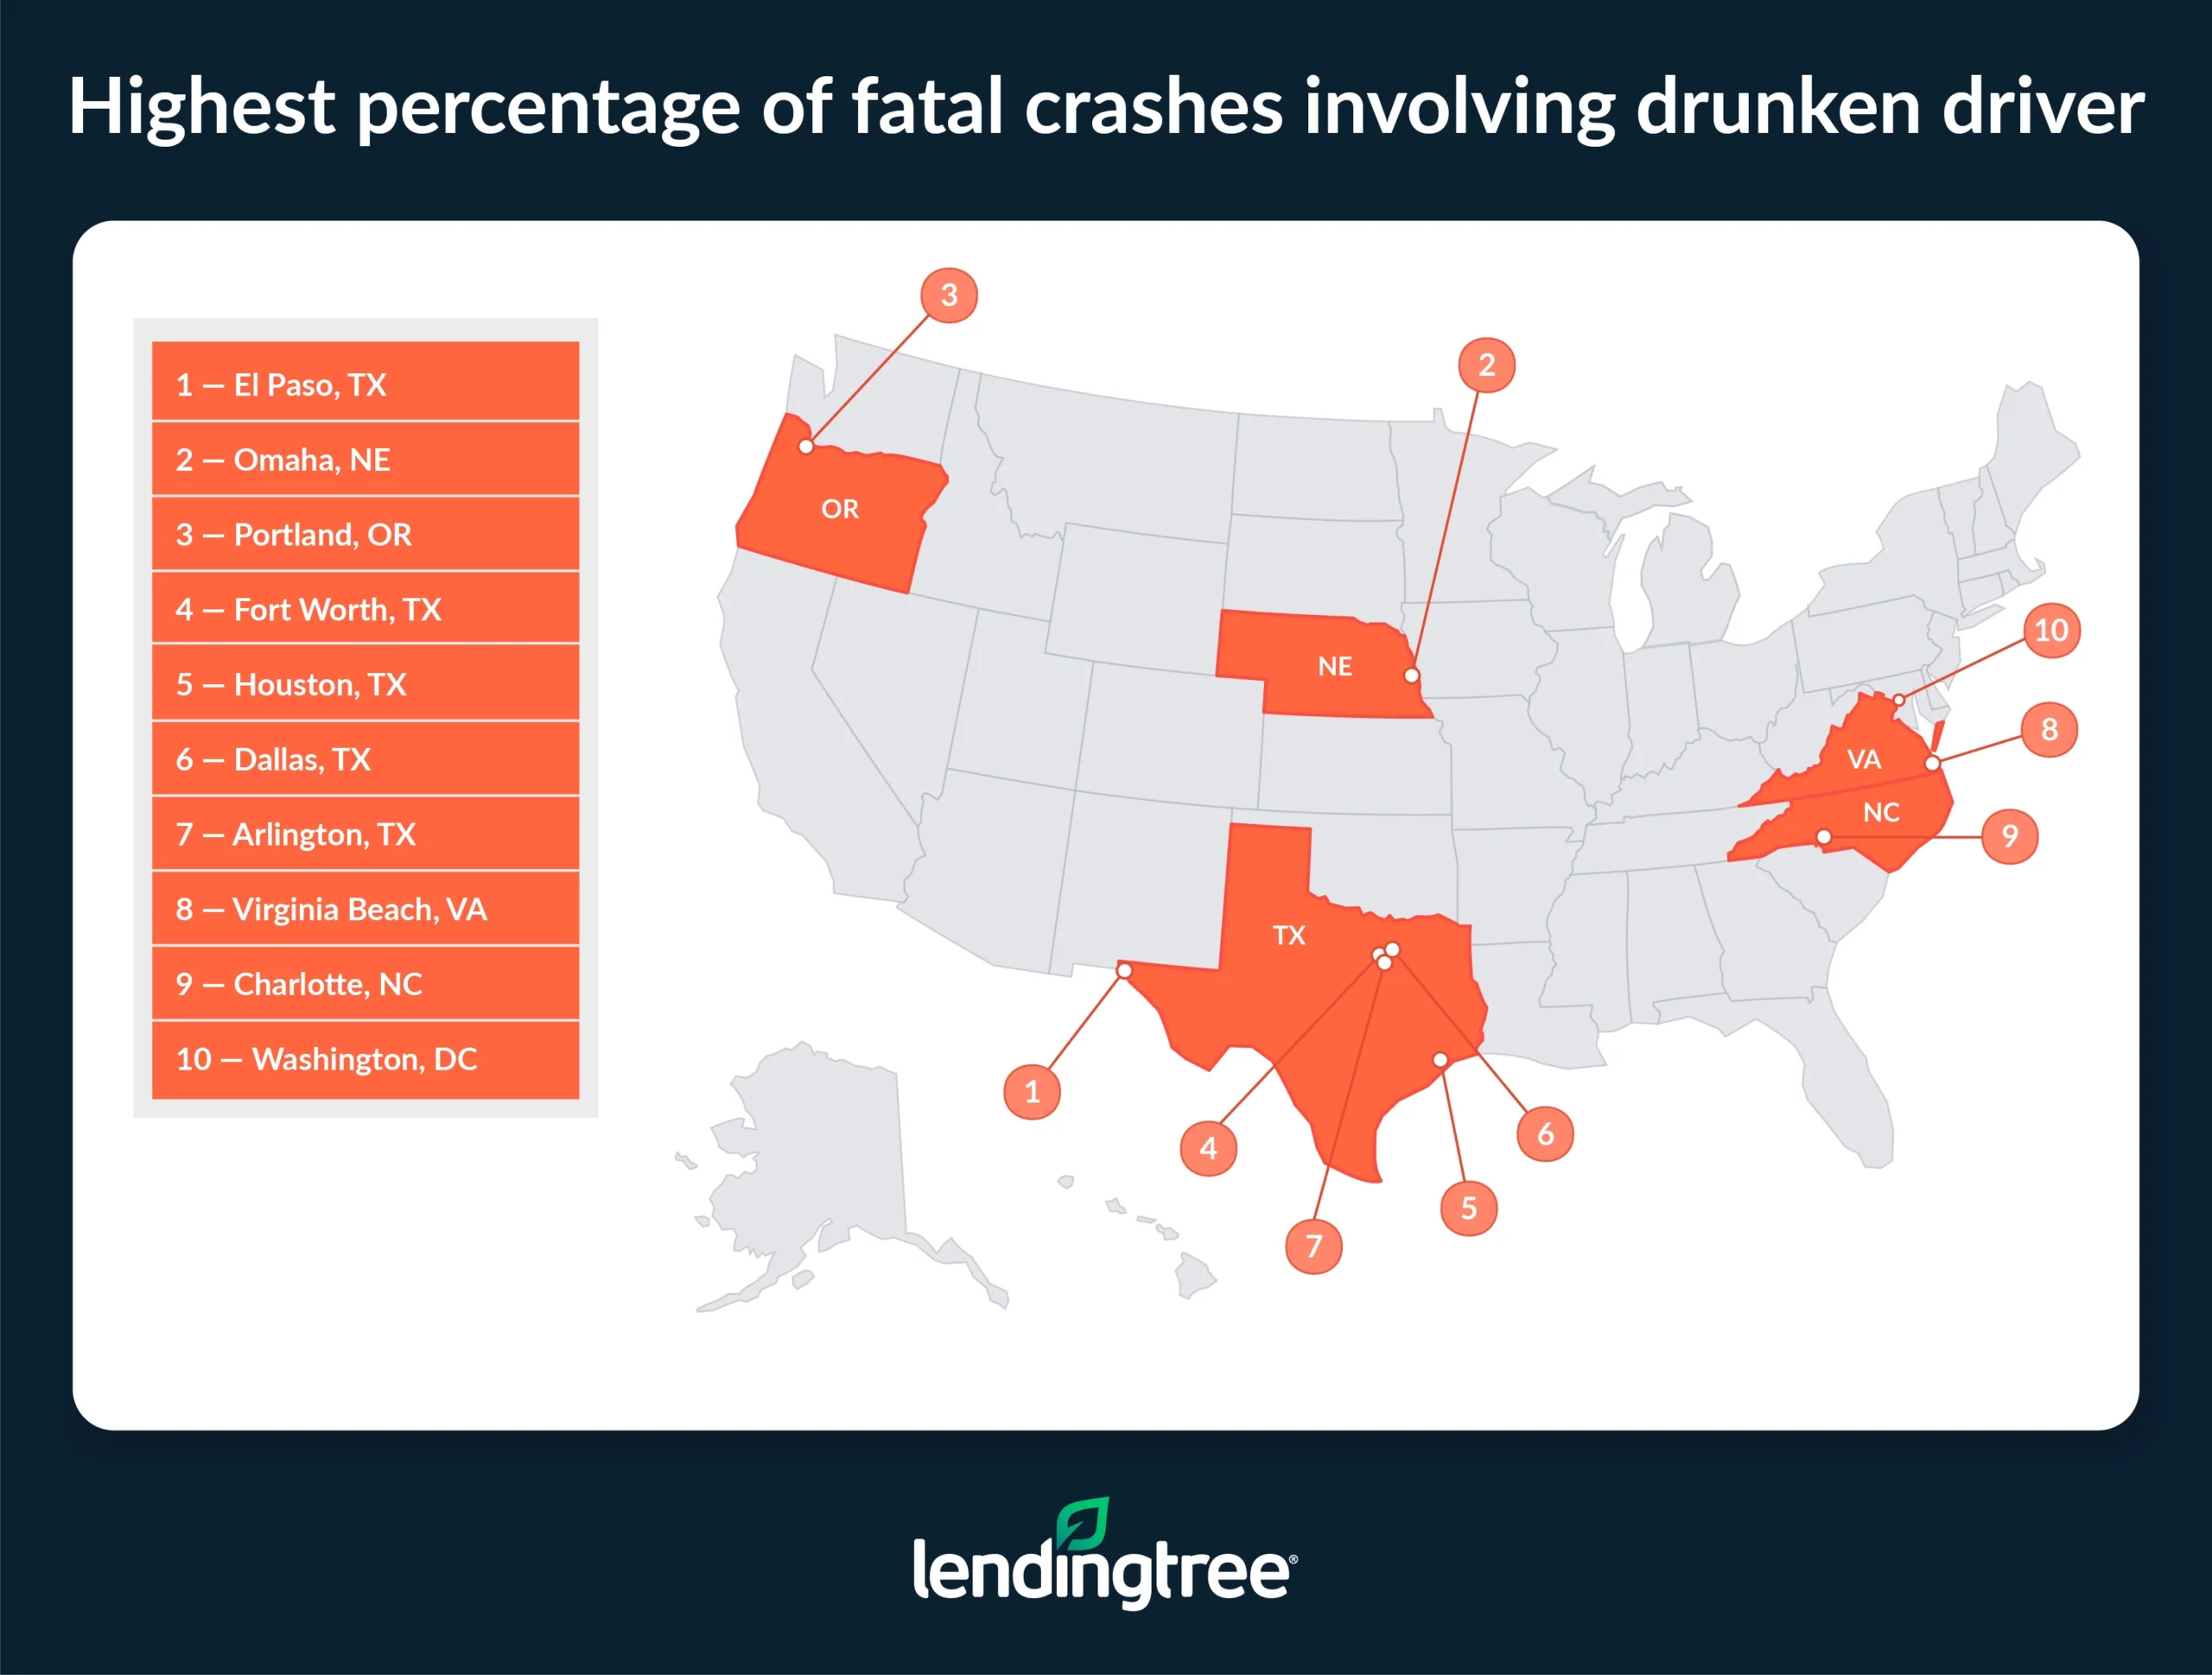
- El Paso, Texas, had the highest percentage of fatal crashes involving a drunken driver in 2023. 60.8% of deadly crashes in the city were attributed to drunken driving. Omaha (60.6%) and Portland, Ore. (54.7%), followed.
Highest DUI rates in Nebraska, California cities
Of the 50 largest cities in the U.S., the location with the highest DUI rate is Omaha, Neb. Omaha has a DUI rate of 4.48 DUIs per 1,000 drivers — more than twice as high as the 50-city average of 1.90.
California drivers in several cities have particularly high DUI rates as well. Among the 10 largest U.S. cities with the highest DUI rates, six are in California:
- San Jose: 3.68
- Sacramento: 3.55
- Fresno: 3.31
- Long Beach: 2.83
- Bakersfield: 2.78
- Oakland: 2.76
While exact causes can be tough to determine, LendingTree auto insurance expert and licensed insurance agent Rob Bhatt notes that climate and other factors might be at play. “Warm weather entices people to gather, often with alcohol. A lack of transit may lead many to drive when they should use alternative transportation. Stricter enforcement of DUI laws can certainly also be a factor in high DUI rates, too,” he says.
Conversely, the cities with the lowest DUI rates are Chicago, Tulsa, Okla., Miami, Memphis, Tenn., and Philadelphia. The DUI rates in each of these cities fall well below the 50-city average, with Chicago at 0.45 DUIs per 1,000 drivers and Tulsa at 0.65. Miami, Memphis and Philadelphia tie at 0.66.
Full rankings: DUI rate per 1,000 drivers in large cities
| Rank | City | DUIs per 1,000 drivers |
|---|---|---|
| 1 | Omaha, NE | 4.48 |
| 2 | San Jose, CA | 3.68 |
| 3 | Sacramento, CA | 3.55 |
| 4 | Virginia Beach, VA | 3.46 |
| 5 | Fresno, CA | 3.31 |
| 6 | Minneapolis, MN | 3.30 |
| 7 | Long Beach, CA | 2.83 |
| 8 | Bakersfield, CA | 2.78 |
| 9 | Oakland, CA | 2.76 |
| 10 | New York, NY | 2.73 |
| 11 | San Diego, CA | 2.68 |
| 12 | Colorado Springs, CO | 2.63 |
| 13 | San Francisco, CA | 2.59 |
| 14 | Milwaukee, WI | 2.39 |
| 15 | Albuquerque, NM | 2.35 |
| 15 | Columbus, OH | 2.35 |
| 17 | Mesa, AZ | 2.33 |
| 18 | Denver, CO | 2.23 |
| 19 | Raleigh, NC | 2.16 |
| 20 | Indianapolis, IN | 2.11 |
| 21 | Tucson, AZ | 2.05 |
| 22 | Phoenix, AZ | 2.04 |
| 23 | Las Vegas, NV | 2.01 |
| 24 | Los Angeles, CA | 1.94 |
| 25 | Nashville, TN | 1.81 |
| 26 | Seattle, WA | 1.67 |
| 27 | Kansas City, MO | 1.66 |
| 28 | Portland, OR | 1.57 |
| 29 | Washington, DC | 1.56 |
| 30 | Boston, MA | 1.50 |
| 31 | Charlotte, NC | 1.49 |
| 32 | El Paso, TX | 1.38 |
| 33 | Oklahoma City, OK | 1.37 |
| 34 | Austin, TX | 1.32 |
| 35 | Louisville, KY | 1.28 |
| 36 | Jacksonville, FL | 1.23 |
| 37 | Atlanta, GA | 1.18 |
| 38 | Tampa, FL | 1.17 |
| 39 | Baltimore, MD | 1.14 |
| 40 | Fort Worth, TX | 1.08 |
| 41 | Arlington, TX | 1.03 |
| 41 | Dallas, TX | 1.03 |
| 43 | Houston, TX | 1.02 |
| 44 | San Antonio, TX | 1.01 |
| 45 | Detroit, MI | 0.81 |
| 46 | Philadelphia, PA | 0.66 |
| 46 | Memphis, TN | 0.66 |
| 46 | Miami, FL | 0.66 |
| 49 | Tulsa, OK | 0.65 |
| 50 | Chicago, IL | 0.45 |
Gen Z drivers most likely to be caught driving under the influence
DUI rates are not uniform across all age groups. According to LendingTree data, younger drivers in the 50 biggest cities have higher DUI rates than older ones. In fact, our study found the DUI rate increased with each successive generation.
Gen Z drivers (ages 18 to 27 in 2024) make up the age group most likely to be caught driving under the influence, with a DUI rate of 2.62 per 1,000 drivers. Millennials (ages 28 to 43 in 2024) fall close behind, with a DUI rate of 2.40.
“People tend to become more risk-averse as they age,” Bhatt says. “Gen Z will someday reach the age of today’s baby boomers. If they’re lucky, younger drivers will be more responsible then.” We can also be hopeful that messaging campaigns from groups like Mothers Against Drunk Driving (MADD) will help future generations avoid the tragic outcomes that can result from the risky behavior of impaired driving.
Full rankings: DUI rate per 1,000 drivers in large cities (by generation)
| Generation | DUIs per 1,000 drivers |
|---|---|
| Gen Z | 2.62 |
| Millennial | 2.40 |
| Gen X | 1.40 |
| Baby boomer | 0.76 |
| Silent generation | 0.21 |
It’s well-established that younger drivers typically pay higher insurance rates due to their higher risk behind the wheel. Higher DUI rates among young drivers are just one contributing factor to this phenomenon. But even young drivers may find competitive rates by shopping around and maintaining responsible driving habits.
BMW drivers have highest DUI rate
Next, LendingTree analyzed DUI rates by vehicle make, which made for some interesting findings. BMW drivers in the 50 biggest cities have the highest DUI rate at 3.09 per 1,000 drivers. But Ram is close behind with a rate of 3.00.
While it’s difficult to pinpoint the causes behind these trends, it’s interesting to note that of the top five brands with the highest DUI rates, four are considered “luxury brands,” including:
- BMW: 3.09
- Acura: 2.69
- Audi: 2.42
- Volvo: 2.42
Some may wonder if wealthier drivers sometimes feel more entitled to break, or at least bend, the law.
At the other extreme, we also took a look at vehicle makes with the lowest DUI rates. Here, Mercury (0.86), Land Rover (1.16) and Lincoln (1.16) round out the bottom of the list.
Full rankings: DUI rate per 1,000 drivers in large cities (by vehicle make)
| Rank | Vehicle make | DUIs per 1,000 drivers |
|---|---|---|
| 1 | BMW | 3.09 |
| 2 | Ram | 3.00 |
| 3 | Acura | 2.69 |
| 4 | Audi | 2.42 |
| 4 | Volvo | 2.42 |
| 6 | Subaru | 2.40 |
| 7 | Cadillac | 2.34 |
| 8 | GMC | 2.15 |
| 9 | Jeep | 2.10 |
| 10 | Ford | 2.09 |
| 10 | Honda | 2.09 |
| 12 | Chevrolet | 2.04 |
| 13 | Dodge | 2.03 |
| 14 | Mitsubishi | 1.96 |
| 15 | Tesla | 1.94 |
| 16 | Toyota | 1.90 |
| 17 | Volkswagen | 1.88 |
| 18 | Mazda | 1.82 |
| 19 | Nissan | 1.73 |
| 20 | Lexus | 1.71 |
| 21 | Kia | 1.70 |
| 22 | Hyundai | 1.61 |
| 23 | Infiniti | 1.48 |
| 24 | Mercedes-Benz | 1.43 |
| 25 | Chrysler | 1.42 |
| 26 | Buick | 1.32 |
| 27 | Pontiac | 1.22 |
| 28 | Land Rover | 1.16 |
| 28 | Lincoln | 1.16 |
| 30 | Mercury | 0.86 |
Drivers see insurance rates increase by average of $2,449 after DUI
Insurance premiums often rise significantly after a DUI conviction, but the level of increase varies based on location. According to LendingTree data, drivers see an average annual rate increase of $2,449 in auto insurance premiums with a DUI across the 50 largest U.S. cities.
In some cities, the premium hike following a DUI is more substantial than in other locations. In Detroit, drivers without a DUI pay average annual insurance premiums of $9,019. Those who’ve been caught driving while impaired, however, pay an average of $21,646 — an increase of $12,627 a year.
Of the 10 cities with the largest increase in premiums after a DUI, seven are in California — perhaps in response to the state’s high rate of impaired driving.
“Insurance rates generally reflect the cost of doing business in a particular area,” Bhatt says. “The high rates for DUI offenders suggest that impaired drivers cause particularly costly injuries and damage in California. Insurance companies recoup their costs by charging high rates to the drivers that create the greatest expenses for them.”
Detroit, as mentioned, holds the top spot, and the two remaining cities are in North Carolina.
Conversely, some cities have lower increases in annual insurance rates after a DUI. Of the 10 cities with the lowest premium increases, seven are in Texas.
Of course, insurance increases aren’t the only possible financial consequences of a DUI — provided you get out of the situation with life and limb intact.
“You usually have to hire an attorney and pay fines and fees to get your car out of the impound yard and reinstate your driver’s license,” Bhatt says. At the end of the day, these charges can quickly exceed $10,000 or more — and that’s before you factor in your car insurance increase for at least the next three years running.
Full rankings: Difference in annual auto insurance premiums with a DUI in large cities
| Rank | City | Annual premiums | Annual premiums with DUI | Difference |
|---|---|---|---|---|
| 1 | Detroit, MI | $9,019 | $21,646 | $12,627 |
| 2 | Charlotte, NC | $2,019 | $8,076 | $6,057 |
| 3 | Raleigh, NC | $1,729 | $6,916 | $5,187 |
| 4 | Los Angeles, CA | $2,769 | $7,864 | $5,095 |
| 5 | Oakland, CA | $2,292 | $6,509 | $4,217 |
| 6 | San Francisco, CA | $2,272 | $6,452 | $4,180 |
| 7 | Long Beach, CA | $2,230 | $6,333 | $4,103 |
| 8 | Sacramento, CA | $2,186 | $6,208 | $4,022 |
| 9 | Bakersfield, CA | $2,025 | $5,751 | $3,726 |
| 10 | Fresno, CA | $2,007 | $5,700 | $3,693 |
| 11 | San Diego, CA | $1,967 | $5,586 | $3,619 |
| 12 | San Jose, CA | $1,947 | $5,529 | $3,582 |
| 13 | New York, NY | $3,718 | $6,990 | $3,272 |
| 14 | Las Vegas, NV | $4,422 | $7,429 | $3,007 |
| 15 | Atlanta, GA | $2,859 | $5,718 | $2,859 |
| 16 | Minneapolis, MN | $2,357 | $5,044 | $2,687 |
| 17 | Baltimore, MD | $3,031 | $5,456 | $2,425 |
| 18 | Miami, FL | $4,140 | $6,541 | $2,401 |
| 18 | Tampa, FL | $4,139 | $6,540 | $2,401 |
| 20 | Chicago, IL | $2,934 | $5,164 | $2,230 |
| 21 | Portland, OR | $2,825 | $4,972 | $2,147 |
| 22 | Louisville, KY | $2,642 | $4,756 | $2,114 |
| 23 | Philadelphia, PA | $3,713 | $5,718 | $2,005 |
| 24 | Washington, DC | $2,371 | $4,227 | $1,856 |
| 25 | Phoenix, AZ | $3,046 | $4,874 | $1,828 |
| 26 | Jacksonville, FL | $3,125 | $4,938 | $1,813 |
| 27 | Denver, CO | $3,196 | $4,794 | $1,598 |
| 28 | Mesa, AZ | $2,634 | $4,214 | $1,580 |
| 29 | Virginia Beach, VA | $1,840 | $3,404 | $1,564 |
| 30 | Omaha, NE | $2,046 | $3,581 | $1,535 |
| 31 | Boston, MA | $2,073 | $3,586 | $1,513 |
| 32 | Tucson, AZ | $2,502 | $4,003 | $1,501 |
| 33 | Colorado Springs, CO | $2,982 | $4,473 | $1,491 |
| 34 | Kansas City, MO | $2,325 | $3,697 | $1,372 |
| 35 | Memphis, TN | $2,687 | $4,057 | $1,370 |
| 36 | Albuquerque, NM | $2,451 | $3,775 | $1,324 |
| 37 | Oklahoma City, OK | $2,628 | $3,942 | $1,314 |
| 38 | Tulsa, OK | $2,625 | $3,938 | $1,313 |
| 39 | Milwaukee, WI | $2,156 | $3,450 | $1,294 |
| 40 | Indianapolis, IN | $1,853 | $3,095 | $1,242 |
| 41 | Seattle, WA | $2,241 | $3,429 | $1,188 |
| 42 | Nashville, TN | $2,050 | $3,096 | $1,046 |
| 43 | Houston, TX | $2,565 | $3,591 | $1,026 |
| 44 | Dallas, TX | $2,384 | $3,338 | $954 |
| 45 | San Antonio, TX | $2,154 | $3,016 | $862 |
| 46 | Arlington, TX | $2,145 | $3,003 | $858 |
| 47 | Austin, TX | $2,115 | $2,961 | $846 |
| 48 | Columbus, OH | $1,595 | $2,440 | $845 |
| 49 | Fort Worth, TX | $2,107 | $2,950 | $843 |
| 50 | El Paso, TX | $1,995 | $2,793 | $798 |
El Paso, Texas, has highest percentage of fatal crashes involving drunken driver
Of course, the highest possible cost of drunken driving is the loss of human life. LendingTree research shows that El Paso, Texas, has the highest percentage of fatal crashes involving drunken drivers, at 60.8%. The city’s rate is significantly higher than the 50-city average of 37.6%.
It’s also sad to note that five of the 10 cities with the highest percentage of fatal crashes involving drunken drivers are in Texas: El Paso (60.8%), Fort Worth (51.9%), Houston (49.3%), Dallas (48.5%) and Arlington (46.3%). Identifying exact causes of the Lone Star State’s tragic problem is difficult. But the sheer size of Texas and the amount of driving required to get from one city to another may be contributing factors.
Meanwhile, the three cities with the lowest percentage of fatal crashes involving drunken drivers are Milwaukee (22.9%), Miami (23.9%) and Tampa, Fla. (24.5%). The rate of fatal crashes involving DUIs falls well below the 50-city average in each of these locations.
Full rankings: Percentage of fatal crashes involving drunken driver in large cities
| Rank | City | Fatal crashes involving drunken driver | Fatal crashes | % involving drunken driver |
|---|---|---|---|---|
| 1 | El Paso, TX | 45 | 74 | 60.8% |
| 2 | Omaha, NE | 20 | 33 | 60.6% |
| 3 | Portland, OR | 35 | 64 | 54.7% |
| 4 | Fort Worth, TX | 56 | 108 | 51.9% |
| 5 | Houston, TX | 137 | 278 | 49.3% |
| 6 | Dallas, TX | 96 | 198 | 48.5% |
| 7 | Arlington, TX | 19 | 41 | 46.3% |
| 8 | Virginia Beach, VA | 17 | 37 | 45.9% |
| 9 | Charlotte, NC | 38 | 84 | 45.2% |
| 10 | Washington, DC | 17 | 39 | 43.6% |
| 11 | Mesa, AZ | 27 | 63 | 42.9% |
| 12 | Austin, TX | 37 | 90 | 41.1% |
| 13 | Las Vegas, NV | 16 | 39 | 41.0% |
| 14 | Denver, CO | 29 | 71 | 40.8% |
| 15 | Phoenix, AZ | 120 | 299 | 40.1% |
| 16 | Tucson, AZ | 55 | 138 | 39.9% |
| 17 | San Antonio, TX | 68 | 173 | 39.3% |
| 18 | Bakersfield, CA | 20 | 51 | 39.2% |
| 19 | Minneapolis, MN | 9 | 23 | 39.1% |
| 20 | Kansas City, MO | 33 | 86 | 38.4% |
| 21 | Fresno, CA | 19 | 50 | 38.0% |
| 22 | Memphis, TN | 83 | 220 | 37.7% |
| 23 | Columbus, OH | 33 | 89 | 37.1% |
| 24 | Seattle, WA | 12 | 33 | 36.4% |
| 25 | Long Beach, CA | 13 | 36 | 36.1% |
| 26 | Chicago, IL | 57 | 159 | 35.8% |
| 27 | Los Angeles, CA | 110 | 310 | 35.5% |
| 28 | Boston, MA | 6 | 17 | 35.3% |
| 29 | San Diego, CA | 32 | 91 | 35.2% |
| 30 | Detroit, MI | 43 | 123 | 35.0% |
| 31 | Sacramento, CA | 22 | 63 | 34.9% |
| 32 | Oklahoma City, OK | 33 | 95 | 34.7% |
| 33 | San Francisco, CA | 11 | 33 | 33.3% |
| 33 | San Jose, CA | 20 | 60 | 33.3% |
| 33 | Indianapolis, IN | 38 | 114 | 33.3% |
| 36 | Nashville, TN | 33 | 100 | 33.0% |
| 37 | Baltimore, MD | 13 | 40 | 32.5% |
| 38 | Colorado Springs, CO | 15 | 47 | 31.9% |
| 39 | Louisville, KY | 36 | 114 | 31.6% |
| 39 | Raleigh, NC | 12 | 38 | 31.6% |
| 41 | Jacksonville, FL | 47 | 151 | 31.1% |
| 42 | Oakland, CA | 9 | 29 | 31.0% |
| 42 | Tulsa, OK | 22 | 71 | 31.0% |
| 44 | New York, NY | 67 | 220 | 30.5% |
| 45 | Atlanta, GA | 24 | 80 | 30.0% |
| 46 | Albuquerque, NM | 29 | 106 | 27.4% |
| 47 | Philadelphia, PA | 35 | 128 | 27.3% |
| 48 | Tampa, FL | 12 | 49 | 24.5% |
| 49 | Miami, FL | 16 | 67 | 23.9% |
| 50 | Milwaukee, WI | 16 | 70 | 22.9% |
3 ways to manage insurance premiums after DUI
Finding good car insurance after a DUI can be a challenge. But you can use the tips below to help keep your premiums as affordable as possible.
- Shop around. Compare rates from multiple insurance providers to find the best deal for your situation. “The longer you go without another driving incident, the better your rates will become in the future,” Bhatt says.
- Practice good driving habits. As you develop and stick with better driving practices, you may be eligible for lower premiums over time. “Drive the speed limit, use your turn signals at every opportunity and generally avoid all tickets and accidents,” Bhatt says.
- Stop drinking. If you struggle with the temptation to drink and drive, it’s probably best to seek professional help — and maybe consider giving up drinking altogether. “Driving is serious business,” Bhatt says. “You need to take it seriously, because your life and the lives of others on the road depend on you being a safe, responsible driver.”
Methodology
Researchers analyzed tens of millions of QuoteWizard by LendingTree insurance quotes from 2024.
Researchers calculated the number of DUIs per 1,000 drivers in the 50 largest (by population) U.S. cities. We followed the same process across the same cities to determine the:
- Drunkest drivers by generation
- Drunkest drivers by vehicle make (among the 30 makes with the highest number of quotes)
To define generations, LendingTree analysts used the following ranges from the Pew Research Center:
- Generation Z (born between 1997 and 2006; ages 18 to 27 in 2024 — only adults)
- Millennial (born between 1981 and 1996; ages 28 to 43 in 2024)
- Generation X (born between 1965 and 1980; ages 44 to 59 in 2024)
- Baby boomer (born between 1946 and 1964; ages 60 to 78 in 2024)
- Silent generation (born between 1928 and 1945; ages 79 to 95 in 2024)
Additionally, LendingTree researchers gathered quotes for a 2015 Honda Civic EX driven by a man who is 30 with a good credit score, both with and without a DUI. This portion of the study shows the average annual cost of a full-coverage insurance policy in the same cities as above.
The analysis used insurance rate data from Quadrant Information Services. These rates were publicly sourced from insurer filings and should be used for comparative purposes only, as your quotes may be different. Full-coverage policies include coverage limits above minimum requirements.
Full-coverage policy
| Coverage | Limits |
|---|---|
| Bodily injury (BI) liability | $50,000 per person, $100,000 per accident |
| Property damage | $25,000 per accident |
| Uninsured or underinsured motorist BI | $50,000 per person, $100,000 per accident |
| Comprehensive and collision | $500 deductible |
| Personal injury protection | Minimum (when required by state) |
Finally, LendingTree researchers analyzed 2023 National Highway Traffic Safety Administration (NHTSA) Fatality Analysis Reporting System (FARS) data using the Fatality and Injury Reporting System Tool (FIRST).
Recommended Articles