Data Deep Dive: Homeowners Insurance in North Carolina


Homeowners insurance rates in North Carolina have risen dramatically since 2020 — especially in certain areas.
In 2025, Wilmington and Jacksonville top the list of North Carolina’s biggest municipalities with the highest home insurance costs, (no) thanks in large part to high natural disaster exposure. Statewide, average homeowners insurance rates climbed 44.4% cumulatively between 2020 and mid-April 2025, with the steepest annual jump (12.3%) in 2022.
These rising costs underscore a growing pressure on North Carolina homeowners, particularly those residing in coastal and disaster-prone areas. Below is a breakdown of where North Carolina home insurance prices are highest, what’s driving the rate increases and expert tips you can use to lower your insurance premiums.
Key findings
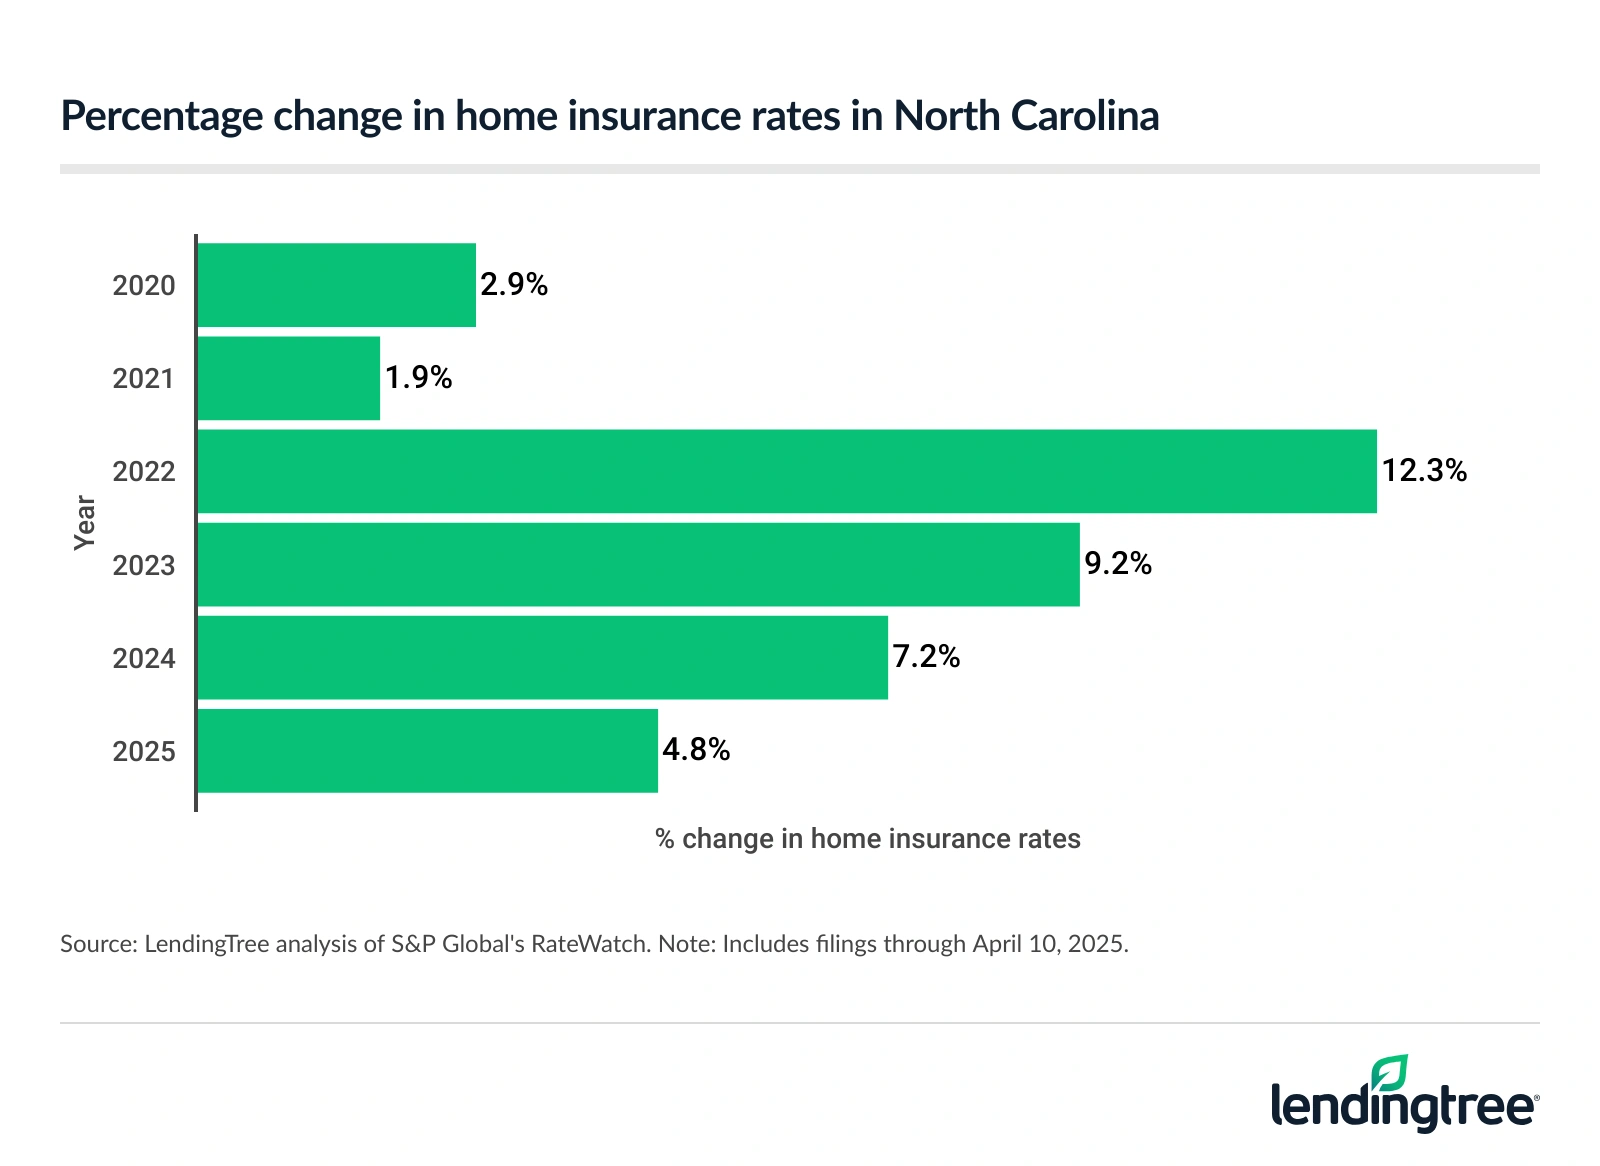
- Home insurance rates in North Carolina have risen 44.4% cumulatively since 2020. The sharpest increase (12.3%) was in 2022. So far in 2025, rates are up 4.8%.
- The average cost of home insurance in Wilmington is more than triple the average among the state’s biggest municipalities. The average in Wilmington is $7,161 annually, 201.6% more than the $2,374 average among the 25 biggest cities and towns. Jacksonville is next at $6,330. Many inland cities, like Raleigh ($2,202) and Charlotte ($2,037), pay below the state average.
- Progressive home insurance rates in North Carolina surged 109.1% cumulatively from 2020 to 2025. Its increase was more than double that of the statewide increase of 44.4% in the same period. Conversely, Chubb, American Family and Liberty Mutual all saw increases of less than 10.0%.
- Wilmington and Jacksonville face the highest natural disaster risk in the state. Their counties experienced the most Federal Emergency Management Agency (FEMA) natural disaster declarations from 2015 to 2025 (both at 12) and finished with the highest natural disaster risk ratings. Likely related, these cities pay the highest home insurance costs in the state.
- Wilson and Rocky Mount have the highest rate of uninsured homes. With 18.0% of homes in Wilson and 17.3% in Rocky Mount uninsured, these cities finish well above the state average of 13.2%. Mooresville, Holly Springs and Wilmington have the lowest uninsured rates, all below 7.0%.
Home insurance rates in North Carolina have risen significantly
Just as home insurance rates have been on the rise throughout the U.S., North Carolina homeowners have experienced a 44.4% cumulative jump in average insurance premiums since 2020. 2022 marks the steepest annual rate increase in this period at 12.3%, and 2025 rates are already up 4.8% through April 10 (the latest available date at the time of research).
There are numerous causes for the rate hikes in North Carolina, with the two primary culprits being inflation and a steady increase in severe weather events. Rob Bhatt, LendingTree home insurance expert and a licensed agent, notes that in the aftermath of 2024’s Hurricane Helene, many North Carolina residents have likely already experienced insurance rate increases. Unfortunately, those same homeowners may expect another premium hike next year.
Following Hurricane Helene, North Carolina insurers paid out over $1.8 billion in covered losses. Among those claims, about 91,000 were for residential property losses totaling more than $938 million. Insurance companies also paid another 7,628 commercial property claims resulting from the natural disaster, totaling another $287 million in losses.
While insurance rates have been increasing steadily throughout the Tar Heel State, beach and coastal homeowners pay significantly higher premiums than their inland neighbors. (Plus, many homeowners also need to carry flood insurance.) This chart illustrates the average cost of home insurance by property location in North Carolina.
Average cost of home insurance by land area in North Carolina
| Land area | Annual rate |
|---|---|
| Beach | $6,304 |
| Coastal | $2,457 |
| Remainder of state | $1,678 |
Wilmington, Jacksonville pay most for home insurance
Wilmington residents pay an average of $7,161 annually for home insurance — more than triple the $2,374 average insurance rate among North Carolina’s 25 largest municipalities. Jacksonville follows at $6,330, with Greenville ($3,165), Fayetteville ($2,985) and Rocky Mount ($2,539) rounding out the top five at rapidly decreasing rates.
Coastal location and disaster risk clearly matter when it comes to insurance rates — but we’ll explore those details in the following sections.
As you can see in the map, the five North Carolina municipalities that pay the least for home insurance are inland — specifically in the mountain, Triad and Piedmont regions.
- Asheville: $1,737 a year
- Hickory: $1,821
- Winston-Salem: $1,893
- High Point: $1,947
- Greensboro: $1,947
Additionally, homeowners in two of the state’s largest cities — Raleigh ($2,202) and Charlotte ($2,037) — pay insurance rates below the 25-municipality average.
Full rankings: Average cost of home insurance in North Carolina’s largest municipalities
| Rank | City/town | Annual rate | % difference from 25-municipality average |
|---|---|---|---|
| 1 | Wilmington | $7,161 | 201.6% |
| 2 | Jacksonville | $6,330 | 166.6% |
| 3 | Greenville | $3,165 | 33.3% |
| 4 | Fayetteville | $2,985 | 25.7% |
| 5 | Rocky Mount | $2,539 | 6.9% |
| 6 | Wilson | $2,522 | 6.2% |
| 7 | Apex | $2,202 | -7.2% |
| 7 | Raleigh | $2,202 | -7.3% |
| 7 | Cary | $2,202 | -7.3% |
| 10 | Holly Springs | $2,201 | -7.3% |
| 11 | Durham | $2,137 | -10.0% |
| 12 | Charlotte | $2,037 | -14.2% |
| 13 | Huntersville | $2,029 | -14.5% |
| 14 | Mooresville | $2,017 | -15.0% |
| 15 | Concord | $2,015 | -15.1% |
| 16 | Kannapolis | $2,014 | -15.2% |
| 17 | Wake Forest | $1,995 | -16.0% |
| 18 | Chapel Hill | $1,994 | -16.0% |
| 19 | Burlington | $1,993 | -16.1% |
| 20 | Gastonia | $1,982 | -16.5% |
| 21 | Greensboro | $1,947 | -18.0% |
| 21 | High Point | $1,947 | -18.0% |
| 23 | Winston-Salem | $1,893 | -20.3% |
| 24 | Hickory | $1,821 | -23.3% |
| 25 | Asheville | $1,737 | -26.8% |
Progressive rates more than double since 2020
Progressive insurance premiums skyrocketed in North Carolina by 109.1% cumulatively between 2020 and mid-April 2025. This increase represented a rate hike of more than twice the overall state increase (44.4% during the same time frame). However, other insurers also raised rates significantly, including Erie (97.8%), Auto-Owners (93.5%), Travelers (73.4%) and Allstate (63.2%).
Conversely, there were several insurers whose rates remained much more stable. The North Carolina insurance companies with the smallest rate increases between 2020 and 2025 were:
- Chubb: 8.2%
- American Family: 8.6%
- Liberty Mutual: 8.8%
- State Farm: 22.6%
- Farmers: 32.7%
Home insurance rate increases in North Carolina by insurer
| Rank | Insurer | % change, 2020-25 |
|---|---|---|
| 1 | Progressive | 109.1% |
| 2 | Erie | 97.8% |
| 3 | Auto-Owners | 93.5% |
| 4 | Travelers | 73.4% |
| 5 | Allstate | 63.2% |
| 6 | USAA | 50.5% |
| 7 | Nationwide | 37.1% |
| 8 | NC Farm Bureau | 37.0% |
| 9 | Farmers | 32.7% |
| 10 | State Farm | 22.6% |
| 11 | Liberty Mutual | 8.8% |
| 12 | American Family | 8.6% |
| 13 | Chubb | 8.2% |
These findings underscore the importance of regularly shopping for home insurance quotes to make sure you find (and keep) your best deal available.
“Most companies say they have cheap rates, but it’s rare for one company to have cheap rates for every type of customer,” Bhatt says. “Comparing quotes from a few or more different companies helps you find the company with the cheapest rate for your situation. It takes a little bit of time, but the savings can be substantial.”
Most companies say they have cheap rates, but it’s rare for one company to have cheap rates for every type of customer.

Natural disaster risks highest in Wilmington, Jacksonville
New Hanover County (Wilmington) and Onslow County (Jacksonville) topped North Carolina with 12 FEMA disaster declarations each from 2015 to 2025. Their natural disaster risk scores (98.50 and 97.93, respectively, also based on the county in which the municipality is located) are the highest in the state.
These details likely had a significant impact on the elevated insurance rates in these areas. By contrast, locations with lower disaster risk scores (e.g., Hickory, Chapel Hill) tend to have lower home insurance costs.
From 2020 to 2024, there were 37 billion-dollar natural disasters in North Carolina. Some of the biggest natural disaster declarations (by cost) to occur during this period include:
- Hurricane Ian, September 2022
- Hurricane Ida, August 2021
- Hurricane Helene, September 2024
- The winter storm and cold wave that affected Northwest, Central and Eastern states, February 2021
- The winter storm and cold wave that affected Central and Eastern states, December 2022
With the frequent occurrence of climate-related hazards, many homeowners worry about how these events may affect their property values and insurance prices. Later, you’ll find tips on reducing insurance rates and protecting your home in high-risk areas.
Full rankings: North Carolina municipalities most at risk of natural disasters
| Rank | City/town | Annual rate | FEMA natural disaster declarations, 2015-25 | Risk score |
|---|---|---|---|---|
| 1 | Wilmington | $7,161 | 12 | 98.50 |
| 2 | Jacksonville | $6,330 | 12 | 97.93 |
| 3 | Greenville | $3,165 | 11 | 94.24 |
| 4 | Apex | $2,202 | 8 | 93.64 |
| 4 | Raleigh | $2,202 | 8 | 93.64 |
| 4 | Cary | $2,202 | 8 | 93.64 |
| 4 | Holly Springs | $2,201 | 8 | 93.64 |
| 4 | Wake Forest | $1,995 | 8 | 93.64 |
| 9 | Fayetteville | $2,985 | 9 | 92.52 |
| 10 | Charlotte | $2,037 | 7 | 91.85 |
| 10 | Huntersville | $2,029 | 7 | 91.85 |
| 12 | Durham | $2,137 | 8 | 86.73 |
| 13 | Rocky Mount | $2,539 | 9 | 86.29 |
| 14 | Greensboro | $1,947 | 9 | 86.22 |
| 14 | High Point | $1,947 | 9 | 86.22 |
| 16 | Wilson | $2,522 | 10 | 85.05 |
| 17 | Gastonia | $1,982 | 7 | 81.55 |
| 18 | Asheville | $1,737 | 8 | 81.48 |
| 19 | Winston-Salem | $1,893 | 9 | 81.29 |
| 20 | Concord | $2,015 | 8 | 80.11 |
| 20 | Kannapolis | $2,014 | 8 | 80.11 |
| 22 | Hickory | $1,821 | 6 | 77.73 |
| 23 | Mooresville | $2,017 | 9 | 76.14 |
| 24 | Burlington | $1,993 | 9 | 74.45 |
| 25 | Chapel Hill | $1,994 | 9 | 72.96 |
Wilson has highest rate of uninsured homes
Wilson (18.0%) and Rocky Mount (17.3%) lead the 25 biggest municipalities in uninsured home rates. Both are well above the statewide average of 13.2%. Meanwhile, Mooresville, Holly Springs and Wilmington — three North Carolina municipalities often considered to be wealthier areas — have the lowest uninsured rates (all under 7.0%).
Unfortunately, being uninsured means significant financial risk for homeowners. Not only do you risk losing safe housing for yourself and your family, but you could also lose a valuable investment.
“Very few people can afford to rebuild their home if it burns down,” says Bhatt, “or even repairs if it’s just partially damaged by something like a kitchen fire or windstorm.” Underinsured homeowners may be forced to sell their properties at a reduced rate to account for unfinished repairs, he explains.
“Homeowners insurance gives you the money to rebuild without having to raid your retirement savings or take out a loan,” Bhatt says — protecting not only your home, but also your finances.
Full rankings: Percentage of uninsured homes in North Carolina’s largest municipalities
| Rank | City/town | Homes | Homes w/out insurance | % of homes w/out insurance |
|---|---|---|---|---|
| 1 | Wilson | 9,710 | 1,748 | 18.0% |
| 2 | Rocky Mount | 10,989 | 1,906 | 17.3% |
| 3 | Burlington | 13,562 | 1,875 | 13.8% |
| 4 | High Point | 26,177 | 3,497 | 13.4% |
| 5 | Fayetteville | 37,857 | 4,731 | 12.5% |
| 6 | Greensboro | 61,002 | 7,219 | 11.8% |
| 7 | Raleigh | 100,895 | 11,828 | 11.7% |
| 7 | Concord | 24,610 | 2,876 | 11.7% |
| 9 | Kannapolis | 13,672 | 1,567 | 11.5% |
| 10 | Winston-Salem | 54,799 | 6,128 | 11.2% |
| 11 | Hickory | 9,674 | 1,013 | 10.5% |
| 12 | Wake Forest | 13,342 | 1,378 | 10.3% |
| 13 | Jacksonville | 8,433 | 860 | 10.2% |
| 14 | Gastonia | 17,175 | 1,705 | 9.9% |
| 15 | Charlotte | 186,045 | 17,043 | 9.2% |
| 16 | Greenville | 12,837 | 1,113 | 8.7% |
| 17 | Chapel Hill | 10,090 | 861 | 8.5% |
| 17 | Durham | 63,883 | 5,360 | 8.4% |
| 19 | Apex | 17,987 | 1,406 | 7.8% |
| 20 | Asheville | 19,138 | 1,445 | 7.6% |
| 21 | Huntersville | 17,166 | 1,287 | 7.5% |
| 21 | Cary | 45,082 | 3,378 | 7.5% |
| 23 | Wilmington | 25,823 | 1,771 | 6.9% |
| 24 | Holly Springs | 12,028 | 812 | 6.8% |
| 25 | Mooresville | 11,512 | 746 | 6.5% |
Lowering rates as a North Carolina homeowner: Expert tips
Home insurance rates may be rising, but finding the best homeowners insurance policy in North Carolina is still possible if you know where to start. Whether you live in a coastal community with higher natural disaster risk or further inland, there are proven ways to save on coverage without sacrificing the coverage options you need.
- Shop for insurance quotes regularly. “Shopping around is a good way to find a cheaper rate on home insurance,” Bhatt says. Comparing insurance quotes from multiple companies could help you spot wide rate differences (even among well-known insurers). Rates can vary based on the age of your home, claims history, your credit score and other factors, so it’s wise to review quotes from insurers at least once a year.
- Raise your deductible to lower your premium. “Increasing your deductible usually lowers your rate with any company,” Bhatt says. Just be sure to have sufficient savings to cover the higher upfront repair costs in an emergency, should you ever need to file a claim.
- Limit claims for minor repairs or losses. “Some companies may drop you if you file too many claims within a short period,” Bhatt warns. Avoid filing claims for small repairs when possible. Following this rule may help protect your claims-free discount (if applicable) and shield you from potential premium hikes.
- Notify your insurer about home improvements. “You should also let your insurance company know about your home improvements,” Bhatt advises. Some insurers may offer a discount for upgrades to plumbing, electrical or heating systems. In some cases, simply installing Wi-Fi-connected home monitoring systems can help you save money.
- Invest in wind-resistant upgrades. “Building or renovating with impact-resistant roofing and wind-resistant windows can often also get you insurance discounts,” Bhatt says. These features could be especially valuable for North Carolina homeowners in coastal or storm-prone regions.
Methodology
LendingTree researchers first utilized the U.S. Census Bureau 2023 American Community Survey (ACS) with five-year estimates to determine the 25 biggest municipalities (by population) in North Carolina.
We then analyzed Quadrant Information Services home insurance data (pulled in June 2025) from those same municipalities. The insurance rates were publicly sourced from insurer filings and should be used for comparative purposes only. Your quotes will likely differ. The following coverages and deductibles were used unless otherwise noted:
- $400,000 dwelling coverage
- $40,000 other structures
- $200,000 personal property
- $80,000 loss-of-use coverage
- $100,000 liability
- $5,000 medical payments
- $1,000 deductible
Home insurance rate change data from 2020 through April 10, 2025, was compiled via S&P Global’s RateWatch, which utilizes annual information from the National Association of Insurance Commissioners (NAIC).
Disaster declaration data (pulled on June 30) was gathered from the Federal Emergency Management Agency (FEMA). Additionally, FEMA’s National Risk Index data was utilized to find the municipalities’ natural disaster risk scores and risk ratings, using their counties as proxies.
Researchers also analyzed the Census Bureau 2023 ACS with five-year estimates to calculate the percentage of homes without insurance. Owner-occupied homes with annual home insurance costs of less than $100 were classified as uninsured. The number of owner-occupied homes that paid less than $100 in annual home insurance costs in 2023 was divided by the total number of owner-occupied homes.
Researchers also analyzed North Carolina Department of Insurance (DOI) 2024 data to find the average annual home insurance rate for coastal, beach and inland homes. A weighted average was calculated by multiplying the average premium by area type by the written house-years for consent-to-rate and non-consent-to-rate policies, and then dividing that by the total written house-years for the selected area type. We also utilized the DOI for Hurricane Helene claims data.
Recommended Articles