US Consumer Debt Statistics and Trends from the Past 2 Years

The average U.S. household with at least one type of debt owed about $144,100 in 2018. That totals to more than $14 trillion — a figure nearly equal to all the money currently in American banks and in circulation that these Americans collectively owe lenders. Take a deep breath: Not all of it comes due next month, and much of what is being repaid is building wealth.
But the current balances can seem daunting:
LendingTree takes a look at the major components of consumer borrowing, how Americans are coping with debt, and note the significant changes in each of the markets since last year.
Major trends in consumer lending
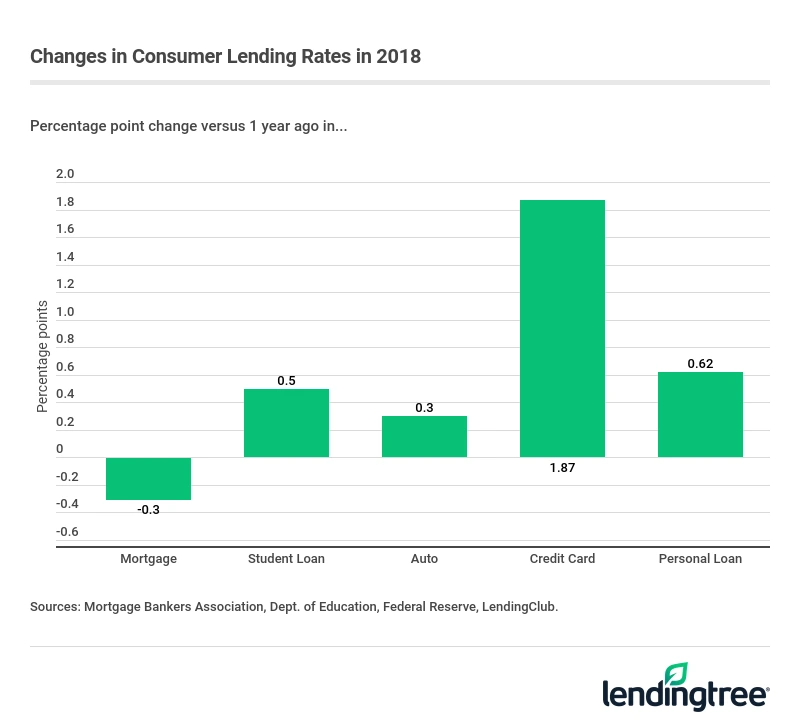
In most lending categories, rates have increased, but in most cases only modestly. The one exception is credit cards, where variable rate changes are most immediately triggered by market conditions. The average credit card interest rates increased by 1.87 percentage points last year, to 16.86%, at the end of 2018.
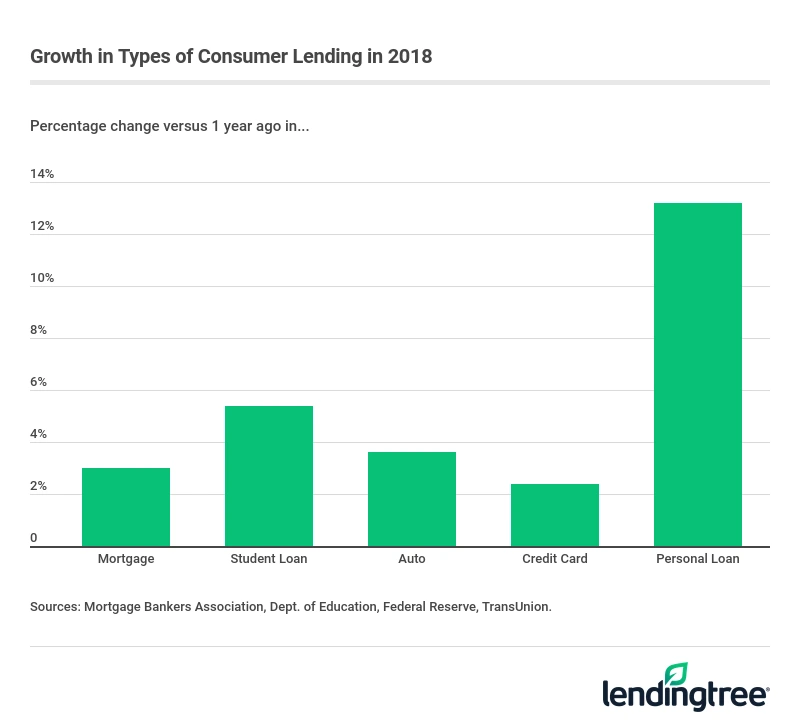
Personal loans are growing the most among different types of loans, increasing by 13.2% last year to $130 billion. Personal loans are forecasted to grow another 20%, to $156 billion, in 2019, according to TransUnion.
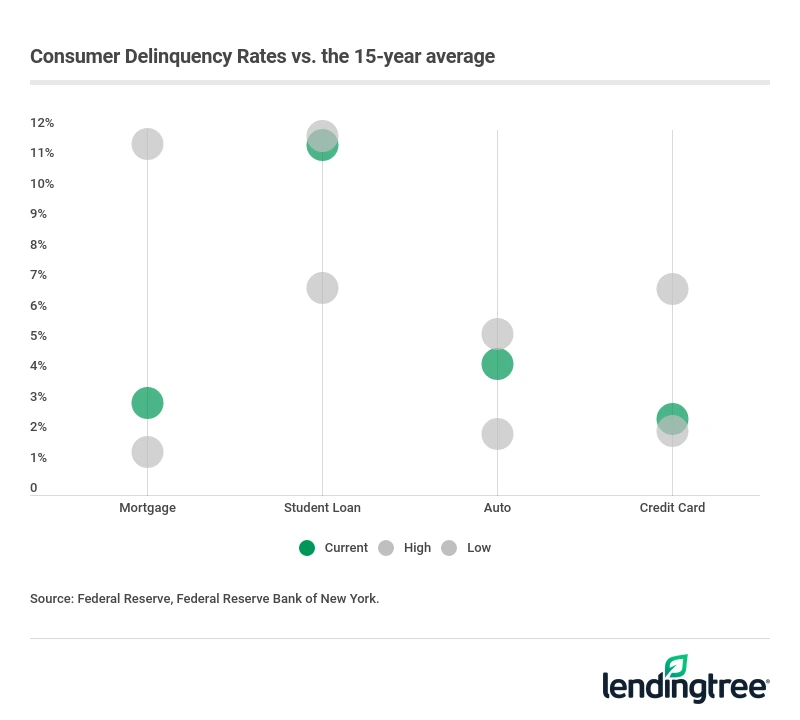
Delinquency can be harmful to your credit report and credit scores. For some consumers, credit repair may be an important tool in helping their scores recover. Luckily, delinquency rates remain low versus their historical range in credit card and mortgages.
Mortgage delinquency rates, for example, are currently at 3%, well below housing crash levels of a decade earlier. Credit card delinquency rates were at 2.5% at the end of 2018, according to the Federal Reserve.
However, auto and student loan delinquency rates are elevated. Student loan default rates are currently 11.5%. Auto loan delinquency rates of 4.3% are within 1 percentage point of their 15-year high.
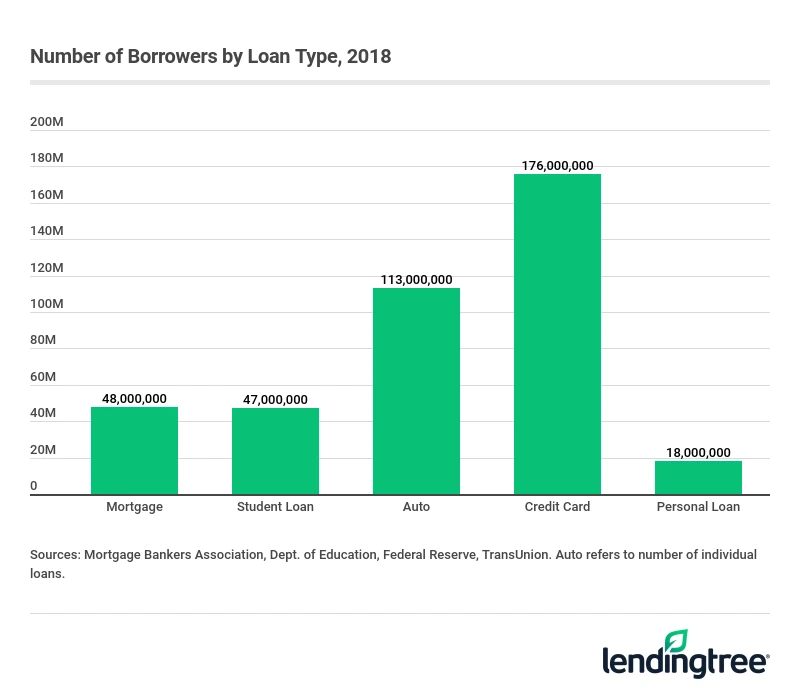
Credit cards are the most ubiquitous form of borrowing. There are 176 million credit users in 2018, according to TransUnion. About 59% of those accounts carry a balance from one month to the next. That’s followed by 113 million auto loans, 48 million households with mortgage debt, 47 million student loan borrowers and 18 million personal loan borrowers.
Mortgages
- Total outstanding mortgage balance: $10.3 trillion
- Change from a year ago: +$300 billion (+3.0%)
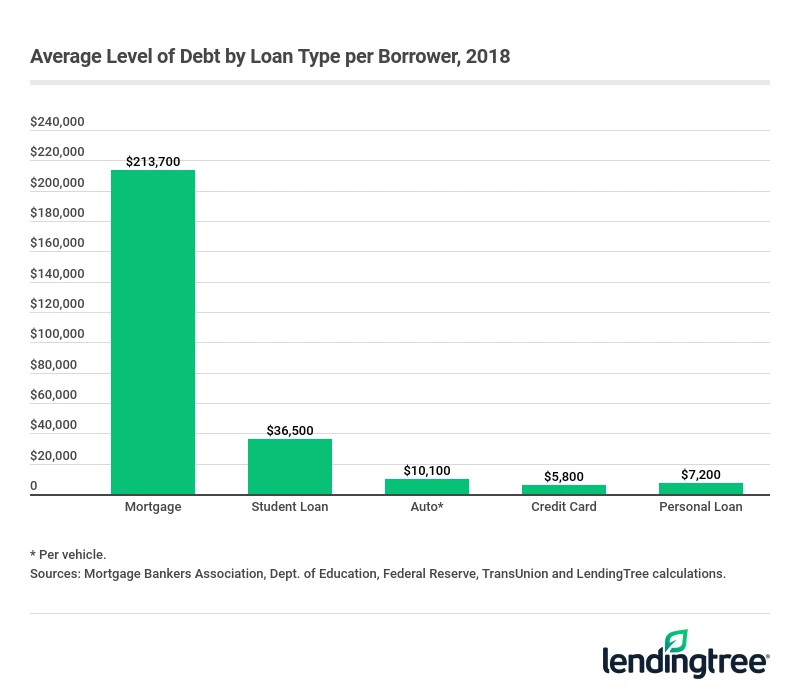
- Average balance per homeowner: $213,700
- Current benchmark interest rate: 4.12% for a 30-year, fixed-rate mortgage
- Rate change from a year ago: -0.30 percentage points
- Delinquencies: 3.01%
- Change from a year ago: -0.64 percentage points
- Number of homeowners with a mortgage: 48.2 million
- Change from one year ago: +0.9 million
Major trend in 2019: Despite the increase in rates, the decline in inventory of both new and existing homes to purchase is likely to suppress homes sales in 2019.
Student loans
- Current student loan balance outstanding: $1.56 trillion
- Change from a year ago: +$80 billion (+5.4%)
- Average student loan balance per borrower: $36,500
- Current rate: 5.05% for an undergraduate direct loan
- Rate change from a year ago: +0.50 percentage points
- Delinquencies: 11.5%
- Change from a year ago: +0.3 percentage points
- Number of borrowers: 42.7 million
- Change from one year ago: -1.5 million
Major trend in 2019: Expect income-driven repayment (IDR) plans — which lower monthly payments but extend the life of the loan — to increase in popularity. The Department of Education calculates that IDR plan adoption has been growing more than 50% annually since its 2011 inception.
Auto loans
- Current outstanding auto loan balance: $1.14 trillion
- Change from a year ago: +$40 billion (+3.6%)
- Average balance per car loan: $10,100
- Current rate: 5.37% for a 60-month loan
- Rate change from a year ago: +0.86 percentage points
- Delinquencies: 4.3%
- Change from a year ago: +0.3 percentage points
- Number of auto loans: 113.1 million
- Change from one year ago: +3.4 million
Major trend in 2019: Consumers begin to tap the brakes on auto loans as the increase in loan rates puts pressure on buyers. Auto industry expert Edmunds anticipates auto sales to slightly soften in 2019.
Credit cards and revolving credit
- Current outstanding credit card balance: $1.02 trillion
- Change from a year ago: $23 billion (+2.4%)
- Average balance per borrower: $5,800
- Current rate: 16.86%
- Rate change from a year ago: 1.87 percentage points
- Delinquencies: 2.49%
- Change from a year ago: -0.03 percentage points
- Number of borrowers: 176 million
- Change from one year ago: 3.8 million (+2.2%)
Major trend in 2019: The rate at which new credit card accounts open will continue to fall. According to the American Bankers Association, the 6% decline in new accounts last year was the steepest since 2012.
Personal loans
- Current personal loan balance outstanding: $130.3 billion
- Change from one year ago: $15.3 billion (+13.2%)
- Average balance per homeowner: $7,200
- Current rate: 11.15%
- Rate change from a year ago: +0.62 percentage points
- Number of borrowers: 18 million
Major trend in 2019: Personal loans continue to be the fastest growing consumer debt sector as more financial institutions begin to offer creditworthy consumers unsecured loans to consolidate other debts and financing of major purchases.
State debt levels: Sun Belt states piling up debt faster
Americans owed more than $50,000 for every man and woman with a credit file in 2018, up 2.6% from the previous year. But there’s a marked difference in the growth rates across the country, among the major types of debt.
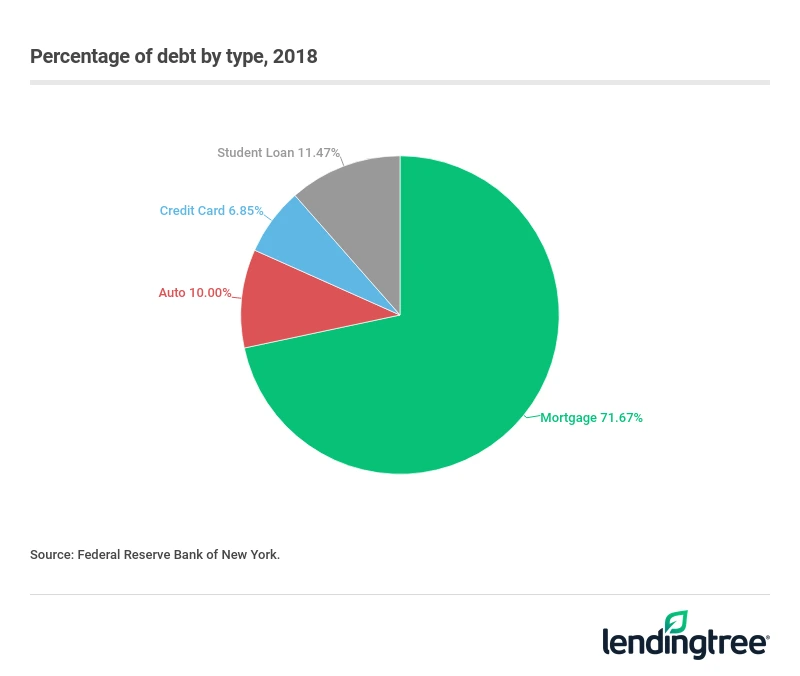
Unsurprisingly, the lion’s share of debt is tied up in mortgages. Nearly three-quarters of total household debt – a little more than $10 trillion in total – is tied up in an individual’s residences.
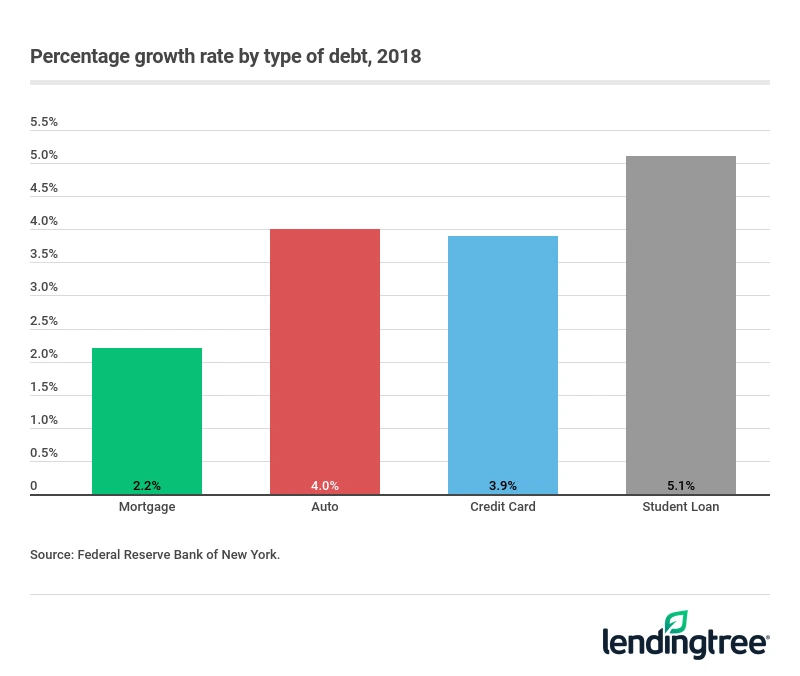
Among the four major types of consumer debt, student loans grew the most last year on a percentage basis, increasing 5.1% from 2017. Auto loans grew 4.0%, credit card balances grew 3.9% and mortgage debt grew at relatively modest 2.2% in 2018.
As far as the more widely held forms of consumer debt – credit cards and auto loans – the primary drivers of both growth and overall balances appear to come from warm weather states. For example, when looking at auto loan balances per capita, the five states with the largest per capita balances were in the sun belt: Arkansas, Georgia, Louisiana, New Mexico and Texas.
Although credit card balances went up in every state except West Virginia (which was unchanged in 2018), some states saw larger jumps than others. Six warm weather states – Arizona, California, Florida, Hawaii, Nevada and South Carolina – all saw their per capita credit card balances grow more than 5% in 2018. Nationwide, per capita average balances grew 3.9%, to $3,220 per adult, or around $870 billion.
3 takeaways from a recent Fed report on how consumer debt has changed since 2008
Americans may owe as much today as they did at the onset of the 2008 financial crisis, but that doesn’t mean the circumstances between the two periods are identical. A recent staff report from the Federal Reserve Bank of New York notes at least three fundamental differences between consumer debt today, and consumer debt at the end of the mid-2000s housing bubble.
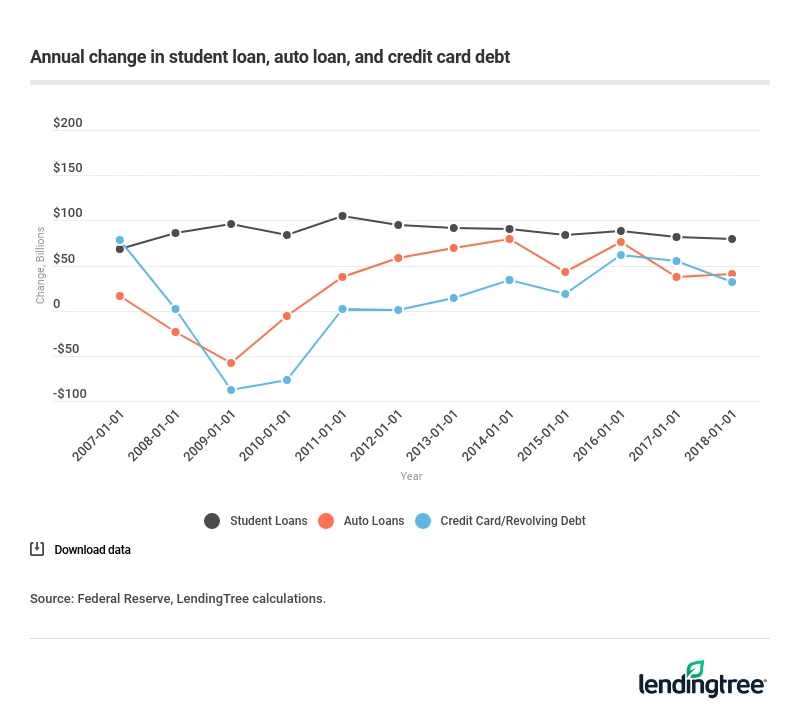
Most types of consumer debt follow the credit cycle. Mortgage, credit card and auto loans all saw debt debt changes fall dramatically during the recession, even after taking into account defaulted auto loans, mortgages and credit card debt. For three years – roughly 2008 through 2011 – Americans borrowed less, either because of an unwillingness to borrow in an uncertain economic environment, or because lenders were unwilling to lend. The one exception to the rule is student loan debt. Student loan borrowers continued to borrow more each subsequent year, regardless of the economic backdrop.
Subprime mortgages have virtually disappeared. In the years leading into the housing bubble, mortgage lenders extended nearly $200 billion in mortgages per quarter to borrowers with credit scores of less than 660 – the traditional definition of a subprime mortgage. At the time this was nearly 20% of the total value of all mortgage originations. Today, no more than $20 billion in subprime mortgages are subprime, indicating more than 80% reduction in those types of mortgages. Currently, nearly all mortgage borrowers (90%) have credit scores of 650 or higher. And those with the lowest scores are generally financing lower-priced homes, not the McMansions of the mid-2000s.

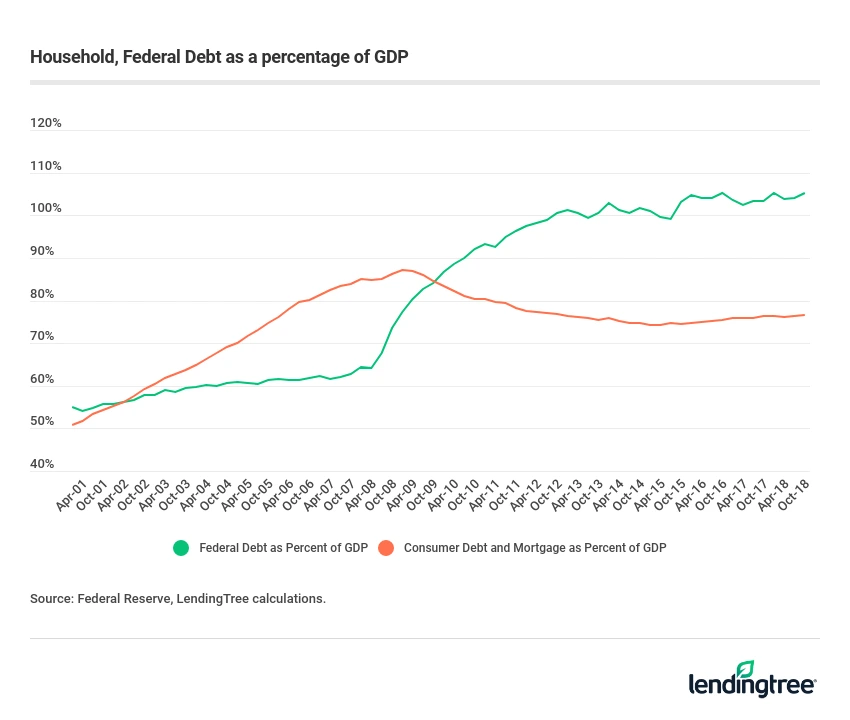
Household debt levels are back to normal. As a percentage of Gross Domestic Product, consumer debt is generally under control, and has returned to a pre-housing bubble levels for a number of years. Consumer debt is currently at about 76% of GDP, down from an elevated level of close to 90% of GDP during the 2008 financial crisis. Consumer debt is much more modest than the Federal debt, which recently eclipsed 100% of GDP, and currently adding close to an additional trillion dollars a year in deficit spending, according to Congressional Budget Office estimates.
Get debt consolidation loan offers from up to 5 lenders in minutes
Recommended Articles