26% of Women Outearn Their Partner, and Taylor Swift Is Helping Shift Norms
With hurdles like glass ceilings and family expectations, women aren’t often the breadwinners in relationships. In fact, according to a LendingTree study, women only outearn their partners in 25.7% of coupled households, on average, across the 100 largest metros where data is available.
But that doesn’t mean women shouldn’t aspire to outearn their partners. While doing so may lead to conflict, Taylor Swift and her powerhouse image have helped many shake off negative feelings about it, according to our survey of 2,000 U.S. consumers.
Here’s a closer look.
Key findings
- Women only outearn their partners in about 1 in 4 (25.7%) coupled households, on average, across the 100 largest metros where data is available. New Haven, Conn., leads, with women outearning men in 29.7% of coupled households. Syracuse, N.Y. (29.5%), and Minneapolis and Providence, R.I. (both at 28.9%), follow. Overall, nine of the top 10 metros are in the Northeast.
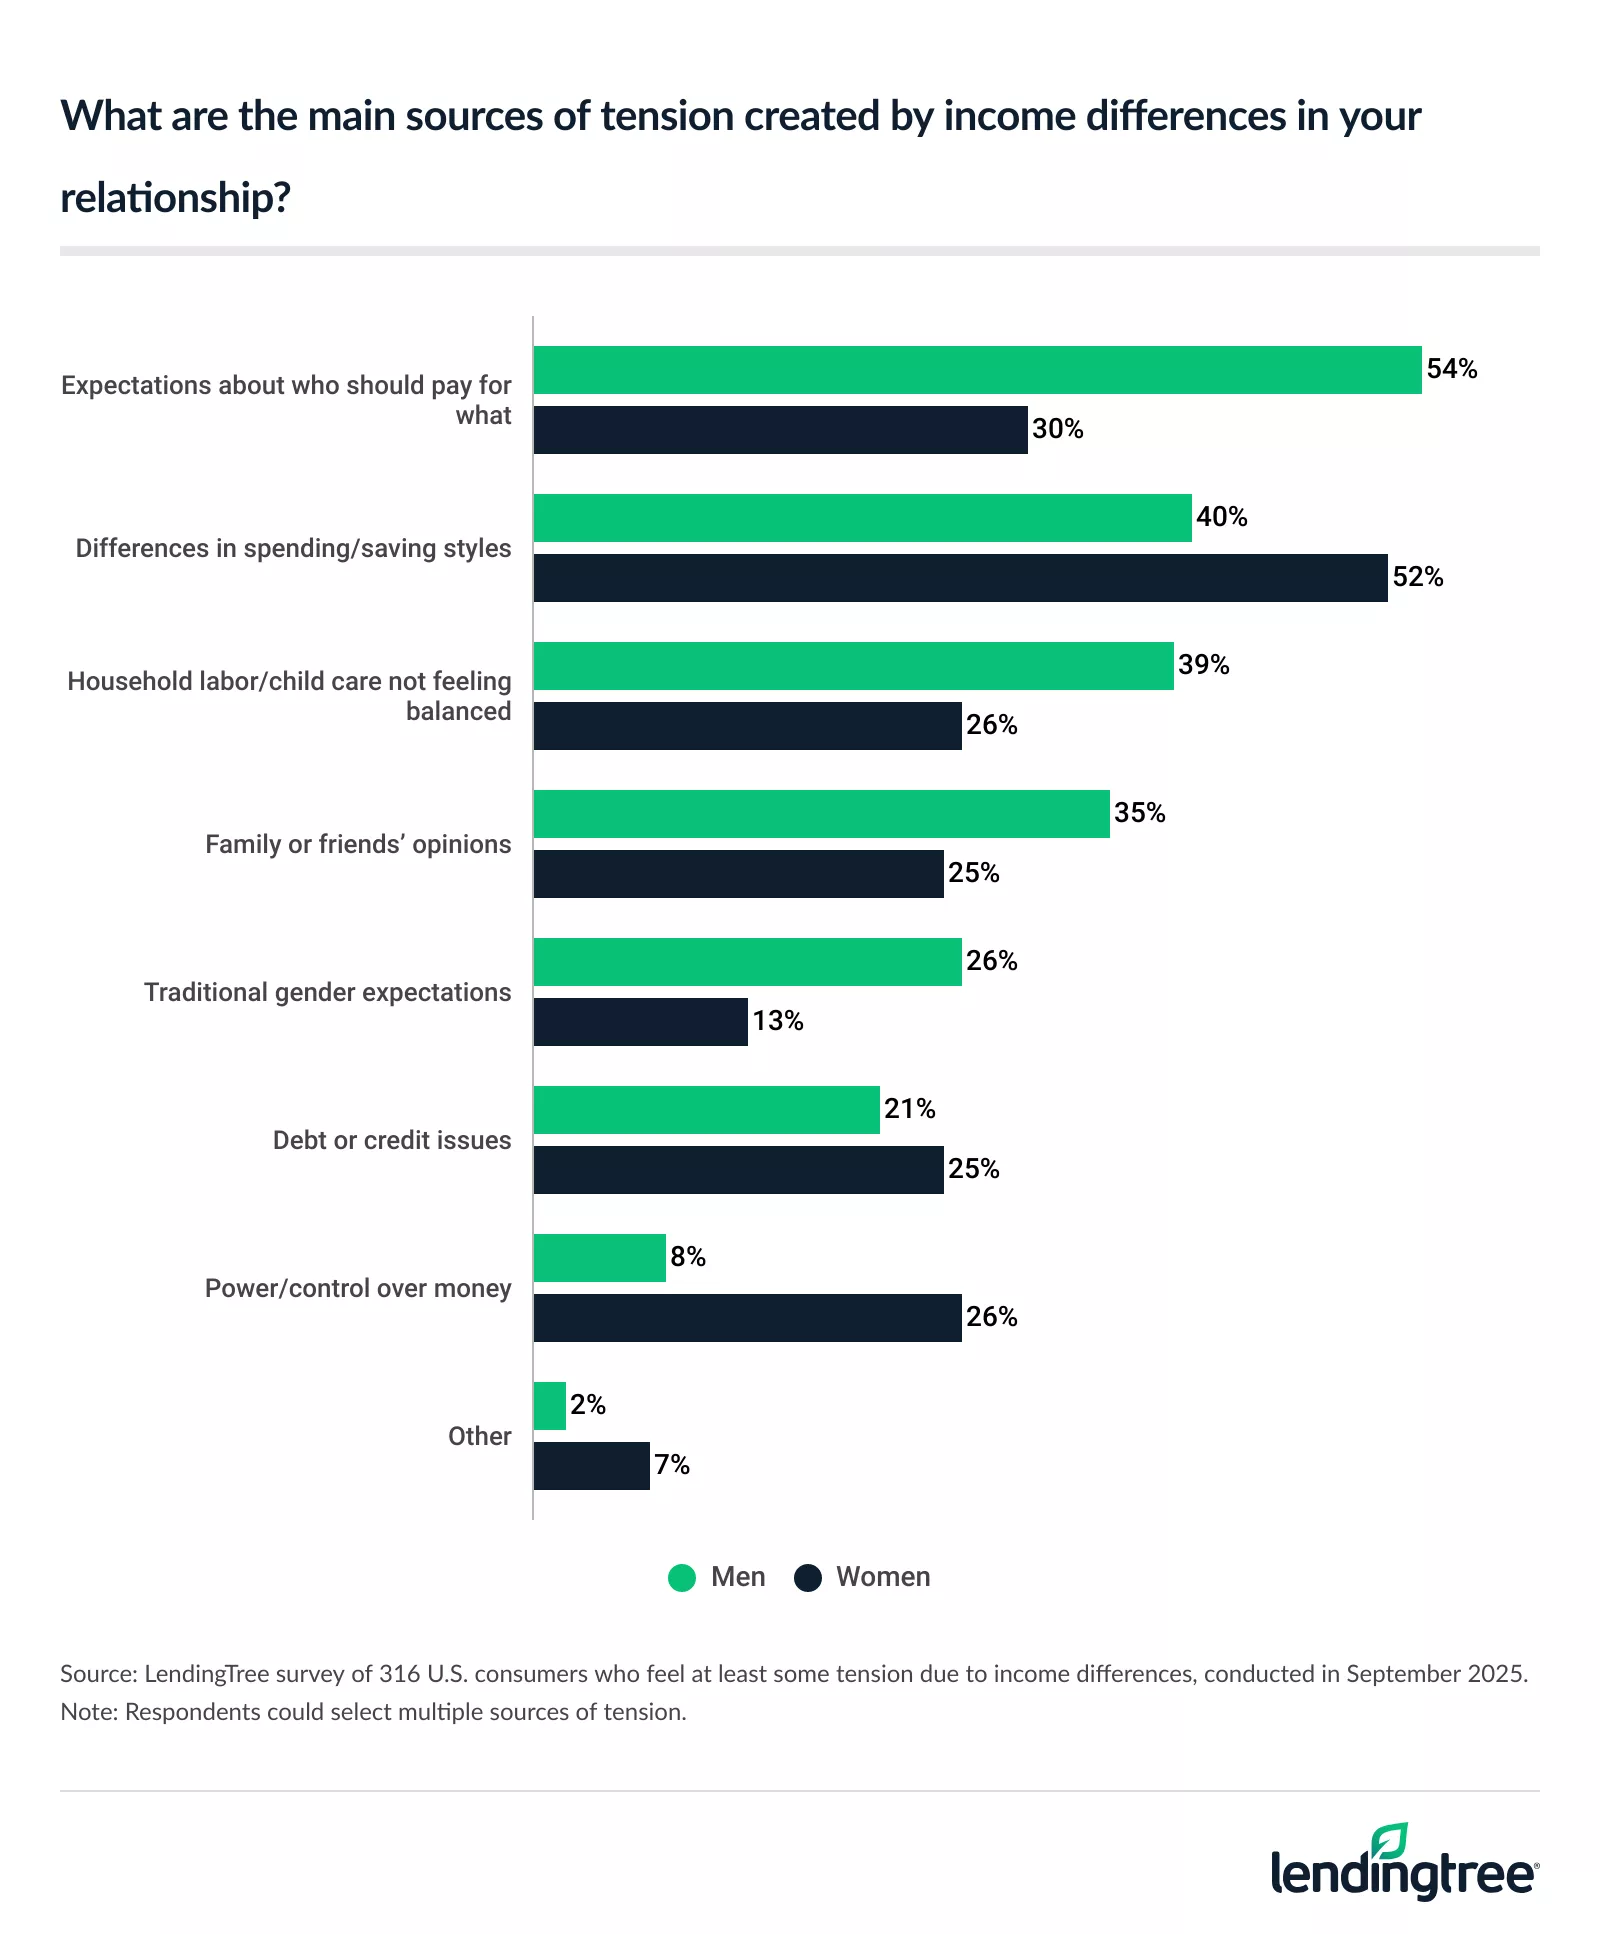
- About 1 in 4 (24%) couples with income differences experience frequent or very frequent conflict as a result. Men are more likely to report tension very often or often (32%) than women (14%). Of those who report at least some tension, women with income differences are most likely to say the main source is spending and saving style conflicts (52%). Meanwhile, men with income differences are most likely to say it’s expectations about who should pay for what (54%).
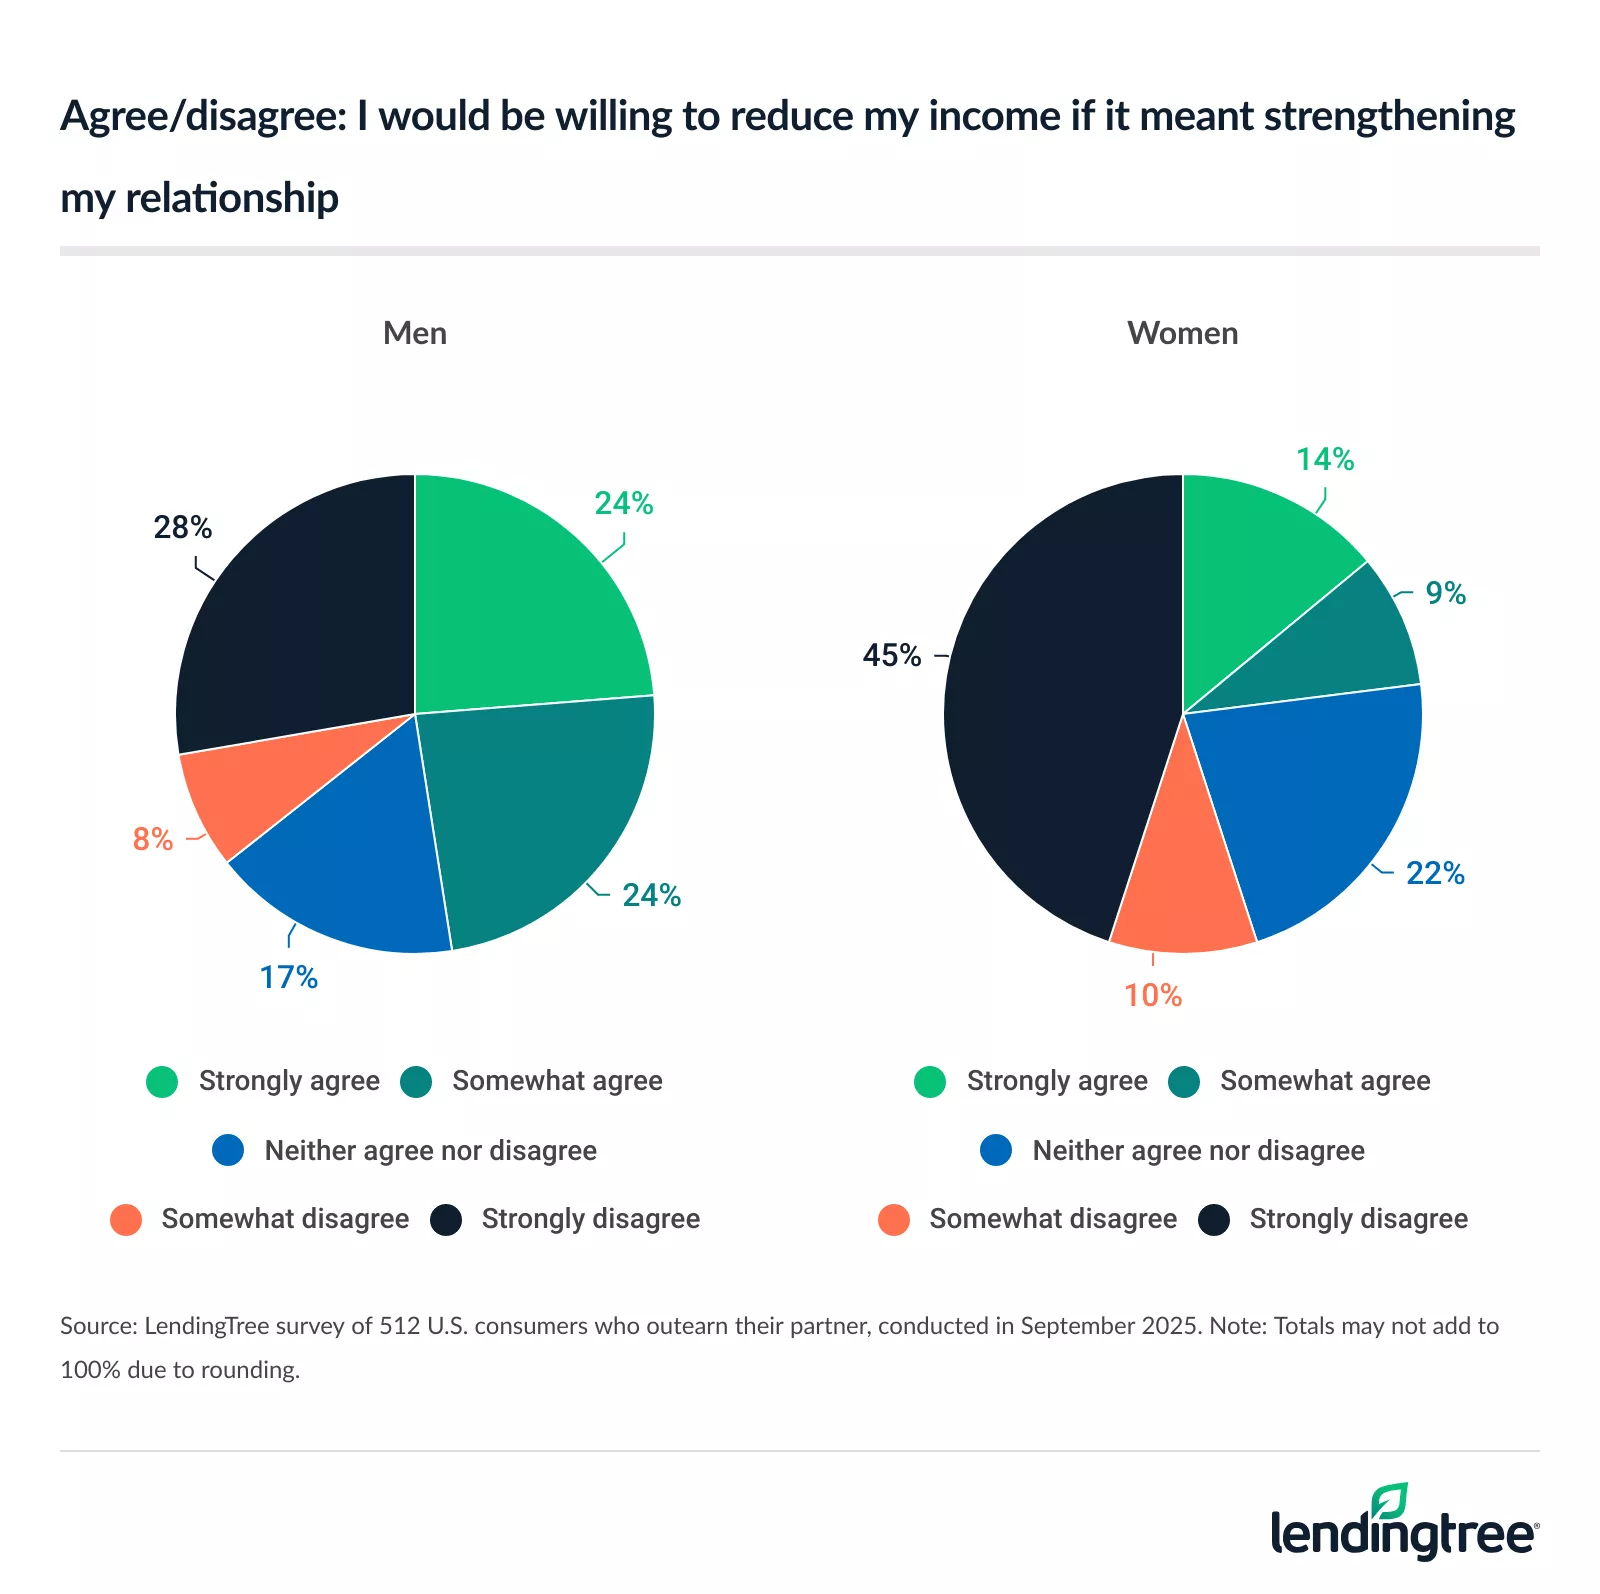
- Women who bring home the bigger paycheck aren’t shrinking their success. Among those who report earning more than their partner, just 32% of women feel proud they earn more, versus 41% of men. However, only 18% of these higher-earning women feel pressure to downplay their salary, compared with 27% of men. When it comes to love, only 23% of women who outearn their partner would take a pay cut for a relationship, far lower than the 48% of outearning men who would.
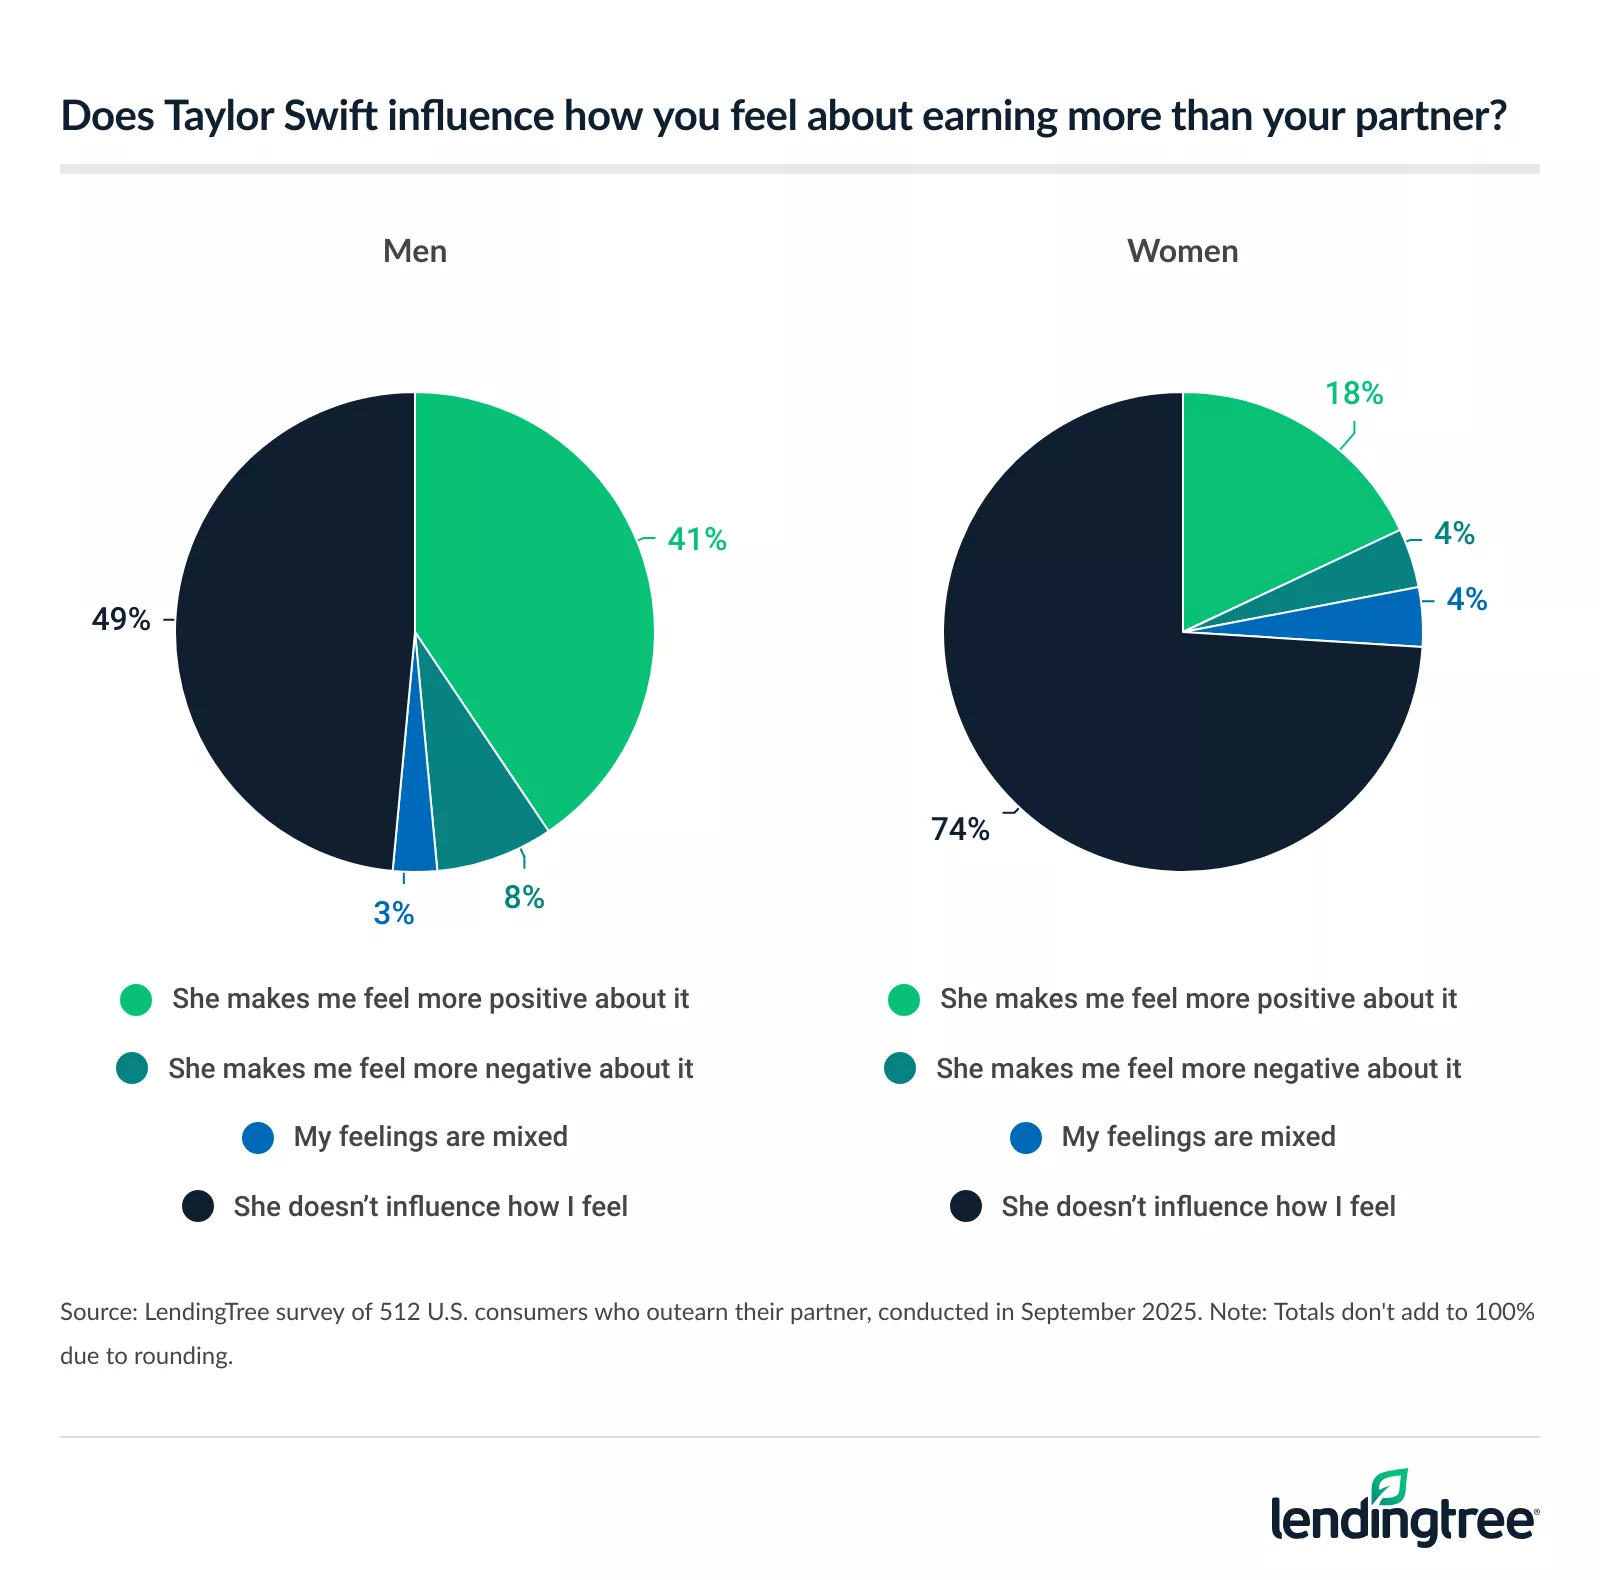
- Taylor Swift is helping shift gender norms around earning. Higher-earning men are more than twice as likely as higher-earning women to say Swift positively influences their views on outearning a partner (41% versus 18%). Among those who feel influenced by her, the top takeaways are messages about independence and ambition (54%), normalizing women as higher earners (42%) and role-modeling career success (38%).
Across the largest 100 metros, 25.7% of women outearn their partners
Across the 100 largest metros where data is available, women outearn their partners in only about 1 in 4 (25.7%) coupled households, on average.
By metro, New Haven, Conn., has the highest percentage of women outearning men, doing so in 29.7% of coupled households. Syracuse, N.Y. (29.5%) follows, with Minneapolis and Providence, R.I. (both at 28.9%), tying for third.
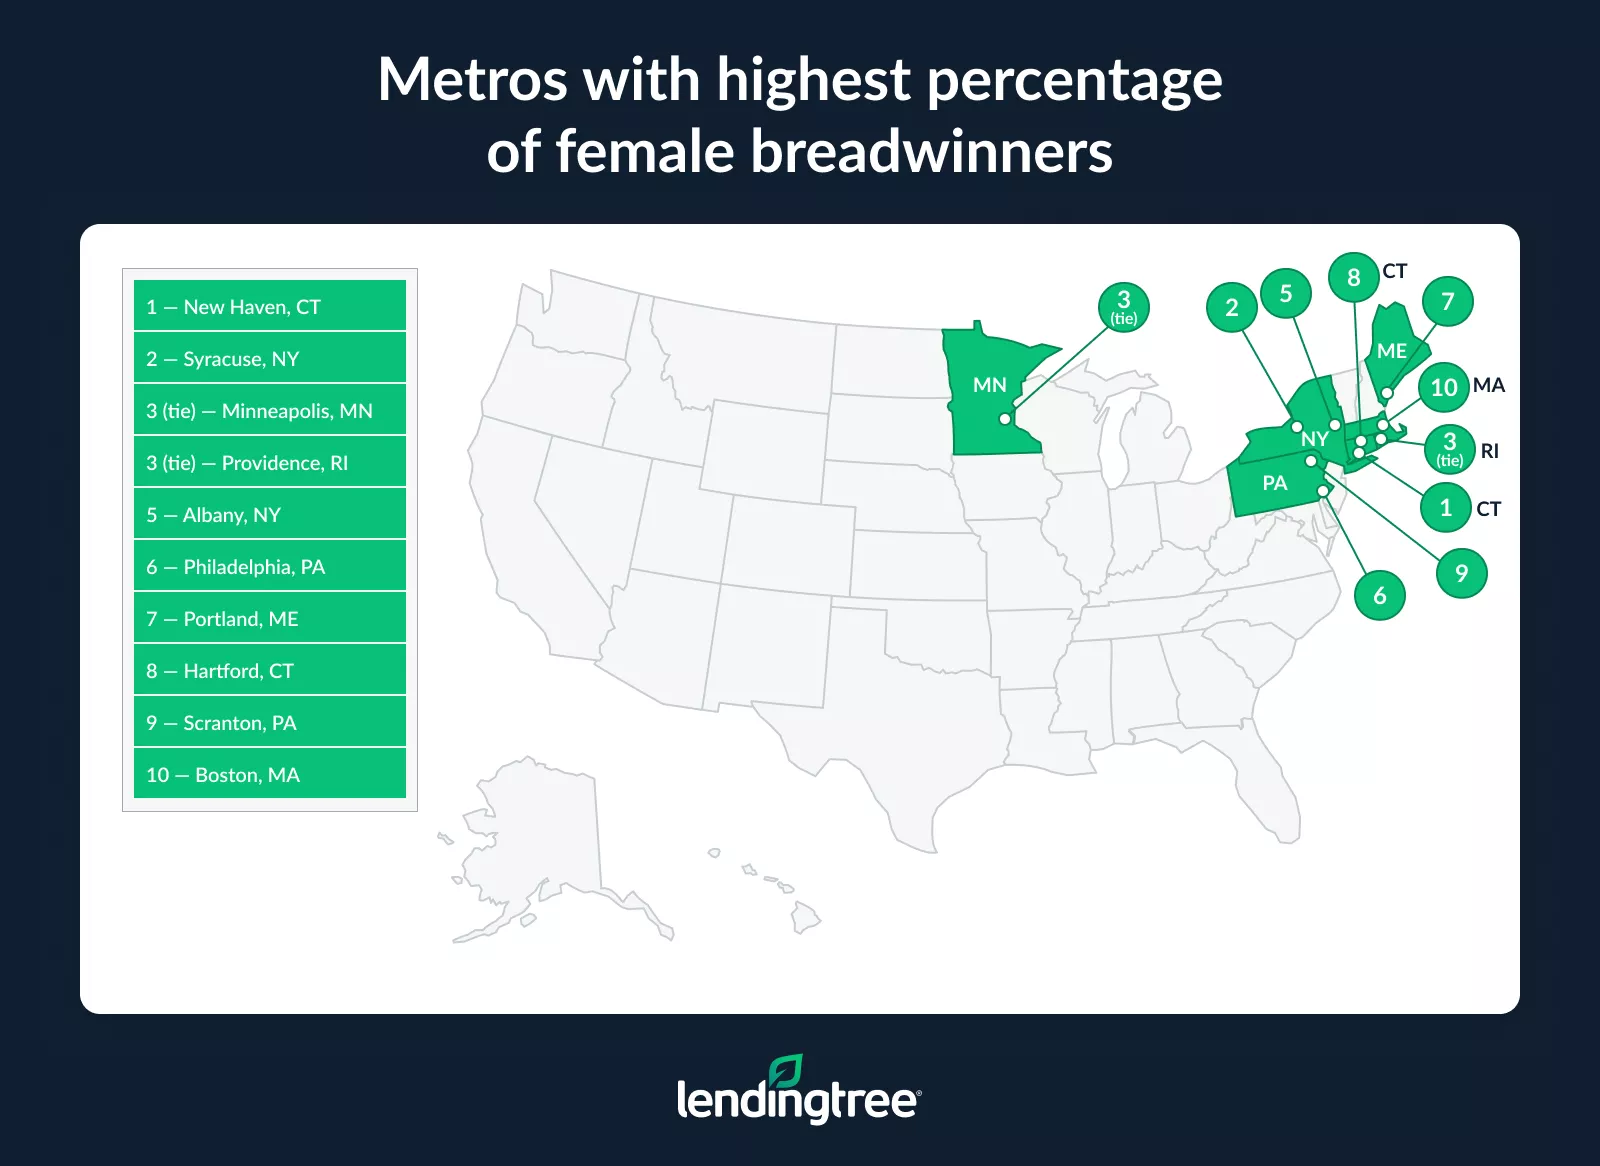
In total, nine of the top 10 metros are in the Northeast.
On the other end of the list, conservative Utah metros rank last: In Provo, just 16.8% of women outearn their partner in coupled households, followed by Ogden (18.7%). McAllen, Texas (20.4%), another more conservative-leaning area, follows.
When women outearn their partners, they have significantly higher average earnings than their male counterparts. In households where women earn more than their partners, they make an average of $76,864, while men in those same households make an average of $29,650. That difference is greatest in:
- San Jose, Calif., where outearning women make $143,143 on average, while men in these relationships make $58,018
- San Francisco: $130,412 versus $49,920
- Bridgeport, Conn.: $115,069 versus $39,449
Notably, two of the metros where women are least likely to outearn their partners are also the metros with the smallest differences in outearning women’s salaries compared to their partners. El Paso, Texas, ranks first, with higher-earning women making $53,096 on average and men in these relationships making $20,700. That’s followed by McAllen ($49,441 versus $15,909) and Provo ($59,084 versus $24,058).
Full rankings: Metros with highest percentage of female breadwinners
| Rank | Metro | % of female breadwinners |
|---|---|---|
| 1 | New Haven, CT | 29.7% |
| 2 | Syracuse, NY | 29.5% |
| 3 | Minneapolis, MN | 28.9% |
| 3 | Providence, RI | 28.9% |
| 5 | Albany, NY | 28.8% |
| 6 | Philadelphia, PA | 28.7% |
| 7 | Portland, ME | 28.6% |
| 8 | Hartford, CT | 28.5% |
| 9 | Scranton, PA | 28.4% |
| 10 | Boston, MA | 28.3% |
| 11 | Buffalo, NY | 28.2% |
| 12 | New York, NY | 28.1% |
| 12 | Columbus, OH | 28.1% |
| 12 | Rochester, NY | 28.1% |
| 15 | Memphis, TN | 27.9% |
| 16 | Baltimore, MD | 27.7% |
| 17 | Columbia, SC | 27.6% |
| 18 | Richmond, VA | 27.5% |
| 18 | Omaha, NE | 27.5% |
| 18 | Worcester, MA | 27.5% |
| 18 | Dayton, OH | 27.5% |
| 18 | Toledo, OH | 27.5% |
| 23 | Jackson, MS | 27.4% |
| 24 | Denver, CO | 27.3% |
| 24 | Cleveland, OH | 27.3% |
| 24 | Nashville, TN | 27.3% |
| 27 | Washington, DC | 27.2% |
| 28 | Las Vegas, NV | 27.1% |
| 28 | Louisville, KY | 27.1% |
| 30 | San Francisco, CA | 27.0% |
| 30 | Sacramento, CA | 27.0% |
| 30 | Milwaukee, WI | 27.0% |
| 33 | Cincinnati, OH | 26.9% |
| 34 | Atlanta, GA | 26.8% |
| 34 | Pittsburgh, PA | 26.8% |
| 34 | Allentown, PA | 26.8% |
| 37 | St. Louis, MO | 26.7% |
| 37 | Kansas City, MO | 26.7% |
| 37 | Winston-Salem, NC | 26.7% |
| 37 | Akron, OH | 26.7% |
| 41 | Fresno, CA | 26.6% |
| 41 | Bridgeport, CT | 26.6% |
| 43 | Portland, OR | 26.5% |
| 43 | Chattanooga, TN | 26.5% |
| 45 | New Orleans, LA | 26.4% |
| 45 | Little Rock, AR | 26.4% |
| 45 | Harrisburg, PA | 26.4% |
| 48 | Albuquerque, NM | 26.3% |
| 49 | Tampa, FL | 26.2% |
| 49 | Orlando, FL | 26.2% |
| 49 | Jacksonville, FL | 26.2% |
| 49 | Honolulu, HI | 26.2% |
| 53 | Los Angeles, CA | 26.1% |
| 53 | Indianapolis, IN | 26.1% |
| 53 | Raleigh, NC | 26.1% |
| 56 | Spokane, WA | 26.0% |
| 57 | Chicago, IL | 25.9% |
| 58 | Austin, TX | 25.8% |
| 59 | Seattle, WA | 25.6% |
| 59 | Des Moines, IA | 25.6% |
| 61 | Miami, FL | 25.5% |
| 61 | Virginia Beach, VA | 25.5% |
| 63 | Charlotte, NC | 25.3% |
| 63 | Oklahoma City, OK | 25.3% |
| 65 | Greensboro, NC | 25.2% |
| 66 | Deltona, FL | 25.0% |
| 67 | Tulsa, OK | 24.9% |
| 68 | Charleston, SC | 24.8% |
| 68 | Fayetteville, AR | 24.8% |
| 70 | San Antonio, TX | 24.7% |
| 71 | San Diego, CA | 24.6% |
| 71 | Birmingham, AL | 24.6% |
| 71 | Tucson, AZ | 24.6% |
| 71 | Reno, NV | 24.6% |
| 75 | Lakeland, FL | 24.4% |
| 75 | Wichita, KS | 24.4% |
| 77 | Dallas, TX | 24.3% |
| 77 | Stockton, CA | 24.3% |
| 77 | Colorado Springs, CO | 24.3% |
| 77 | Palm Bay, FL | 24.3% |
| 81 | Grand Rapids, MI | 24.2% |
| 82 | Detroit, MI | 24.1% |
| 82 | Boise, ID | 24.1% |
| 84 | Oxnard, CA | 24.0% |
| 85 | Knoxville, TN | 23.9% |
| 86 | Phoenix, AZ | 23.8% |
| 87 | Greenville, SC | 23.7% |
| 88 | Houston, TX | 23.2% |
| 89 | San Jose, CA | 23.1% |
| 90 | Riverside, CA | 22.8% |
| 90 | Baton Rouge, LA | 22.8% |
| 92 | Salt Lake City, UT | 22.5% |
| 93 | Bakersfield, CA | 22.1% |
| 94 | Cape Coral, FL | 21.9% |
| 95 | El Paso, TX | 21.6% |
| 96 | Augusta, GA | 21.5% |
| 97 | North Port, FL | 21.4% |
| 98 | McAllen, TX | 20.4% |
| 99 | Ogden, UT | 18.7% |
| 100 | Provo, UT | 16.8% |
Full rankings: Metros with biggest differences in average wages among couples with higher-earning women
| Rank | Metro | Avg. wages of women in opposite-sex couples where woman earns more | Avg. wages of men in those couples | Difference |
|---|---|---|---|---|
| 1 | San Jose, CA | $143,143 | $58,018 | $85,125 |
| 2 | San Francisco, CA | $130,412 | $49,920 | $80,492 |
| 3 | Bridgeport, CT | $115,069 | $39,449 | $75,620 |
| 4 | Washington, DC | $115,177 | $47,965 | $67,212 |
| 5 | New York, NY | $101,569 | $37,015 | $64,554 |
| 6 | Boston, MA | $107,653 | $43,259 | $64,394 |
| 7 | Seattle, WA | $104,615 | $41,826 | $62,789 |
| 8 | Los Angeles, CA | $90,357 | $31,900 | $58,457 |
| 9 | Oxnard, CA | $89,039 | $31,227 | $57,812 |
| 10 | San Diego, CA | $92,403 | $35,409 | $56,994 |
| 11 | Denver, CO | $93,817 | $38,314 | $55,503 |
| 12 | Austin, TX | $88,654 | $34,152 | $54,502 |
| 13 | Chicago, IL | $89,664 | $35,290 | $54,374 |
| 13 | Minneapolis, MN | $93,018 | $38,644 | $54,374 |
| 15 | Sacramento, CA | $86,469 | $32,332 | $54,137 |
| 16 | Baltimore, MD | $93,334 | $39,659 | $53,675 |
| 17 | Philadelphia, PA | $89,677 | $36,051 | $53,626 |
| 18 | New Haven, CT | $84,908 | $31,619 | $53,289 |
| 19 | Hartford, CT | $91,121 | $38,145 | $52,976 |
| 20 | Portland, OR | $86,898 | $34,247 | $52,651 |
| 21 | Raleigh, NC | $87,762 | $35,732 | $52,030 |
| 22 | Stockton, CA | $78,495 | $26,469 | $52,026 |
| 23 | Atlanta, GA | $84,147 | $32,372 | $51,775 |
| 24 | Dallas, TX | $84,199 | $32,791 | $51,408 |
| 25 | Fayetteville, AR | $77,758 | $26,730 | $51,028 |
| 26 | Richmond, VA | $85,040 | $34,241 | $50,799 |
| 27 | Worcester, MA | $83,393 | $32,762 | $50,631 |
| 28 | Houston, TX | $80,059 | $30,279 | $49,780 |
| 29 | Reno, NV | $78,259 | $28,664 | $49,595 |
| 30 | Cincinnati, OH | $79,343 | $30,763 | $48,580 |
| 31 | Portland, ME | $76,940 | $28,649 | $48,291 |
| 32 | Providence, RI | $78,464 | $30,206 | $48,258 |
| 33 | Phoenix, AZ | $77,176 | $28,927 | $48,249 |
| 34 | Columbus, OH | $82,239 | $34,513 | $47,726 |
| 35 | Indianapolis, IN | $78,300 | $30,588 | $47,712 |
| 36 | Charleston, SC | $75,446 | $27,941 | $47,505 |
| 37 | Honolulu, HI | $76,413 | $29,276 | $47,137 |
| 38 | Tampa, FL | $73,740 | $26,653 | $47,087 |
| 39 | Omaha, NE | $78,850 | $31,842 | $47,008 |
| 40 | Allentown, PA | $75,249 | $28,553 | $46,696 |
| 41 | Charlotte, NC | $77,813 | $31,193 | $46,620 |
| 42 | Miami, FL | $71,669 | $25,296 | $46,373 |
| 43 | Fresno, CA | $72,659 | $26,457 | $46,202 |
| 44 | Riverside, CA | $72,485 | $26,449 | $46,036 |
| 45 | Detroit, MI | $74,531 | $28,652 | $45,879 |
| 46 | Nashville, TN | $75,068 | $29,614 | $45,454 |
| 47 | Grand Rapids, MI | $75,528 | $30,104 | $45,424 |
| 48 | St. Louis, MO | $76,331 | $30,918 | $45,413 |
| 49 | Las Vegas, NV | $69,451 | $24,159 | $45,292 |
| 50 | Jacksonville, FL | $73,428 | $28,319 | $45,109 |
| 51 | Birmingham, AL | $70,915 | $26,050 | $44,865 |
| 52 | Milwaukee, WI | $76,911 | $32,061 | $44,850 |
| 53 | Cape Coral, FL | $66,250 | $21,649 | $44,601 |
| 54 | Kansas City, MO | $75,453 | $30,965 | $44,488 |
| 55 | North Port, FL | $65,653 | $21,167 | $44,486 |
| 56 | Pittsburgh, PA | $74,104 | $29,631 | $44,473 |
| 57 | Jackson, MS | $69,301 | $24,944 | $44,357 |
| 58 | Colorado Springs, CO | $74,473 | $30,181 | $44,292 |
| 59 | New Orleans, LA | $68,656 | $24,498 | $44,158 |
| 60 | Albuquerque, NM | $69,302 | $25,296 | $44,006 |
| 61 | Spokane, WA | $68,226 | $24,446 | $43,780 |
| 62 | Orlando, FL | $69,818 | $26,120 | $43,698 |
| 63 | Albany, NY | $76,441 | $32,835 | $43,606 |
| 64 | Boise, ID | $66,371 | $23,081 | $43,290 |
| 65 | Cleveland, OH | $72,745 | $29,612 | $43,133 |
| 66 | Akron, OH | $70,728 | $27,651 | $43,077 |
| 67 | Harrisburg, PA | $71,544 | $28,480 | $43,064 |
| 68 | Greenville, SC | $69,050 | $26,042 | $43,008 |
| 69 | Knoxville, TN | $67,046 | $24,131 | $42,915 |
| 70 | Salt Lake City, UT | $74,193 | $31,344 | $42,849 |
| 71 | Deltona, FL | $61,989 | $19,303 | $42,686 |
| 72 | Memphis, TN | $70,544 | $27,927 | $42,617 |
| 73 | Little Rock, AR | $67,924 | $25,631 | $42,293 |
| 74 | Winston-Salem, NC | $65,775 | $23,517 | $42,258 |
| 75 | San Antonio, TX | $69,279 | $27,099 | $42,180 |
| 76 | Louisville, KY | $70,064 | $28,074 | $41,990 |
| 77 | Palm Bay, FL | $65,931 | $24,013 | $41,918 |
| 78 | Chattanooga, TN | $66,195 | $24,339 | $41,856 |
| 79 | Virginia Beach, VA | $71,650 | $29,999 | $41,651 |
| 80 | Buffalo, NY | $70,080 | $28,630 | $41,450 |
| 81 | Oklahoma City, OK | $67,117 | $25,967 | $41,150 |
| 82 | Tucson, AZ | $63,888 | $22,774 | $41,114 |
| 83 | Columbia, SC | $64,579 | $23,665 | $40,914 |
| 84 | Rochester, NY | $68,484 | $27,982 | $40,502 |
| 85 | Baton Rouge, LA | $68,069 | $27,798 | $40,271 |
| 86 | Des Moines, IA | $76,445 | $36,379 | $40,066 |
| 87 | Toledo, OH | $65,786 | $25,872 | $39,914 |
| 88 | Tulsa, OK | $63,024 | $23,199 | $39,825 |
| 89 | Dayton, OH | $67,121 | $27,379 | $39,742 |
| 90 | Greensboro, NC | $62,833 | $23,186 | $39,647 |
| 91 | Ogden, UT | $70,240 | $30,876 | $39,364 |
| 92 | Syracuse, NY | $66,974 | $27,864 | $39,110 |
| 93 | Wichita, KS | $63,911 | $24,876 | $39,035 |
| 94 | Bakersfield, CA | $60,292 | $22,388 | $37,904 |
| 95 | Scranton, PA | $62,021 | $24,127 | $37,894 |
| 96 | Augusta, GA | $63,209 | $25,906 | $37,303 |
| 97 | Lakeland, FL | $56,989 | $21,864 | $35,125 |
| 98 | Provo, UT | $59,084 | $24,058 | $35,026 |
| 99 | McAllen, TX | $49,441 | $15,909 | $33,532 |
| 100 | El Paso, TX | $53,096 | $20,700 | $32,396 |
Tensions can be high in couples with income differences
In a separate survey of 2,000 U.S. consumers, a similar 23% of partnered women say they earn more than their partners. That’s significantly lower than the 66% of men who say the same.
Among women who earn more, 29% make at least 50% more than their partner. For men, this figure is 38%.
Of course, money can lead to conflict. Nearly a quarter (24%) of couples with income differences experience frequent or very frequent conflict as a result. Men are more likely to report tension very often or often (32%) than women (14%).
Money is often a touchy subject in relationships — romantic and otherwise. Other findings in LendingTree surveys include the following:
- 23% of people in relationships have ended one due to financial incompatibility.
- 77% of Americans have financial turnoffs in relationships.
- 30% of Americans have broken up or divorced a partner after having financial issues in a relationship.
- 36% have had a friendship end because of money.
Of those who report at least some relationship tension, women with income differences are most likely to say the main source is spending and saving style conflicts (52%), followed by expectations about who should pay for what (30%). Meanwhile, those answers are flipped among men with income differences: Expectations about who should pay for what (54%) is the most likely answer, with differences in spending and saving styles (40%) ranking second.
According to Matt Schulz, LendingTree chief consumer finance analyst and author of “Ask Questions, Save Money, Make More: How to Take Control of Your Financial Life,” countless people across the country have different incomes and spending patterns than their significant other — and it can cause an incredible amount of tension in those relationships.
“The key to navigating it all is to communicate openly and honestly as much as possible,” he says. “This can make for really awkward conversations across the bar or the kitchen table, but having a discussion about your financial priorities, goals, plans and expectations in advance is way better than having it when something has gone wrong and tensions are sky high.”
Joint credit card accounts and shared financial tools can increase conflict in the short term, but Schulz says that might be a necessary step if there’s a lack of communication between two partners. “If your accounts are connected, there’s less room to hide,” he says. “It means that your partner will have easier access to whatever you spend and may be more likely to ask you about it regularly. Ideally, that transparency will lead to more open and honest conversation about money and eventually greater alignment on financial questions in the future.”
Women feel less pressured to downplay their salaries
Women who outearn their partner aren’t ashamed to admit it, although they’re less likely to feel proud compared to their male counterparts. Among those who report earning more than their partner, 32% of women feel proud they earn more, versus 41% of men.
That said, just 18% of these higher-earning women feel pressure to downplay their salary, compared with 27% of men. And women won’t back down for a partner, either: Just under a quarter (23%) of women who outearn their partner would take a pay cut for a relationship — but a significantly higher 48% of outearning men would.
Men are also more likely to feel that outearning a partner puts the relationship at risk, at 39% of outearning men versus 23% of outearning women.
Dynamics around money may be more likely to shift in relationships with higher-earning women. While 81% of men who earn more did so before their relationship started, just 58% of outearning women say the same. Instead, 33% of women say they started earning more after the relationship started.
Taylor Swift helps promote positivity around outearning partners
When it comes to women earning more than their partners, Taylor Swift is helping shift reputations. In fact, 41% of higher-earning men say Swift positively influences their views on outearning a partner — significantly higher than the 18% of higher-earning women who say similarly.
Among those who feel influenced by Swift, 54% say her messages about independence and ambition impact them — the most common response. Normalizing women as higher earners (42%) and role-modeling career success (38%) follow.
Schulz says it’s hard to overstate the impact that Taylor Swift has had on so many people over the years, so it shouldn’t be any surprise that her immense success, especially as a businesswoman, has helped change views on successful women.
“Far too many people today still believe that men should always be the breadwinner and that women should sacrifice their ambitions in ways that men are rarely called to do,” he says. “The fact that someone as successful and powerful in his own right as Travis Kelce doesn’t appear to be threatened by the stratospheric fame and the colossal wealth of Taylor Swift has surely made some people reconsider why they would be threatened by their own partners’ higher incomes. That’s a good thing.”
Navigating income differences: Top expert tips
Financial conversations can be difficult to have, especially if there’s a power imbalance between partners. To help navigate those conversations and prevent tension, we offer the following advice:
- Don’t overlook the importance of communication, or lack thereof. “No one should expect their partner to agree with them on everything to do with money, nor should they expect every money conversation to be filled with joy and laughter,” Schulz says. “However, if your partner won’t ever talk about money with you or gets angry every time you broach the topic, it’s not something to be ignored.”
- It’s about everyone doing their part, but that doesn’t mean that everyone pays equally. “If my wife were one of the biggest stars and wealthiest people on the planet, it would make no sense for us to split costs and savings goals equally,” he says. “The same can be true even if the earnings gap is significantly smaller. What is most important is that both partners are comfortable with what they and their partner are contributing to the team. It may take some negotiation and compromise to get to that point, and your arrangement may look quite different from those of your friends and relatives, but it’s important to get there. If you don’t, resentment and anger can fester.”
- Remember to revisit your plans regularly. Financial dynamics can shift often, especially when one partner’s income or career trajectory changes. What felt fair or sustainable last year may not feel the same today. Setting aside time regularly to review shared goals, spending habits and savings contributions can go a long way toward making sure you’re on the same page.
Methodology
LendingTree analysts used U.S. Census Bureau 2023 American Community Survey (ACS) microdata with five-year estimates via Integrated Public Use Microdata Series (IPUMS) to calculate the share of opposite-sex householder couples (married or unmarried) in which the female partner’s wage-and-salary income exceeded the male partner’s. Results are limited to noninstitutional households across the 100 largest U.S. metros where data is available.
We also calculated the average wages among women and men in these households where the female partner earned more.
Additionally, LendingTree commissioned QuestionPro to conduct an online survey of 2,000 U.S. consumers aged 18 to 79 from Sept. 12 to 15, 2025. The survey was administered using a nonprobability-based sample, and quotas were used to ensure the sample base represented the overall population. Researchers reviewed all responses for quality control.
We defined generations as the following ages in 2025:
- Generation Z: 18 to 28
- Millennials: 29 to 44
- Generation X: 45 to 60
- Baby boomers: 61 to 79