Fast Food, Slow Pay: Fast Food Workers Can’t Afford the Basics in Every Large U.S. Metro


Fast food employees, once hailed by the U.S. government as essential workers, face the harsh reality that they can’t afford to make ends meet in the nation’s largest metros. Even working full time, they fall significantly short of earning a living wage and would need to work up to 78 hours a week to cover basic living expenses.
Forget the basics — fast food workers in these metros can’t afford to eat the meals they serve. It takes them more than two times longer than their neighbors on average to buy a typical flagship fast food meal.
Here’s what we found.
Key findings
- Even if they work 40 hours a week for 52 weeks a year, fast food workers can’t cover their basic expenses in any of the 50 largest metros. Depending on where they live, full-time fast food workers earn between 23.0% (in Fresno, Calif.) and 48.4% (in Atlanta) less than the living wage — based on an average hourly wage of $15.07 — and would need to work 52 to 78 hours a week to make ends meet. 39.9% of fast food workers are full time, while 60.1% are part time, so their needs can vary drastically.
- Fast food employees need to work more than twice as long as those earning average wages to buy a typical fast food meal. Employees earning the average U.S. wage would need to work 21.2 minutes to cover the cost of a flagship fast food meal ($11.56 on average across the 50 largest metros), while fast food workers would need to work 46.0 minutes to pay for the same meal. The percentage gap in time is largest in San Jose, Calif., Washington, D.C., and Atlanta.
- The average cost of a flagship fast food meal is highest in San Francisco and lowest in Columbus, Ohio. Factoring in the flagship meal from Burger King, Chick-fil-A, McDonald’s, Taco Bell and Wendy’s across the 50 biggest metros, the average meal cost is $13.88 in San Francisco and $10.01 in Columbus.
A close look at fast food workers
| Avg. hourly wage | $15.07 |
| All workers | |
| Avg. hours worked weekly | 27 |
| Avg. weekly wage | $406.89 |
| Full-time workers | |
| Avg. hours worked weekly | 38 |
| Avg. weekly wage | $572.66 |
| % of workers | 39.9% |
| Part-time workers | |
| Avg. hours worked weekly | 20 |
| Avg. weekly wage | $301.40 |
| % of workers | 60.1% |
Fast food workers can’t cover basic expenses
Even working full time without taking sick or vacation days, fast food workers fall significantly short of earning a living wage in the nation’s 50 largest metros.
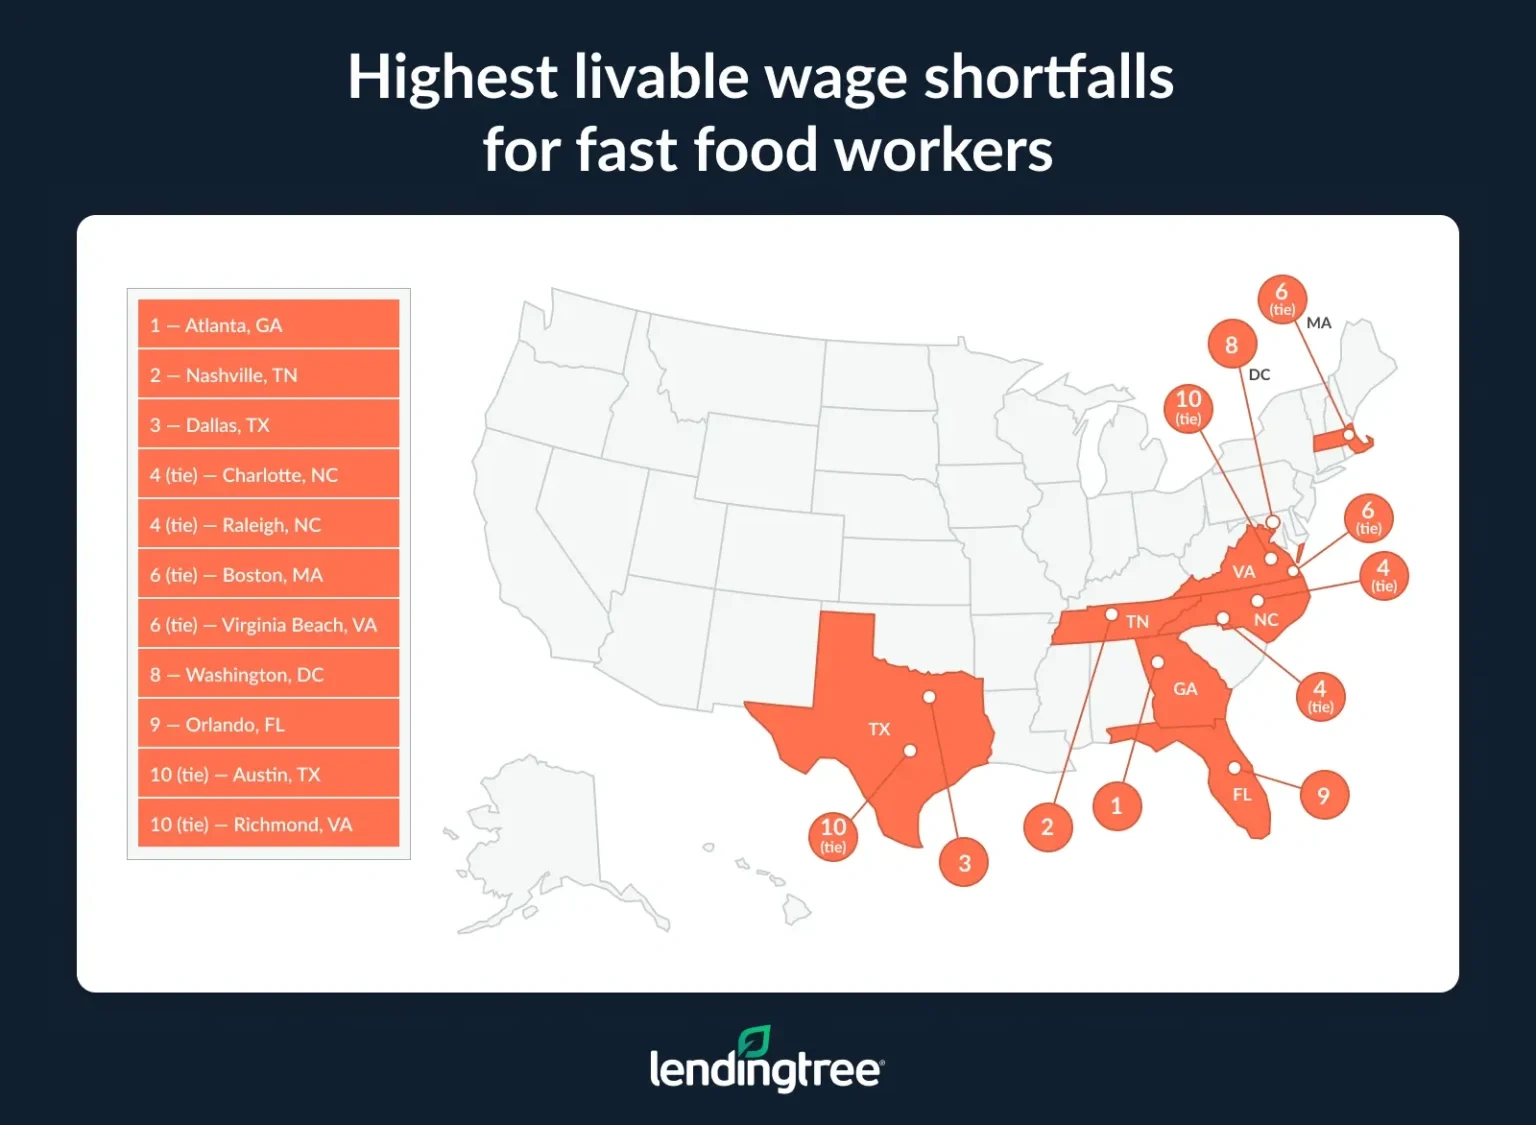
Atlanta has the dubious distinction of the highest living wage gap for fast food workers across all U.S. metros at 48.4%, but the outlook is similarly bleak elsewhere.
Across the 10 areas with the highest livable wage shortfalls, fast food workers face a living wage gap above 42% and would need to work 70+ hours a week to afford basic living expenses. That’s a 10-hour workday, 365 days a year.
Even in Fresno, where workers face the smallest livable wage gap at 23.0%, fast food employees would have to work more than 50 hours a week just to earn enough to live — assuming their managers approve the overtime.
LendingTree chief consumer finance analyst Matt Schulz calls this data “troubling” and points to rising costs of living and lagging wage increases as the cause. “No one has ever expected to get rich off of fast food wages, but the fact that these workers can’t even expect a livable wage is troubling. Unfortunately, the situation isn’t likely to get better anytime soon.”
Fast food workers are in good company. More than 1 in 3 U.S. households are financially insecure as Americans across the country struggle to pay for basic expenses.
Full rankings: Livable wage shortfalls for fast food workers: Highest to lowest
| Rank | Metro | Avg. annual wage | Livable wage (before taxes) | Livable wage shortfall ($) | Livable wage shortfall (%) | Weekly hours needed to meet livable wage |
|---|---|---|---|---|---|---|
| 1 | Atlanta, GA | $28,180 | $54,656 | -$26,476 | 48.4% | 78 |
| 2 | Nashville, TN | $29,380 | $53,090 | -$23,710 | 44.7% | 72 |
| 3 | Dallas, TX | $28,040 | $49,639 | -$21,599 | 43.5% | 71 |
| 4 | Charlotte, NC | $29,680 | $52,433 | -$22,753 | 43.4% | 71 |
| 4 | Raleigh, NC | $30,440 | $53,793 | -$23,353 | 43.4% | 71 |
| 6 | Boston, MA | $36,250 | $63,942 | -$27,692 | 43.3% | 71 |
| 6 | Virginia Beach, VA | $29,750 | $52,431 | -$22,681 | 43.3% | 70 |
| 8 | Washington, DC | $34,630 | $60,840 | -$26,210 | 43.1% | 70 |
| 9 | Orlando, FL | $29,520 | $51,527 | -$22,007 | 42.7% | 70 |
| 10 | Austin, TX | $29,300 | $51,074 | -$21,774 | 42.6% | 70 |
| 10 | Richmond, VA | $30,110 | $52,431 | -$22,321 | 42.6% | 70 |
| 12 | Houston, TX | $26,580 | $46,139 | -$19,559 | 42.4% | 69 |
| 12 | Birmingham, AL | $26,070 | $45,239 | -$19,169 | 42.4% | 69 |
| 14 | Salt Lake City, UT | $29,090 | $50,246 | -$21,156 | 42.1% | 69 |
| 15 | Oklahoma City, OK | $25,330 | $43,568 | -$18,238 | 41.9% | 69 |
| 16 | Miami, FL | $30,410 | $51,866 | -$21,456 | 41.4% | 68 |
| 17 | San Jose, CA | $43,330 | $73,375 | -$30,045 | 40.9% | 68 |
| 18 | Philadelphia, PA | $31,310 | $52,367 | -$21,057 | 40.2% | 67 |
| 18 | Jacksonville, FL | $28,990 | $48,476 | -$19,486 | 40.2% | 67 |
| 20 | San Diego, CA | $38,250 | $63,876 | -$25,626 | 40.1% | 67 |
| 21 | Tampa, FL | $29,960 | $49,532 | -$19,572 | 39.5% | 66 |
| 22 | New York, NY | $36,400 | $60,040 | -$23,640 | 39.4% | 66 |
| 23 | Pittsburgh, PA | $28,030 | $46,195 | -$18,165 | 39.3% | 66 |
| 24 | Memphis, TN | $27,290 | $44,794 | -$17,504 | 39.1% | 66 |
| 25 | Las Vegas, NV | $30,730 | $50,133 | -$19,403 | 38.7% | 65 |
| 26 | Louisville, KY | $28,230 | $45,144 | -$16,914 | 37.5% | 64 |
| 27 | San Antonio, TX | $27,700 | $43,971 | -$16,271 | 37.0% | 63 |
| 28 | Kansas City, MO | $29,840 | $47,317 | -$17,477 | 36.9% | 63 |
| 28 | Grand Rapids, MI | $29,550 | $46,859 | -$17,309 | 36.9% | 63 |
| 30 | Columbus, OH | $29,630 | $46,634 | -$17,004 | 36.5% | 63 |
| 31 | Baltimore, MD | $33,050 | $51,668 | -$18,618 | 36.0% | 63 |
| 32 | Portland, OR | $36,640 | $57,137 | -$20,497 | 35.9% | 62 |
| 33 | Phoenix, AZ | $34,310 | $53,433 | -$19,123 | 35.8% | 62 |
| 34 | Chicago, IL | $33,390 | $51,752 | -$18,362 | 35.5% | 62 |
| 35 | Los Angeles, CA | $39,000 | $60,077 | -$21,077 | 35.1% | 62 |
| 36 | Indianapolis, IN | $29,140 | $44,804 | -$15,664 | 35.0% | 62 |
| 37 | Riverside, CA | $38,290 | $58,775 | -$20,485 | 34.9% | 61 |
| 38 | Providence, RI | $33,190 | $50,645 | -$17,455 | 34.5% | 61 |
| 39 | Milwaukee, WI | $28,830 | $43,832 | -$15,002 | 34.2% | 61 |
| 40 | San Francisco, CA | $42,980 | $64,286 | -$21,306 | 33.1% | 60 |
| 41 | Seattle, WA | $41,060 | $61,241 | -$20,181 | 33.0% | 60 |
| 42 | Detroit, MI | $29,830 | $44,156 | -$14,326 | 32.4% | 59 |
| 43 | Cincinnati, OH | $29,250 | $43,203 | -$13,953 | 32.3% | 59 |
| 44 | Cleveland, OH | $29,240 | $43,010 | -$13,770 | 32.0% | 59 |
| 45 | Sacramento, CA | $39,550 | $57,118 | -$17,568 | 30.8% | 58 |
| 46 | Minneapolis, MN | $33,620 | $48,195 | -$14,575 | 30.2% | 57 |
| 47 | Hartford, CT | $34,890 | $49,819 | -$14,929 | 30.0% | 57 |
| 48 | St. Louis, MO | $31,590 | $44,948 | -$13,358 | 29.7% | 57 |
| 49 | Buffalo, NY | $34,330 | $45,214 | -$10,884 | 24.1% | 53 |
| 50 | Fresno, CA | $37,390 | $48,567 | -$11,177 | 23.0% | 52 |
Fast food employees work twice as long to afford a fast food meal
In an ironic twist, fast food workers can’t afford to eat the meals they serve. They need to clock in for twice as long as people earning an average wage to buy a flagship fast food meal.
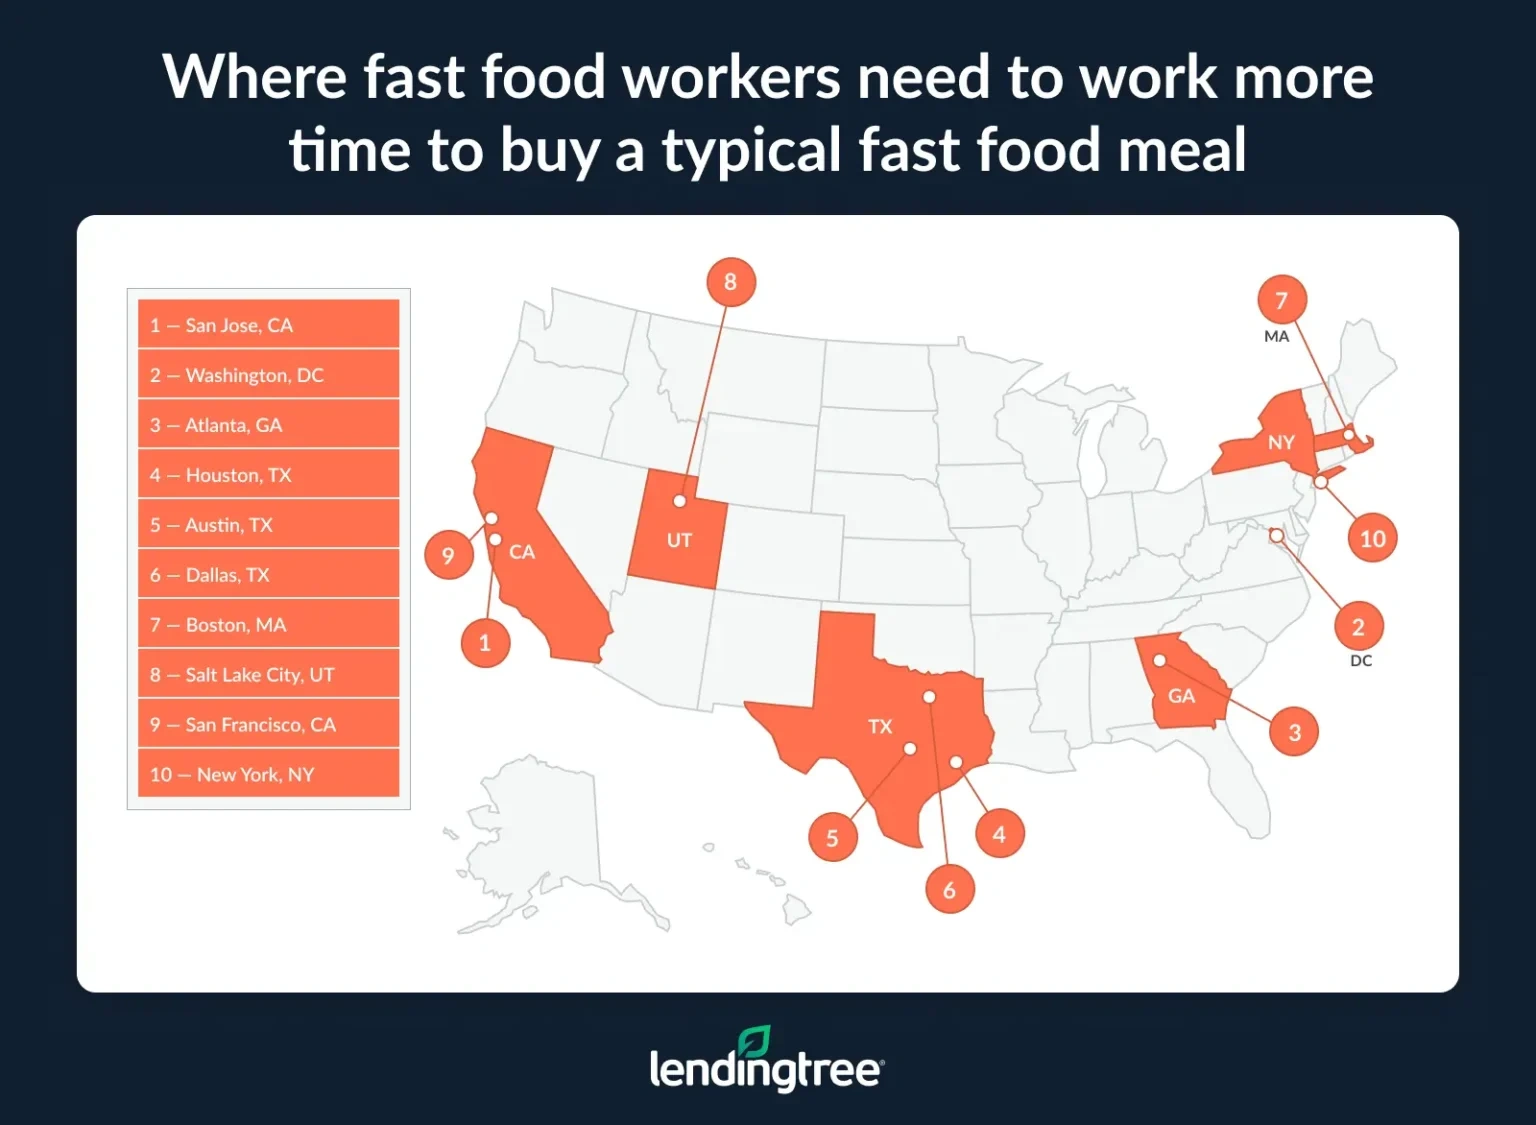
San Jose fast food workers face the highest percentage gap in minutes, working 179.9% longer than their neighbors to earn enough to cover a fast food meal. Washington, D.C. (160.6%), and Atlanta (149.5%) trail closely behind.
But fast food workers face wage disparity across all 50 metros. Even in Fresno, where the percentage gap is smallest, they work 66.5% longer than people earning the average area wage to pay for the same food.
Even if fast food workers in the largest metros wanted to eat all of their meals at work, they couldn’t afford to — eating three meals a day, seven days a week at their job would cost 40.3% of their salary on average, leaving them with less than 60% of their paycheck to live on.
By comparison, workers earning the average U.S. wage would spend 18.6% of their salary eating only fast food meals.
Full rankings: Where fast food workers need to work more time to buy a typical fast food meal: Highest to lowest
| Rank | Metro | Avg. hourly wage, fast food workers | Avg. hourly wage, all occupations | Avg. cost of fast food meal | Minutes worked for meal, fast food workers | Minutes worked for meal, all occupations | Difference (minutes) | More time (%) |
|---|---|---|---|---|---|---|---|---|
| 1 | San Jose, CA | $20.83 | $58.25 | $13.03 | 37.5 | 13.4 | 24.1 | 179.9% |
| 2 | Washington, DC | $16.65 | $43.47 | $12.29 | 44.3 | 17.0 | 27.3 | 160.6% |
| 3 | Atlanta, GA | $13.55 | $33.73 | $11.03 | 48.9 | 19.6 | 29.3 | 149.5% |
| 4 | Houston, TX | $12.78 | $31.87 | $10.51 | 49.3 | 19.8 | 29.5 | 149.0% |
| 5 | Austin, TX | $14.09 | $34.32 | $10.42 | 44.4 | 18.2 | 26.2 | 144.0% |
| 6 | Dallas, TX | $13.48 | $32.89 | $11.13 | 49.5 | 20.3 | 29.2 | 143.8% |
| 7 | Boston, MA | $17.43 | $41.85 | $12.25 | 42.2 | 17.6 | 24.6 | 139.8% |
| 8 | Salt Lake City, UT | $13.99 | $33.38 | $11.09 | 47.6 | 19.9 | 27.7 | 139.2% |
| 9 | San Francisco, CA | $20.67 | $48.15 | $13.88 | 40.3 | 17.3 | 23.0 | 132.9% |
| 10 | New York, NY | $17.50 | $40.65 | $13.33 | 45.7 | 19.7 | 26.0 | 132.0% |
| 11 | Oklahoma City, OK | $12.18 | $27.95 | $10.64 | 52.4 | 22.8 | 29.6 | 129.8% |
| 12 | Charlotte, NC | $14.27 | $32.55 | $10.73 | 45.1 | 19.8 | 25.3 | 127.8% |
| 13 | Baltimore, MD | $15.89 | $35.95 | $11.66 | 44.0 | 19.5 | 24.5 | 125.6% |
| 14 | Detroit, MI | $14.34 | $32.29 | $10.72 | 44.8 | 19.9 | 24.9 | 125.1% |
| 15 | Milwaukee, WI | $13.86 | $31.18 | $11.06 | 47.9 | 21.3 | 26.6 | 124.9% |
| 15 | Birmingham, AL | $12.54 | $28.14 | $10.95 | 52.4 | 23.3 | 29.1 | 124.9% |
| 17 | Pittsburgh, PA | $13.48 | $30.22 | $11.41 | 50.8 | 22.6 | 28.2 | 124.8% |
| 18 | Raleigh, NC | $14.64 | $32.70 | $10.79 | 44.2 | 19.8 | 24.4 | 123.2% |
| 19 | Philadelphia, PA | $15.05 | $33.47 | $12.05 | 48.0 | 21.6 | 26.4 | 122.2% |
| 20 | Cleveland, OH | $14.06 | $31.12 | $10.68 | 45.6 | 20.6 | 25.0 | 121.4% |
| 21 | Columbus, OH | $14.24 | $31.39 | $10.01 | 42.2 | 19.1 | 23.1 | 120.9% |
| 22 | Richmond, VA | $14.48 | $31.78 | $11.16 | 46.3 | 21.1 | 25.2 | 119.4% |
| 23 | Seattle, WA | $19.74 | $43.16 | $13.48 | 41.0 | 18.7 | 22.3 | 119.3% |
| 24 | Nashville, TN | $14.12 | $30.92 | $10.65 | 45.3 | 20.7 | 24.6 | 118.8% |
| 25 | Cincinnati, OH | $14.06 | $30.78 | $10.40 | 44.4 | 20.3 | 24.1 | 118.7% |
| 26 | Miami, FL | $14.62 | $31.88 | $11.31 | 46.4 | 21.3 | 25.1 | 117.8% |
| 27 | Indianapolis, IN | $14.01 | $30.25 | $10.02 | 42.9 | 19.9 | 23.0 | 115.6% |
| 28 | Hartford, CT | $16.78 | $36.14 | $12.52 | 44.8 | 20.8 | 24.0 | 115.4% |
| 29 | Tampa, FL | $14.40 | $30.93 | $10.85 | 45.2 | 21.0 | 24.2 | 115.2% |
| 29 | Minneapolis, MN | $16.17 | $34.73 | $11.41 | 42.4 | 19.7 | 22.7 | 115.2% |
| 31 | Kansas City, MO | $14.34 | $30.78 | $11.81 | 49.4 | 23.0 | 26.4 | 114.8% |
| 31 | San Antonio, TX | $13.32 | $28.58 | $10.92 | 49.2 | 22.9 | 26.3 | 114.8% |
| 33 | Chicago, IL | $16.05 | $34.42 | $12.44 | 46.5 | 21.7 | 24.8 | 114.3% |
| 34 | Jacksonville, FL | $13.94 | $29.86 | $11.07 | 47.7 | 22.3 | 25.4 | 113.9% |
| 35 | Louisville, KY | $13.57 | $29.00 | $11.00 | 48.7 | 22.8 | 25.9 | 113.6% |
| 36 | Memphis, TN | $13.12 | $27.96 | $10.83 | 49.5 | 23.2 | 26.3 | 113.4% |
| 37 | Virginia Beach, VA | $14.30 | $30.14 | $11.05 | 46.4 | 22.0 | 24.4 | 110.9% |
| 38 | Portland, OR | $17.61 | $36.77 | $11.34 | 38.6 | 18.5 | 20.1 | 108.6% |
| 39 | San Diego, CA | $18.39 | $37.85 | $13.04 | 42.6 | 20.7 | 21.9 | 105.8% |
| 40 | Orlando, FL | $14.19 | $28.95 | $10.72 | 45.3 | 22.2 | 23.1 | 104.1% |
| 41 | Grand Rapids, MI | $14.21 | $28.89 | $10.53 | 44.4 | 21.9 | 22.5 | 102.7% |
| 42 | Providence, RI | $15.96 | $32.21 | $12.06 | 45.3 | 22.5 | 22.8 | 101.3% |
| 43 | St. Louis, MO | $15.19 | $30.57 | $11.44 | 45.2 | 22.5 | 22.7 | 100.9% |
| 44 | Phoenix, AZ | $16.50 | $32.47 | $11.89 | 43.2 | 22.0 | 21.2 | 96.4% |
| 45 | Los Angeles, CA | $18.75 | $36.64 | $13.45 | 43.1 | 22.0 | 21.1 | 95.9% |
| 46 | Sacramento, CA | $19.02 | $36.66 | $13.21 | 41.7 | 21.6 | 20.1 | 93.1% |
| 47 | Las Vegas, NV | $14.78 | $28.43 | $11.39 | 46.2 | 24.0 | 22.2 | 92.5% |
| 48 | Buffalo, NY | $16.50 | $31.54 | $12.15 | 44.2 | 23.1 | 21.1 | 91.3% |
| 49 | Riverside, CA | $18.41 | $30.90 | $13.01 | 42.4 | 25.3 | 17.1 | 67.6% |
| 50 | Fresno, CA | $17.97 | $29.92 | $12.97 | 43.3 | 26.0 | 17.3 | 66.5% |
Average cost of fast food meal is highest in San Francisco, lowest in Columbus, Ohio
Fast food meals with prices in the single digits may soon be a thing of the past, especially in the largest U.S. metros, where prices are putting them out of reach for many Americans. The average flagship fast food meal costs $11.56 across the largest metros, with San Francisco leading the pack at $13.88.
Even in Columbus, where fast food is cheapest, the average fast food meal rings up at $10.01 — just passing that double-digit threshold.
As inflation drives up food costs, 16% of Americans are turning to fast food and other “cheaper options” to save money. But rising fast food prices undermine this strategy, making a once-affordable American staple an expensive treat. Almost 80% of Americans now consider fast food a luxury, and the majority say they’ve recently been shocked at the price of a fast food bill.
How to cope when you can’t make ends meet
Fast food workers looking at zeroed-out bank accounts can point to the stark economic reality that their wages just aren’t enough to survive in high-cost-of-living areas. It marks a notable change from the early days of the pandemic, when fast food workers were recognized for keeping essential services running.
If you’re one of the 3.8 million Americans working in fast food, consider the following ways you can close the wage gap and earn enough to get by.
1. Look at other career paths. Finding a new job is easier said than done, but working fast food in a big metropolitan area means facing real economic pressures that make it nearly impossible for you (or anyone) to survive on your wage. This isn’t a moral failing on your part — it’s about wages and expenses that just don’t add up.
Look at the average salaries for different professions and find a career that will support you and your family financially. Ask around. Lean on your network and community. If you’re one of the 42.8% of fast food workers enrolled in high school or college, use your school’s career counseling center to make connections.
2. Supplement with a side hustle. Nearly 40% of Americans have a side hustle, and almost half cite the current economy as the reason. “When you don’t make a living wage, there’s only so much you can cut from your budget,” Schulz says. “Ultimately, the best option might be to find a way to raise more income.”
You can opt for a typical side hustle like food delivery or choose from other popular ways to make extra cash.
3. Relocate to a more affordable city. In the face of rising expenses and economic insecurity, many people seek greener pastures in less expensive areas. According to a 2025 LendingTree study, 23% of Americans considering a move cite the desire for lower costs of living as a reason for moving.
Focus on places that help you save big on essentials like housing costs, child care and food, and consider temporarily moving in with family or friends if your finances are particularly tight.
Methodology
LendingTree analysts utilized the U.S. Bureau of Labor Statistics (BLS) May 2024 Occupational Employment and Wage Statistics (OEWS) survey to gather average hourly and annual wages for fast food and counter workers. They also obtained average wages for all occupations, both nationally and in the 50 largest metros, for comparison. The BLS has suspended the publication of Colorado’s monthly employment, unemployment and wage data due to data quality concerns, so Denver was excluded from our analysis.
Additionally, we compared the average annual wages for fast food workers with the required annual income before taxes as provided by the Massachusetts Institute of Technology (MIT) Living Wage Calculator. This calculator estimates the income needed for a single adult without children to cover basic living expenses — including food, housing, transportation, medical care, civic engagement, internet and mobile services, other expenses and taxes — in each metro.
Then, the average cost of a fast food meal in each metro was compared to both the average hourly wage of fast food workers and the average hourly wage for all occupations. Analysts collected prices for a standard fast food meal, including an entree, side (typically fries) and drink, in urban ZIP codes across the 50 largest U.S. metros. When a restaurant wasn’t in the target ZIP code, prices were collected from the nearest location. We selected five of the most well-known national fast food chains and the following flagship meals:
- Burger King: Whopper Meal (medium)
- Chick-fil-A: Sandwich Meal
- McDonald’s: Big Mac Combo Meal
- Taco Bell: Crunchwrap Supreme Combo
- Wendy’s: Dave’s Double Combo
Prices were collected via the restaurant websites or mobile apps from April 14 to 16, 2025. The average cost of a fast food meal for each metro was calculated by averaging the prices of the five selected meals, including taxes.
National statistics for demographics and working patterns for fast food and counter workers are derived from U.S. Census Bureau Current Population Survey (CPS) Annual Social and Economic (ASEC) March 2024 supplement microdata.
Get debt consolidation loan offers from up to 5 lenders in minutes