Lottery Spending Climbs Nationwide, With Massachusetts Residents Leading the Way
Americans spent an average of $320 on lottery tickets in 2023, up about 4.0% from the previous year, according to a LendingTree analysis of government data.
Massachusetts residents were, by far, the biggest per-capita spenders on lottery tickets, dropping an average of $915. That’s at least $300 more annually than any other state.
Here’s what else we found.
Key findings
- Lottery spending is on the rise. In 2023, the most recent year for which data is available, Americans spent an average of $320 on lottery tickets. That’s a 3.6% increase from $309 in 2022. Average per-capita winnings were $201 in 2023, though those numbers were skewed dramatically by four jackpots of at least $1 billion that year.
- Massachusettsans lead in per-capita lottery spending, while North Dakotans spend the least. We estimate that Massachusetts residents spent an average of $915 in 2023, up 4.0% from 2022, while their neighbors in Rhode Island came in a distant second at $573. North Dakota residents were at the bottom, spending just $50 per capita annually.
- Wyoming and North Dakota experienced the largest per-capita growth in lottery spending. Wyomingites spent 60.6% more in 2023 than in 2022, while North Dakotans spent 32.8% more. Despite that, North Dakota had the lowest per-capita spending of any state with a lottery in 2023, while Wyoming had the second-lowest. Just two states — Oregon and Pennsylvania — saw lottery spending decline, by less than 2.0% in each case.
- Winning, relative to spending, varies widely by state. In Virginia, 73.5% of 2023 lottery spending was paid out in winnings. Maine and Missouri also paid out more than 70.0% of spending, and Massachusetts, the highest-spending state, paid out 69.4%. However, in Oregon and South Dakota, less than 20.0% of spending was paid out as winnings.
- Three states are more reliant on lottery revenue than the others. Lottery revenue accounts for about 3.0% of the state’s general revenue in Rhode Island, South Dakota and West Virginia — triple the national average of 1.0%. (Interestingly, these states also have some of the lowest percentages of spending paid out as winnings.) Conversely, lottery revenue accounts for 0.1% of general revenue in North Dakota, while it comprises 0.2% in four other states.
Lottery spending on rise
Americans love playing the lottery. All but five states — Alabama, Alaska, Hawaii, Nevada and Utah — currently have at least one lottery game, and spending on these games is rising.
Americans spent an average of $320 on lottery tickets in 2023, the most recent year for which data is available. That’s up nearly 4.0% — 3.6%, to be exact — from the previous year.
U.S. lottery spending at a glance
| Stat | 2023 | 2022 |
|---|---|---|
| Total lottery spending | $108,986,283.40 | $103,273,032.20 |
| Per-capita lottery spending | $320.44 | $309.18 |
The average winnings in 2023, per capita, were $201. However, that doesn’t mean that if you spend $320 on lottery tickets, you’ll likely win $201 — though it would be amazing if that were the case.
Those average winnings are skewed tremendously by those lucky enough to win the biggest jackpots. For example, say two people buy lottery tickets and one of them doesn’t win anything and the other wins $100 million. The average winnings for those two are $50 million, although one of them walks away with generational wealth, while the other walks away with nothing.
Massachusettsans lead in per-capita lottery spending, while North Dakotans spend least
By state, we see massive differences in per-capita spending. In 40 of the 45 states with lotteries, residents spend an average of $100-pus annually on lottery tickets. However, in the 10 states with the highest per-capita spending, the average is at least four times higher than that. In one state, Massachusetts, the average is far beyond even that.
We estimate that Bay State residents spent an average of $915 in 2023. That’s up 4.0% from 2022 and is the highest per-capita lottery spending by a wide margin.
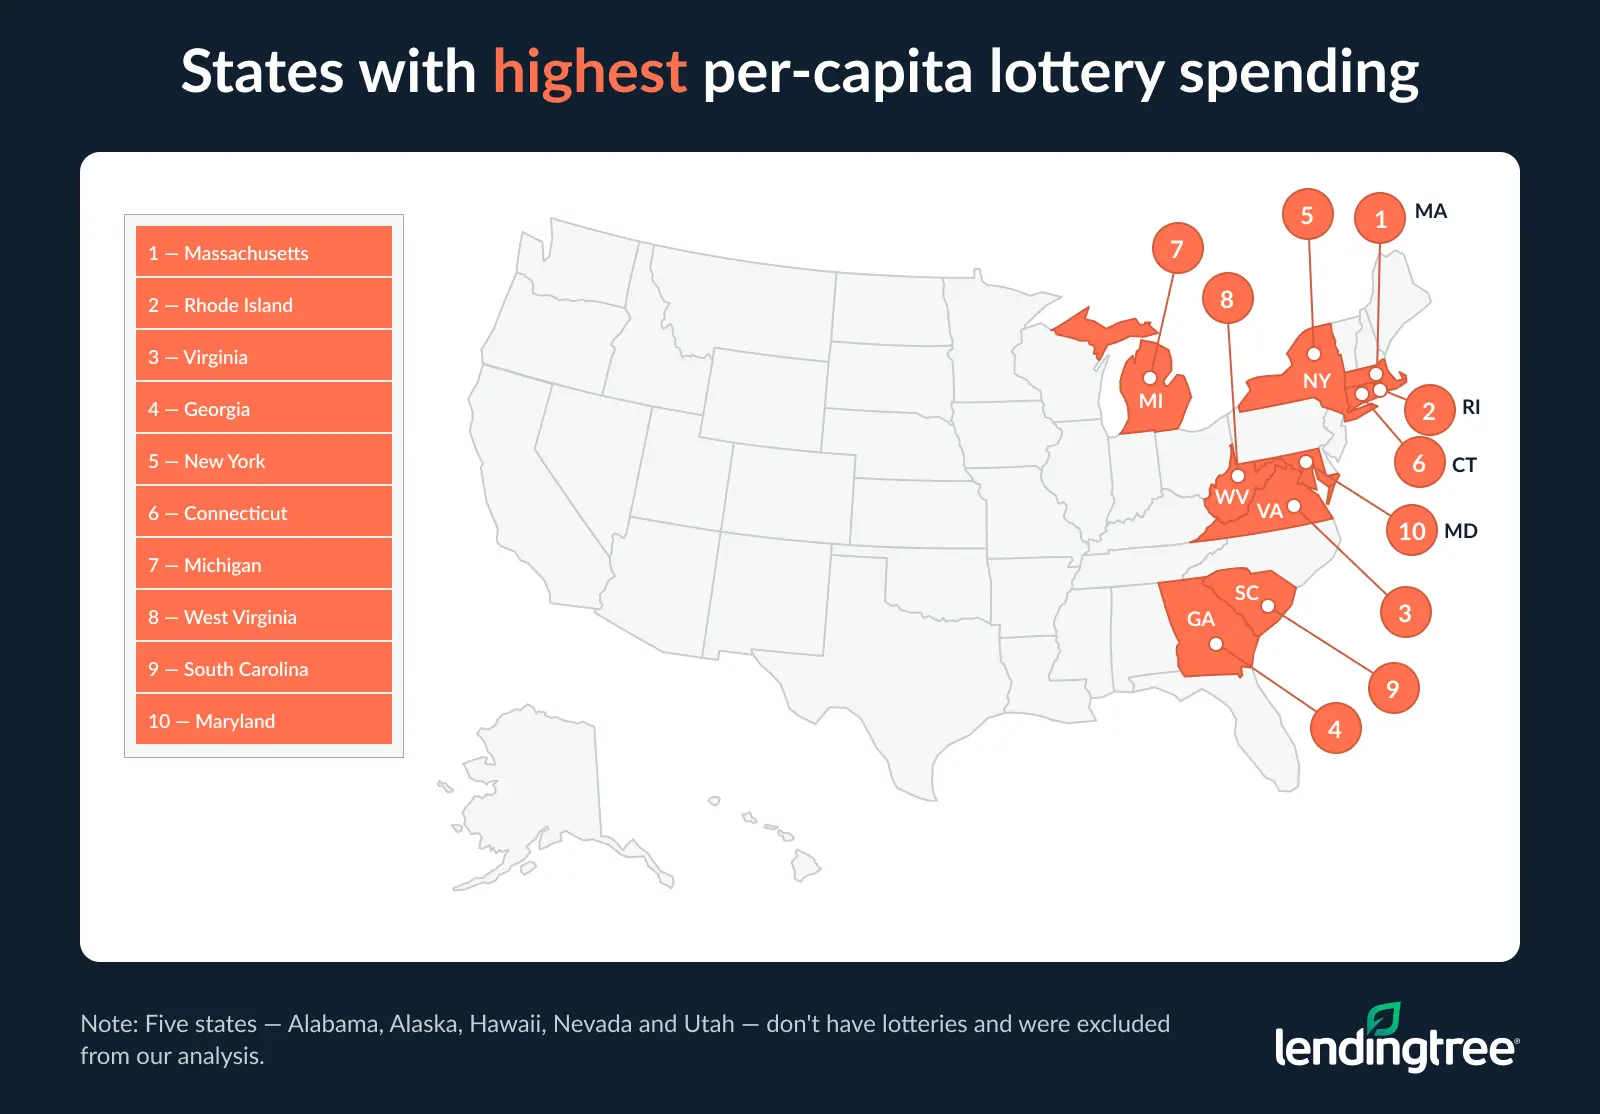
Massachusetts’ neighbors in Rhode Island had the second-highest per-capita spending at $573, but it was $342 (or 37%) less than what people in Massachusetts spent. Virginia ($532) and Georgia ($520) were the only other states to spend $500 annually on lottery tickets, while 10 other states — led by New York ($481) and Connecticut ($469) — spent $400 or more.
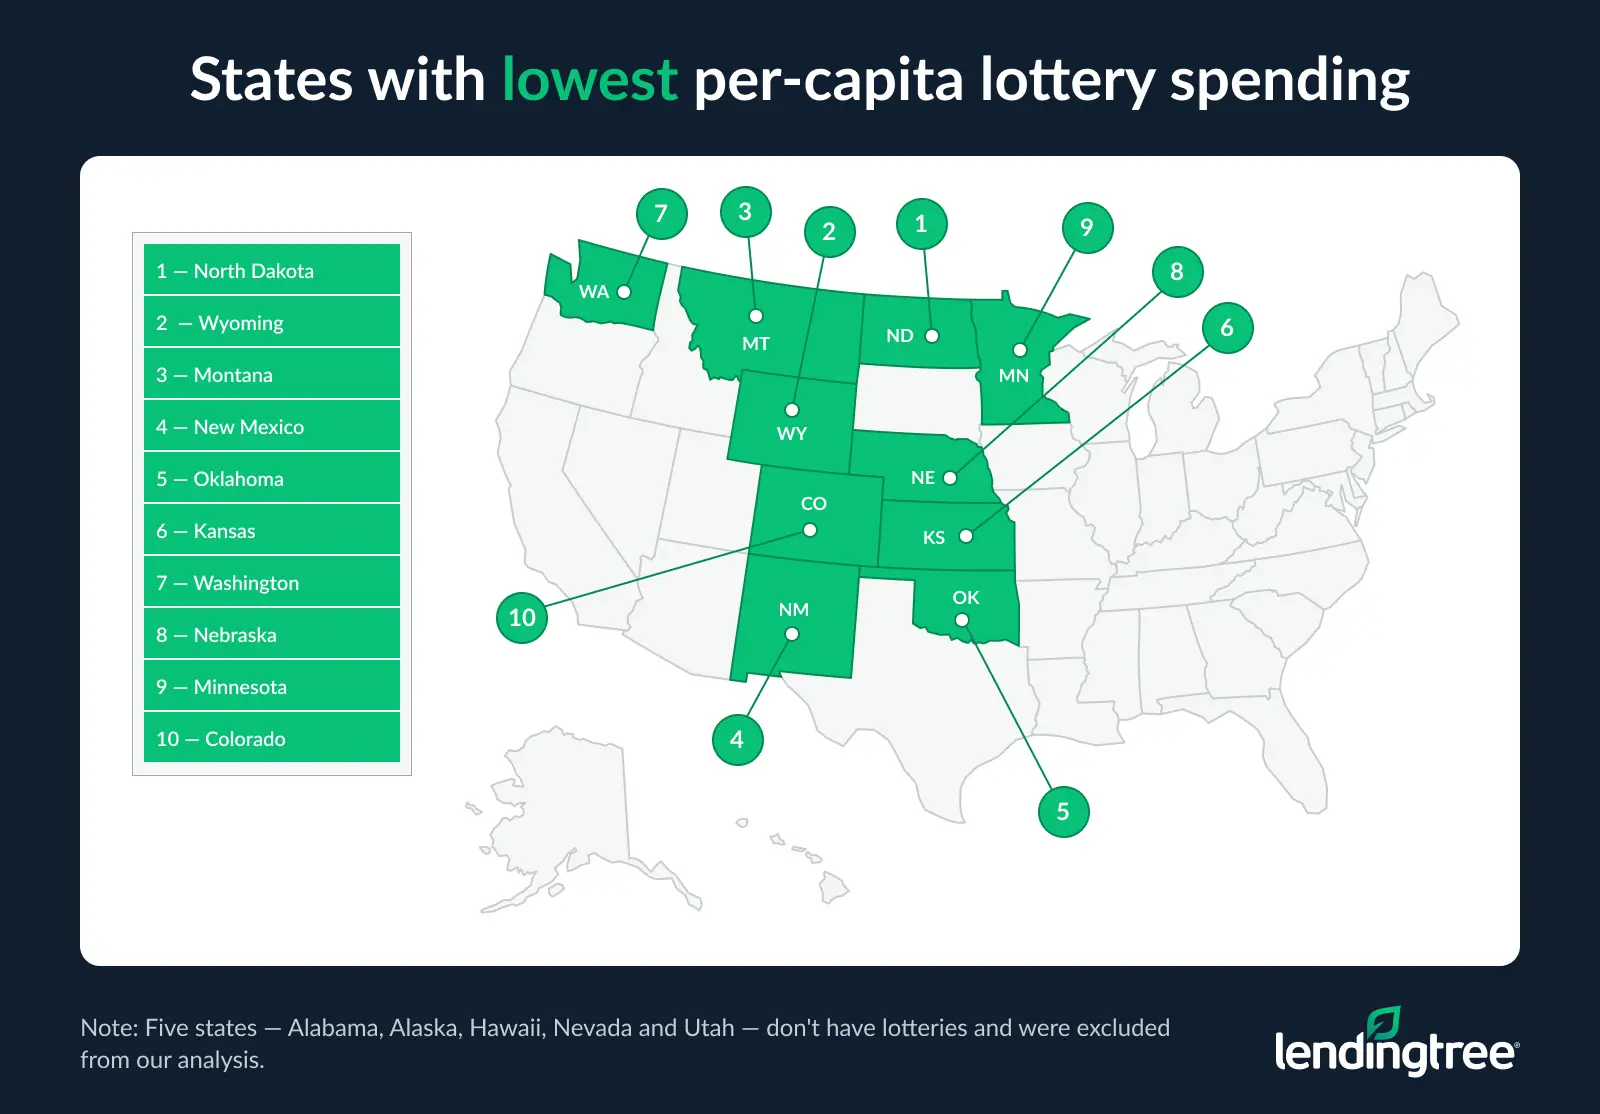
Conversely, North Dakotans spent just $50 annually on lottery tickets in 2023. Wyoming ($75), Montana ($76), New Mexico ($84) and Oklahoma ($92) were the only other lottery states where residents spent less than $100 per capita annually. In 11 other states, led by Kansas ($110) and Washington ($121), per-capita lottery spending was less than $200.
Per-capita lottery spending by state, 2023
| Rank | State | Per-capita spending |
|---|---|---|
| 1 | Massachusetts | $914.52 |
| 2 | Rhode Island | $573.33 |
| 3 | Virginia | $532.12 |
| 4 | Georgia | $519.52 |
| 5 | New York | $480.98 |
| 6 | Connecticut | $469.20 |
| 7 | Michigan | $467.61 |
| 8 | West Virginia | $441.41 |
| 9 | South Carolina | $437.38 |
| 10 | Maryland | $431.79 |
| 11 | Florida | $425.45 |
| 12 | North Carolina | $421.05 |
| 13 | Delaware | $420.91 |
| 14 | Kentucky | $407.26 |
| 15 | New Jersey | $394.46 |
| 16 | New Hampshire | $387.17 |
| 17 | Pennsylvania | $373.48 |
| 18 | Ohio | $372.16 |
| 19 | Oregon | $325.51 |
| 20 | Illinois | $301.19 |
| 21 | Texas | $299.58 |
| 22 | Maine | $289.11 |
| 23 | Missouri | $286.76 |
| 24 | Tennessee | $284.57 |
| 25 | South Dakota | $281.75 |
| 26 | Vermont | $274.22 |
| 27 | Indiana | $249.54 |
| 28 | California | $248.67 |
| 29 | Idaho | $208.13 |
| 30 | Arizona | $199.47 |
| 31 | Arkansas | $197.03 |
| 32 | Mississippi | $180.81 |
| 33 | Wisconsin | $165.50 |
| 34 | Louisiana | $158.44 |
| 35 | Iowa | $147.58 |
| 36 | Colorado | $147.30 |
| 37 | Minnesota | $134.83 |
| 38 | Nebraska | $124.42 |
| 39 | Washington | $121.46 |
| 40 | Kansas | $110.40 |
| 41 | Oklahoma | $92.35 |
| 42 | New Mexico | $83.79 |
| 43 | Montana | $76.04 |
| 44 | Wyoming | $74.69 |
| 45 | North Dakota | $50.16 |
Wyoming, North Dakota saw biggest per-capita lottery spending growth
Though they’re both at the bottom in average per-capita lottery spending, Wyoming and North Dakota saw the biggest year-over-year increases.
Wyoming residents spent an average of 60.6% more on lottery tickets in 2023 than in 2022, while North Dakotans spent a third more (32.8%). Two other states — New Mexico at 22.7% and Virginia at 22.1% — saw growth of at least 20.0% year over year. Six more states saw growth of at least 10.0%, led by Louisiana at 12.0%.
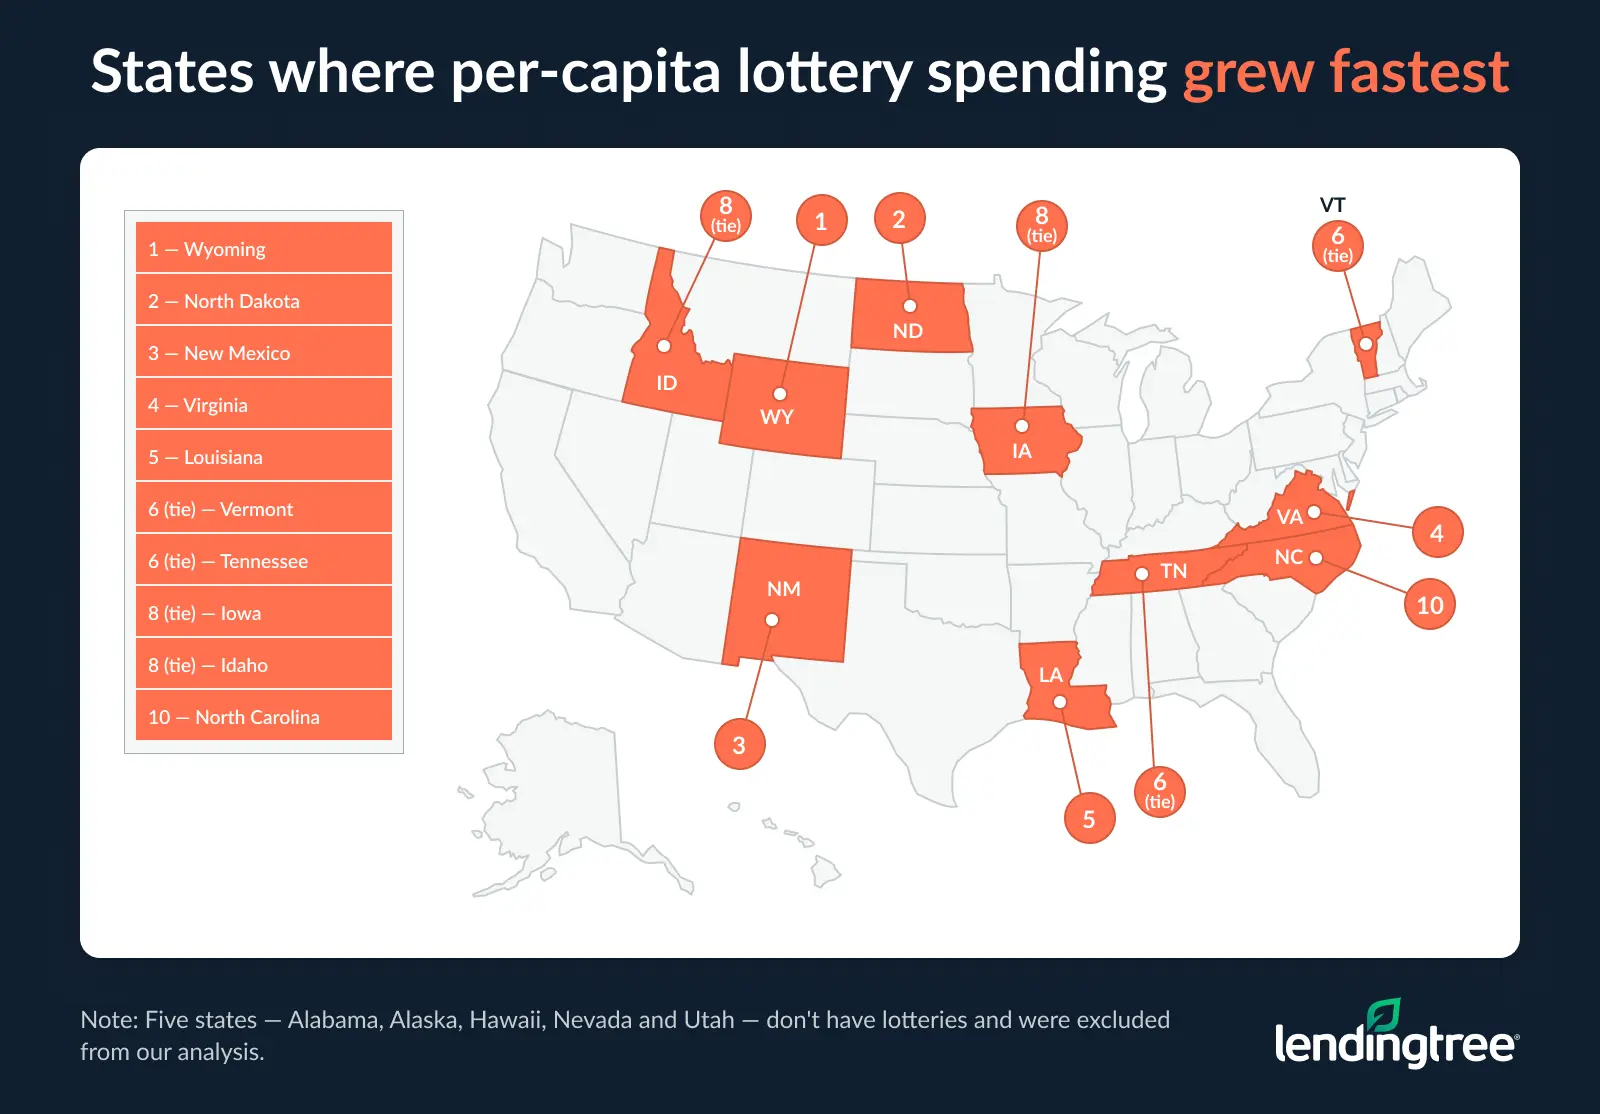
Lottery spending fell in just two states, Oregon (1.7%) and Pennsylvania (0.7%). In Michigan and Missouri, spending remained largely unchanged, increasing by just 0.2% in each state. Three other states saw growth of 2.0% or less.
Per-capita lottery spending growth from 2022 to 2023, by state
| Rank | State | Per-capita spending, 2023 | Per-capita spending, 2022 | Change |
|---|---|---|---|---|
| 1 | Wyoming | $74.69 | $46.51 | 60.6% |
| 2 | North Dakota | $50.16 | $37.77 | 32.8% |
| 3 | New Mexico | $83.79 | $68.31 | 22.7% |
| 4 | Virginia | $532.12 | $435.65 | 22.1% |
| 5 | Louisiana | $158.44 | $141.44 | 12.0% |
| 6 | Vermont | $274.22 | $246.73 | 11.1% |
| 6 | Tennessee | $284.57 | $256.25 | 11.1% |
| 8 | Iowa | $147.58 | $133.21 | 10.8% |
| 8 | Idaho | $208.13 | $187.91 | 10.8% |
| 10 | North Carolina | $421.05 | $382.87 | 10.0% |
| 11 | Wisconsin | $165.50 | $150.71 | 9.8% |
| 11 | Kentucky | $407.26 | $371.03 | 9.8% |
| 13 | Arizona | $199.47 | $182.39 | 9.4% |
| 13 | Mississippi | $180.81 | $165.33 | 9.4% |
| 15 | Washington | $121.46 | $111.08 | 9.3% |
| 16 | New Hampshire | $387.17 | $358.40 | 8.0% |
| 16 | Nebraska | $124.42 | $115.25 | 8.0% |
| 18 | Oklahoma | $92.35 | $85.94 | 7.5% |
| 19 | Rhode Island | $573.33 | $535.54 | 7.1% |
| 20 | Colorado | $147.30 | $137.88 | 6.8% |
| 21 | Illinois | $301.19 | $283.67 | 6.2% |
| 22 | Minnesota | $134.83 | $127.32 | 5.9% |
| 23 | Maine | $289.11 | $273.26 | 5.8% |
| 24 | Connecticut | $469.20 | $443.98 | 5.7% |
| 25 | Georgia | $519.52 | $492.29 | 5.5% |
| 26 | West Virginia | $441.41 | $419.68 | 5.2% |
| 27 | South Carolina | $437.38 | $417.97 | 4.6% |
| 28 | Montana | $76.04 | $72.76 | 4.5% |
| 29 | California | $248.67 | $238.62 | 4.2% |
| 30 | Arkansas | $197.03 | $189.27 | 4.1% |
| 31 | Massachusetts | $914.52 | $879.61 | 4.0% |
| 32 | South Dakota | $281.75 | $271.15 | 3.9% |
| 32 | Kansas | $110.40 | $106.26 | 3.9% |
| 34 | Delaware | $420.91 | $405.97 | 3.7% |
| 35 | Ohio | $372.16 | $359.70 | 3.5% |
| 36 | Texas | $299.58 | $290.67 | 3.1% |
| 37 | Maryland | $431.79 | $419.06 | 3.0% |
| 38 | Florida | $425.45 | $415.26 | 2.5% |
| 39 | Indiana | $249.54 | $244.66 | 2.0% |
| 40 | New Jersey | $394.46 | $388.28 | 1.6% |
| 41 | New York | $480.98 | $474.73 | 1.3% |
| 42 | Missouri | $286.76 | $286.10 | 0.2% |
| 42 | Michigan | $467.61 | $466.72 | 0.2% |
| 44 | Pennsylvania | $373.48 | $375.97 | -0.7% |
| 45 | Oregon | $325.51 | $331.13 | -1.7% |
Winning, relative to spending, varies widely by state
Along with spending, we also looked at payouts by state. Rather than focusing on per-capita winnings — which, as we explained earlier, are dramatically skewed by the size of some of these jackpots — we took it a step further. We chose to examine which states returned the largest percentage of residents’ lottery spending in the form of winnings.
For example, Virginia’s per-capita lottery spending was an average of $532, while its per-capita payout was $391. That means that the state returned 73.5% of its residents’ spending as winnings, the highest percentage of any lottery state.
Maine (71.0%) and Missouri (70.4%) weren’t far behind, joining Virginia as the only states to top 70.0%. However, most other states had percentages of at least 60.0%. That includes Massachusetts, the nation’s biggest lottery-spending state, at 69.4%.
Still, a few states fell far short of that 60.0% threshold. In Oregon and South Dakota, less than 20.0% of residents’ spending was paid out as winnings, the lowest percentage among lottery states. West Virginia wasn’t far behind at 21.1%, while Rhode Island (31.7%) was the only other state that didn’t return at least 45.0% of per-capita spending as winnings.
Percentage of lottery spending returned in the form of winnings, 2023
| Rank | State | Per-capita spending | Per-capita payouts | % of spending returned as payout |
|---|---|---|---|---|
| 1 | Virginia | $532.12 | $391.13 | 73.5% |
| 2 | Maine | $289.11 | $205.29 | 71.0% |
| 3 | Missouri | $286.76 | $201.93 | 70.4% |
| 4 | Kentucky | $407.26 | $283.95 | 69.7% |
| 5 | Idaho | $208.13 | $144.87 | 69.6% |
| 6 | Massachusetts | $914.52 | $634.54 | 69.4% |
| 7 | Arkansas | $197.03 | $135.99 | 69.0% |
| 8 | Arizona | $199.47 | $136.58 | 68.5% |
| 9 | Pennsylvania | $373.48 | $254.84 | 68.2% |
| 10 | Florida | $425.45 | $286.21 | 67.3% |
| 11 | South Carolina | $437.38 | $293.74 | 67.2% |
| 12 | Georgia | $519.52 | $348.23 | 67.0% |
| 13 | Indiana | $249.54 | $166.59 | 66.8% |
| 14 | Colorado | $147.30 | $97.52 | 66.2% |
| 14 | Connecticut | $469.20 | $310.54 | 66.2% |
| 16 | Ohio | $372.16 | $244.82 | 65.8% |
| 17 | Minnesota | $134.83 | $88.53 | 65.7% |
| 18 | Michigan | $467.61 | $304.85 | 65.2% |
| 19 | Washington | $121.46 | $78.76 | 64.8% |
| 20 | Maryland | $431.79 | $278.20 | 64.4% |
| 21 | Iowa | $147.58 | $94.85 | 64.3% |
| 22 | Texas | $299.58 | $189.34 | 63.2% |
| 23 | Kansas | $110.40 | $69.46 | 62.9% |
| 24 | New Hampshire | $387.17 | $242.02 | 62.5% |
| 24 | North Carolina | $421.05 | $263.18 | 62.5% |
| 26 | Oklahoma | $92.35 | $57.62 | 62.4% |
| 27 | Illinois | $301.19 | $187.06 | 62.1% |
| 28 | Wisconsin | $165.50 | $102.51 | 61.9% |
| 29 | California | $248.67 | $152.05 | 61.1% |
| 29 | Tennessee | $284.57 | $173.90 | 61.1% |
| 31 | New Jersey | $394.46 | $237.78 | 60.3% |
| 32 | Vermont | $274.22 | $161.72 | 59.0% |
| 33 | Montana | $76.04 | $43.61 | 57.4% |
| 34 | Mississippi | $180.81 | $99.08 | 54.8% |
| 35 | Wyoming | $74.69 | $40.87 | 54.7% |
| 36 | Nebraska | $124.42 | $64.87 | 52.1% |
| 37 | New York | $480.98 | $249.48 | 51.9% |
| 38 | New Mexico | $83.79 | $43.31 | 51.7% |
| 39 | Louisiana | $158.44 | $81.33 | 51.3% |
| 40 | North Dakota | $50.16 | $25.54 | 50.9% |
| 41 | Delaware | $420.91 | $191.27 | 45.4% |
| 42 | Rhode Island | $573.33 | $181.89 | 31.7% |
| 43 | West Virginia | $441.41 | $93.00 | 21.1% |
| 44 | South Dakota | $281.75 | $56.09 | 19.9% |
| 45 | Oregon | $325.51 | $64.46 | 19.8% |
3 states more reliant on lottery revenue than others
These numbers make one thing crystal clear: The lottery is big business and generates a substantial amount of revenue for the states that participate. On average, lottery revenue accounts for 1.0% of a state’s general revenue in states that participate. However, that number can vary widely.
When determining percentages of a state’s revenue, we looked at a state’s general revenue rather than its total revenue. While the total revenue number provides an overall picture of the money coming into the state, the general revenue number better indicates the amount of money available for the state to spend on programs and services. It excludes revenue from items such as utilities, pensions and unemployment insurance funds that can’t be used for other purposes.
In Rhode Island, South Dakota and West Virginia, lottery revenue accounts for about 3.0% of the state’s general revenue. That’s triple the national average. Interestingly, those are three of the states with the lowest percentage of spending returned as winnings.
It’s a very different story in North Dakota. Lottery revenue accounts for just 0.1% of the state’s general revenue, the smallest percentage of any lottery state. It makes up 0.2% of general revenue in four other states, including Arkansas, Montana, New Mexico and Wyoming.
Among the nation’s most populous states, lottery revenue makes up 1.7% of general revenue in Florida, 1.5% in New York, 1.0% in Texas and just 0.7% in California.
Proceed with caution
We all have favorite things we love spending money on. For some people, the lottery is that thing. That can be fine, assuming it’s done in moderation. It can even be viewed as an entertainment expense — a few dollars spent for the adrenaline rush and excitement of it all.
If you spend too much too often, however, it can become a real problem. That’s money that can’t go toward building an emergency fund, paying down high-interest debt or working toward other long-term financial goals. The opportunity cost of that money can be significant in the long run.
Budgeting can help you avoid overspending. It may seem silly at first to budget for lottery spending, but if you’re passionate about it and you regularly spend a significant amount of money on it, there’s nothing wrong with including it in your budget. In fact, it’s smart. That way, if you go a little overboard one week — like when that jackpot hits $1 billion — you can adjust your budgets to make room.
Part of the fun of the lottery is putting a few dollars down and dreaming of a day when all your money problems are solved and your worries are gone. However, until that day comes, lean on your budget to make sure money spent on that dream doesn’t turn your finances into a nightmare.
Methodology
LendingTree researchers analyzed lottery funds data from the U.S. Census Bureau 2023 Annual Survey of State Government Finances — the latest available. State populations are from the U.S. Census Bureau 2023 American Community Survey with one-year estimates.
Analysts estimated the amount spent by residents of each state on lotteries (annual ticket sales excluding commissions, plus an assumed 5.5% in commissions), prize payouts and net losses on a per-capita basis. Retailers are paid a commission on every lottery ticket they sell, and this commission can vary based on factors such as the type of product sold and the location. They typically range from 5% to 8%. For our analysis, we assumed a 5.5% commission on all lottery ticket sales.
The following states don’t have lotteries and were excluded from our analysis:
- Alabama
- Alaska
- Hawaii
- Nevada
- Utah
Get debt consolidation loan offers from up to 5 lenders in minutes