More Students Are Playing High School Sports Than Last Year, But Numbers Remain Below Pre-Pandemic Highs
The number of high schoolers who participated in school sports climbed in the 2022-23 school year, but still remained below pre-pandemic highs, according to a LendingTree analysis.
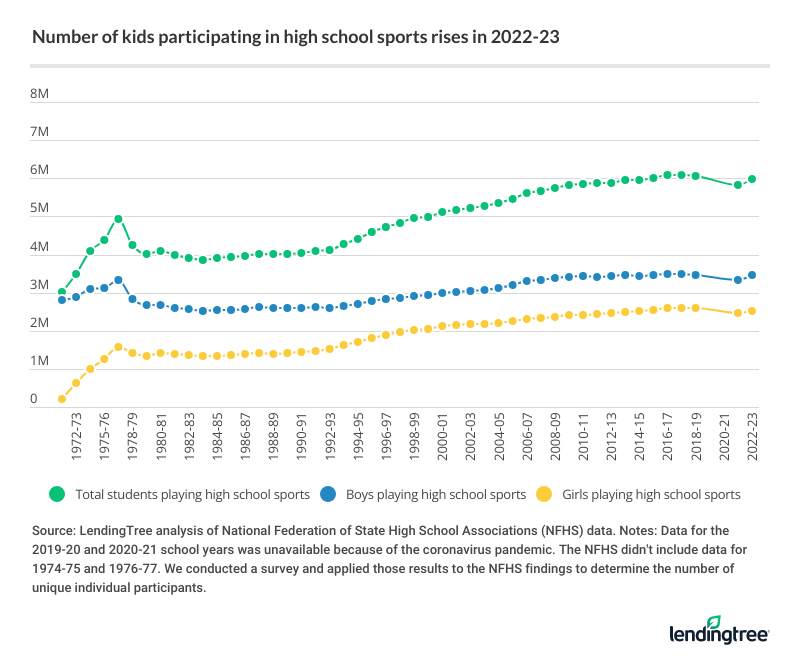
Nearly 6 million students participated in high school sports last school year, an increase of 3.1% from 2021-22, according to an analysis of National Federation of State High School Associations data. That was the biggest yearly percentage increase since the 1995-96 school year. However, coming on the heels of declines immediately before and after the darkest days of the coronavirus pandemic, that jump wasn’t enough to return participation to the record levels seen before the crisis. (Note: Figures weren’t available for the 2019-20 and 2020-21 school years because of the pandemic.)
Almost 180,000 more high schoolers participated in school sports in 2022-23 than in the previous year, with boys making up more of that growth. Similar growth in participation numbers from 2022-23 to 2023-24 would push the overall totals past the record levels seen in 2017-18. However, that’s far from certain, given that 2022-23 saw the fastest growth in more than 25 years as the pandemic receded and life continued to return to normal.
Here’s what we found.
Key findings
- About 6 million high schoolers participated in school sports during the 2022-23 school year, a 3.1% increase from 2021-22. Boys’ sports saw a larger participation increase of 3.5% in this period, compared with a 2.4% jump in girls’ sports. The number of participants had fallen in the two previous years in which data was available — the first decreases in 30 years.
- Maine had the highest overall high school sports participation rate. 62.1% of Maine high school students participated in school sports in the 2022-23 school year — 66.7% of boys (No. 1 in the nation) and 57.3% of girls (also No. 1). The second-highest boys’ participation rate was in Mississippi at 65.0%, which held the third overall participation spot at 56.1%. Nevada had the lowest overall sports participation rate among high school students (19.4%), as well as among both boys (21.8%) and girls (17.0%).
- Alabama had the highest 10-year increase in high school sports participation rates. The overall sports participation rate jumped 89.4% in Alabama between the 2013-14 and 2022-23 school years. The state also had the highest percentage jumps among girls (124.7%) and boys (69.6%). Arkansas (32.5%) and Utah (13.0%) had the next biggest overall increases.
- Vermont had the highest 10-year decrease in high school sports participation rates. The overall participation rate in the state dropped by 45.3% between 2013-14 and 2022-23, with both boys and girls showing the biggest dips nationally (49.5% and 40.1%, respectively). Alaska and North Carolina had the next biggest overall drops at 27.8% and 20.3%, respectively.
- The most participated-in sport was outdoor track and field. 1,091,338 boys and girls participated in the sport in 2022-23. Among boys, track and field came in second to football (1,028,761 to 604,983). However, it was tops among girls at 486,355, edging out volleyball’s 470,488. Swimming and diving saw the largest 10-year decline in boys’ participation among the top 10 sports, at 18.5% between the 2013-14 and 2022-23 school years. Girls’ swimming and diving participation decreased by the most (15.1%) in the same period.
The National Federation of State High School Associations (NFHS) data showed total participants in all high school sports rather than the number of individuals who participated. That means someone who participated in football and track or volleyball and lacrosse would be counted twice.
To determine the number of unique individual participants, we assumed that each high schooler who played sports does 1.31 sports – meaning that roughly 3 in 10 high school students who play sports are active in more than one.
We arrived at that figure by commissioning QuestionPro to conduct an online survey of 648 U.S. parents with children younger than 18 to ask how many minor children in their households participate in team sports through their high school, as well as how many teams they have joined or will join this school year.
We applied our survey results to the NFHS’ national and state numbers to derive overall participation levels and rates.
Number of high school students playing sports rebounds after recent decline
Participation in high school sports has exploded in the past 50 years. Our analysis of data from the NFHS shows that more than 3 million kids played high school sports in the 1971-72 school year. That number more than doubled to an all-time high of nearly 6.1 million in the 2017-18 school year.
While boys’ participation grew significantly during that time — from nearly 2.8 million in 1971-72 to nearly 3.5 million in 2017-18 — there was nothing short of a megaton explosion in girls’ participation numbers. The fuse was lit in 1972 with the enactment of Title IX of the Education Amendments Act, which prohibits schools that receive federal funding from discriminating on the basis of sex in education programs and activities. Those activities include sports, and the regulations require schools to provide equal opportunity based on sex.
As a result, we saw massive growth in opportunities in high school sports for girls. In 1971-72, just about 224,000 girls in the U.S. participated in high school sports. Meanwhile, at its peak in 2017-18, that number was more than 2.6 million. That stratospheric growth pushed participation numbers to never-before-seen heights, numbers that people might never have imagined possible when Title IX was signed into law.
That growth, however, ended several years ago — before the pandemic — and only returned in 2022-23.
In 2018-19, the overall number of participants fell by 0.5%, meaning that about 33,100 fewer students participated in high school sports than in the year before. That includes about 23,500 boys and about 9,600 girls.
Stats for the next two school years weren’t available because of the pandemic, but the data showed even bigger declines in 2021-22. The number of students participating fell by 4.0%, or about 244,000 kids. (About 123,000 were girls, while about 121,000 were boys.) That left overall participation numbers at the lowest since 2008-09.
Participation numbers bounced back strong in 2022-23, however. About 117,000 more boys and about 59,000 more girls participated in high school sports than in the previous school year.
Maine has the highest overall high school sports participation rate, while Nevada has the lowest
Nationally, more than 1 in 3 high schoolers (34.6%) participated in high school sports in 2022-23, including 38.8% of boys and 30.1% of girls.
However, the data shows participation in high school sports varied enormously by state. And while you might expect football-mad states like Texas, Alabama and Ohio or basketball-crazy states like Indiana, Kansas and Kentucky to have the largest high school sports participation rates, they don’t.
Maine led the way with 62.1% of high school students participating in sports (including 66.7% of boys), with Iowa (58.6%), Mississippi (56.1%) and Wyoming (54.5%) next.
Meanwhile, three states didn’t even have 25.0% of kids participating, with Nevada being the lowest at just 19.4%. Surprisingly, Florida — which perennially turns out many of the best high school athletes in America — was the second-lowest state, with just 22.2% of students playing high school sports. Georgia was the third-lowest with 24.3%.
High school sports participation rate in 2022-23
| Rank | State | % of high school students who participate in sports | Boys’ participation rate | Girls’ participation rate |
|---|---|---|---|---|
| 1 | Maine | 62.1% | 66.7% | 57.3% |
| 2 | Iowa | 58.6% | 64.9% | 51.5% |
| 3 | Mississippi | 56.1% | 65.0% | 47.6% |
| 4 | Wyoming | 54.5% | 55.6% | 53.2% |
| 5 | Minnesota | 54.1% | 58.6% | 49.6% |
| 6 | Alabama | 53.6% | 64.1% | 42.7% |
| 7 | Nebraska | 52.3% | 57.9% | 46.1% |
| 7 | North Dakota | 52.3% | 59.2% | 44.6% |
| 9 | Kansas | 48.9% | 56.1% | 41.4% |
| 10 | South Dakota | 48.7% | 50.1% | 47.1% |
| 11 | Massachusetts | 48.4% | 53.7% | 42.8% |
| 12 | Montana | 47.8% | 50.4% | 44.8% |
| 13 | Rhode Island | 46.7% | 52.1% | 41.1% |
| 14 | New Hampshire | 46.2% | 50.6% | 41.7% |
| 15 | Connecticut | 44.3% | 47.0% | 41.4% |
| 16 | Wisconsin | 43.4% | 49.3% | 36.9% |
| 17 | New Jersey | 42.7% | 49.0% | 36.3% |
| 18 | Delaware | 42.1% | 45.9% | 38.0% |
| 19 | Arkansas | 41.2% | 44.4% | 37.5% |
| 20 | Michigan | 40.1% | 45.6% | 34.4% |
| 21 | Missouri | 40.0% | 45.6% | 34.1% |
| 21 | Hawaii | 40.0% | 44.1% | 35.4% |
| 23 | Ohio | 39.9% | 46.2% | 33.2% |
| 24 | Colorado | 39.6% | 39.5% | 39.7% |
| 25 | Pennsylvania | 38.8% | 39.9% | 37.7% |
| 26 | Illinois | 38.4% | 43.4% | 33.1% |
| 27 | Oregon | 36.5% | 39.2% | 33.7% |
| 28 | Texas | 36.0% | 42.2% | 29.6% |
| 28 | Kentucky | 36.0% | 38.1% | 33.8% |
| 30 | Oklahoma | 35.9% | 39.0% | 32.7% |
| 31 | Idaho | 35.4% | 40.3% | 30.1% |
| 32 | New Mexico | 35.2% | 38.3% | 32.0% |
| 33 | Washington | 34.9% | 38.0% | 31.5% |
| 34 | West Virginia | 33.9% | 38.7% | 28.9% |
| 35 | Louisiana | 33.6% | 41.9% | 25.2% |
| 36 | Indiana | 31.4% | 35.5% | 26.9% |
| 37 | Virginia | 30.2% | 33.9% | 26.2% |
| 38 | Alaska | 29.4% | 31.7% | 27.1% |
| 39 | New York | 28.9% | 30.9% | 26.7% |
| 40 | Maryland | 28.6% | 31.7% | 25.4% |
| 41 | California | 28.3% | 31.5% | 24.9% |
| 42 | South Carolina | 28.2% | 34.7% | 21.1% |
| 43 | Utah | 27.0% | 29.6% | 24.2% |
| 44 | Tennessee | 25.9% | 32.5% | 18.8% |
| 45 | Vermont | 25.7% | 25.1% | 26.4% |
| 46 | North Carolina | 25.1% | 30.3% | 19.6% |
| 46 | Arizona | 25.1% | 28.6% | 21.5% |
| 48 | Georgia | 24.3% | 28.2% | 20.2% |
| 49 | Florida | 22.2% | 23.9% | 20.2% |
| 50 | Nevada | 19.4% | 21.8% | 17.0% |
| U.S. | 34.6% | 38.8% | 30.1% |
Maine had the highest participation rates among both boys (66.7%) and girls (57.3%). By contrast, 21.8% of boys and 17.0% of girls participated in Nevada.
Alabama sees the biggest 10-year jump in participation rates, while Vermont has the biggest slide
Looking back a decade, the picture has changed dramatically in some parts of the country when it comes to high school sports participation rates. Six states saw double-digit increases, while seven saw double-digit decreases.
Change in high school sports participation rates between 2013-14 and 2022-23
| Rank | State | Change in overall participation rate | Change in boys’ participation rate | Change in girls’ participation rate |
|---|---|---|---|---|
| 1 | Alabama | 89.4% | 69.6% | 124.7% |
| 2 | Arkansas | 32.5% | 20.7% | 50.6% |
| 3 | Utah | 13.0% | 8.8% | 19.2% |
| 4 | Rhode Island | 12.5% | 13.5% | 12.0% |
| 5 | Mississippi | 12.4% | 13.2% | 15.5% |
| 6 | Colorado | 11.5% | 4.5% | 19.9% |
| 7 | New Mexico | 9.0% | 7.9% | 10.0% |
| 8 | West Virginia | 7.6% | 11.5% | 3.2% |
| 9 | Connecticut | 5.7% | 7.1% | 4.5% |
| 10 | Illinois | 4.9% | 4.6% | 5.8% |
| 11 | California | 4.8% | 2.9% | 7.3% |
| 12 | Kentucky | 4.7% | 5.0% | 4.3% |
| 13 | Washington | 4.5% | 2.4% | 7.1% |
| 14 | Tennessee | 4.0% | 4.8% | 2.2% |
| 15 | Wyoming | 3.8% | 3.2% | 4.5% |
| 16 | Florida | 3.7% | 0.8% | 6.3% |
| 17 | Pennsylvania | 3.5% | 3.1% | 3.9% |
| 18 | Kansas | 2.5% | -0.4% | 7.0% |
| 19 | Maine | 2.0% | 6.4% | -2.9% |
| 20 | Maryland | 0.7% | 0.0% | 2.0% |
| 21 | Louisiana | 0.0% | 4.7% | -6.3% |
| 22 | Ohio | -0.3% | 1.1% | -2.4% |
| 23 | South Dakota | -2.2% | -9.1% | 6.8% |
| 24 | New York | -2.4% | -2.5% | -2.2% |
| 25 | Massachusetts | -3.2% | -0.7% | -5.9% |
| 26 | Arizona | -3.5% | -3.7% | -3.2% |
| 27 | Michigan | -3.8% | -1.9% | -6.0% |
| 27 | Virginia | -3.8% | -1.7% | -6.8% |
| 29 | Montana | -4.0% | -12.0% | 5.2% |
| 30 | Indiana | -4.3% | -9.0% | 1.1% |
| 31 | South Carolina | -4.4% | -6.2% | -4.1% |
| 32 | Idaho | -4.8% | 1.3% | -12.0% |
| 33 | New Jersey | -5.1% | -1.4% | -8.8% |
| 34 | Hawaii | -5.7% | -7.4% | -4.1% |
| 35 | Missouri | -5.9% | -6.9% | -3.7% |
| 36 | Georgia | -6.5% | -9.6% | -2.4% |
| 37 | New Hampshire | -7.4% | -6.3% | -8.6% |
| 37 | Oregon | -7.4% | -9.9% | -4.3% |
| 39 | Wisconsin | -8.2% | -9.0% | -8.0% |
| 40 | Nevada | -8.5% | -9.5% | -6.1% |
| 41 | Oklahoma | -9.6% | -8.9% | -10.4% |
| 42 | Delaware | -9.7% | -12.1% | -6.6% |
| 43 | Nebraska | -9.8% | -16.9% | -1.1% |
| 44 | Iowa | -10.3% | -13.6% | -6.0% |
| 45 | Minnesota | -10.7% | -3.5% | -18.2% |
| 46 | Texas | -11.3% | -12.4% | -9.2% |
| 47 | North Dakota | -16.9% | -18.0% | -16.3% |
| 48 | North Carolina | -20.3% | -15.8% | -26.6% |
| 49 | Alaska | -27.8% | -17.4% | -37.8% |
| 50 | Vermont | -45.3% | -49.5% | -40.1% |
Perhaps the most eye-popping numbers we found in our analysis were these: Alabama’s participation rate grew 89.4% from 2013-14 to 2022-23, including a stunning 124.7% jump among girls. That adds up to about 65,000 more students in Alabama playing high school sports than a decade ago. (That includes about 36,000 boys and about 29,000 girls.)
Arkansas had the second-biggest 10-year participation rate growth, up 32.5% since 2013-14. Utah, up 13.0%, was next.
The story was different in Vermont, with a 45.3% drop in high school sports participation rates during that period. That included a 49.5% decline among boys and a 40.1% reduction among girls.
Still, while Vermont’s drop was head and shoulders above the rest, it wasn’t the only state that saw a major decrease. Alaska, North Carolina and North Dakota also saw 10-year declines of at least 15.0%, with Alaska seeing the biggest at 27.8%.
Outdoor track and field is most participated-in sport, edging out football
It certainly isn’t breaking news that football is the most-watched sport in this country. However, when it comes to high school participation, another sport reigns supreme: outdoor track and field.
Combining boys and girls, 1,091,338 high schoolers competed in track and field in the 2022-23 school year. That’s slightly higher than the 1,028,761 boys who participated in football.
It shouldn’t be surprising that football is, by far, the most participated-in sport for boys — a more than 423,000-boy advantage over track and field. (Track and field took the top spot with girls, edging volleyball by about 16,000 participants.) What might be surprising is that it also saw one of the biggest percentage decreases in participation in the past decade.
| Most popular sports among high school students (by gender) | |||
|---|---|---|---|
| Boys | |||
| Sport | Boys’ participation, 2022-23 | Boys’ participation, 2013-14 | Change |
| Football | 1,028,761 | 1,093,234 | -6.3% |
| Outdoor track and field | 604,983 | 580,321 | 4.1% |
| Basketball | 537,438 | 541,054 | -0.7% |
| Baseball | 478,451 | 482,629 | -0.9% |
| Soccer | 450,455 | 417,419 | 7.3% |
| Wrestling | 259,431 | 269,514 | -3.9% |
| Cross-country | 240,201 | 252,547 | -5.1% |
| Tennis | 158,306 | 160,545 | -1.4% |
| Golf | 150,175 | 152,647 | -1.6% |
| Swimming and diving | 116,741 | 138,373 | -18.5% |
| Girls | |||
| Sport | Girls’ participation, 2022-23 | Girls’ participation, 2013-14 | Change |
| Outdoor track and field | 486,355 | 478,885 | 1.6% |
| Volleyball | 470,488 | 429,634 | 9.5% |
| Soccer | 377,838 | 374,564 | 0.9% |
| Basketball | 373,366 | 433,344 | -13.8% |
| Fast-pitch softball | 344,952 | 364,297 | -5.3% |
| Cross-country | 197,630 | 218,121 | -9.4% |
| Tennis | 191,036 | 184,080 | 3.8% |
| Competitive spirit | 149,694 | 120,593 | 24.1% |
| Swimming and diving | 140,711 | 165,779 | -15.1% |
| Lacrosse | 98,014 | 81,969 | 19.6% |
Participation in football fell by 6.3% between 2013-14 and 2022-23. Among the top 10 boys’ sports, only swimming and diving (18.5%) dropped more on a percentage basis. Among the top 10 girls’ sports, swimming and diving (15.1%), basketball (13.8%) and cross-country (9.4%) saw the biggest decreases. However, each of those sports has just a fraction of the overall participants that football has, making football’s percentage decline even more eye-opening.
The fastest-growing sports by percentage were all on the girls’ side. Competitive spirit (such as cheerleading and dance team) grew by 24.1%, lacrosse by 19.6% and volleyball by 9.5%.
The only two boys’ sports to grow during those 10 years: soccer (7.3%) and outdoor track and field (4.1%).
Managing the cost of high school sports
While the participation data didn’t include reasons for the nationwide drop, some possibilities seem fairly obvious.
- First, the pandemic had a seismic effect on high school sports. It makes sense that participation numbers would take several years to recover. For example, even though the darkest days of the pandemic are in the rearview mirror, it’s likely that a significant number of parents still aren’t far enough removed to be comfortable with their kids fully participating in high school sports.
- Second, sports injuries — and concussions in particular — became a bigger focus of conversation in the decade covered by this report. That could be a reason for the significant drop-off in participation in football, but it has likely affected other sports as well.
- Lastly, cost. It’s things like team fundraisers, equipment, gas to get to and from games, dinner out on a night when the game ends so late that you don’t want to cook and more. A May 2023 LendingTree survey found that parents with kids in after-school activities spend $731 a child annually on those activities. Sports was, by far, the most common one, with 70% of parents saying they had a kid who participated. The survey showed that 62% of parents with kids in extracurriculars say they’ve been stressed out about those costs, and 42% of them said they’ve taken on debt to pay for those activities. That’s a big deal, as the pressure for your kid to take part in these extracurriculars — like select travel leagues — is enormous. If they don’t, they can fall behind their athletic peers, potentially hurting their ability to make the high school team. That puts many parents in a real bind, considering how small most Americans’ financial margin for error is these days.
Thankfully, there are ways to help control costs, at least to a degree:
- Use hand-me-down equipment, either from friends and family or from secondhand stores.
- Split the cost of travel with families of other kids on the team, including carpooling or sharing a hotel room on a trip.
- Utilize credit card rewards, giving you a percentage point or two back on everything you buy, a few cents off per gallon of gas or even a free hotel night.
It’s essential to be creative to save yourself money on these sports, because the truth is that they are important. Sports can be an amazing way for a kid to learn invaluable lessons and grow as a person, even though those lessons can come with a big financial cost.
Methodology
LendingTree analyzed surveys from the National Federation of State High School Associations for the 2013-14 and 2022-23 school years. Data for the 2019-20 and 2020-21 school years were unavailable due to the COVID-19 pandemic.
To calculate the number of high school students (ninth through 12th grade) in each state, researchers used data from the 2013 and 2022 U.S. Census Bureau American Community Surveys with one-year estimates.
To determine the number of unique individual participants, LendingTree commissioned QuestionPro to conduct an online survey of 648 U.S. parents with minor children from Oct. 5 to 10, 2023. The survey was administered using a nonprobability-based sample, and quotas were used to ensure the sample base represented the overall population. Researchers reviewed all responses for quality control.
We applied our survey results to the NFHS’ national and state numbers (which had duplicative counts) to derive overall participation levels and rates.
Get debt consolidation loan offers from up to 5 lenders in minutes