12 Million Baby Boomers Rent Their Homes — Here’s Where It’s Most Common


Baby boomers are commonly thought to have had an easier path to homeownership than subsequent generations. Yet, a significant number of boomers are renters today.
LendingTree research found that 18.6% of baby boomers (around 12 million of them) are choosing to forego homeownership and rent instead. While it’s the smallest rate of renters across generations, the percentage is much higher for boomers who live in coastal cities like New York or Los Angeles.
Learn more about where boomers are most likely to rent versus own, and the potential reasons driving the trend, along with some tips for renting as an older American.
Key findings
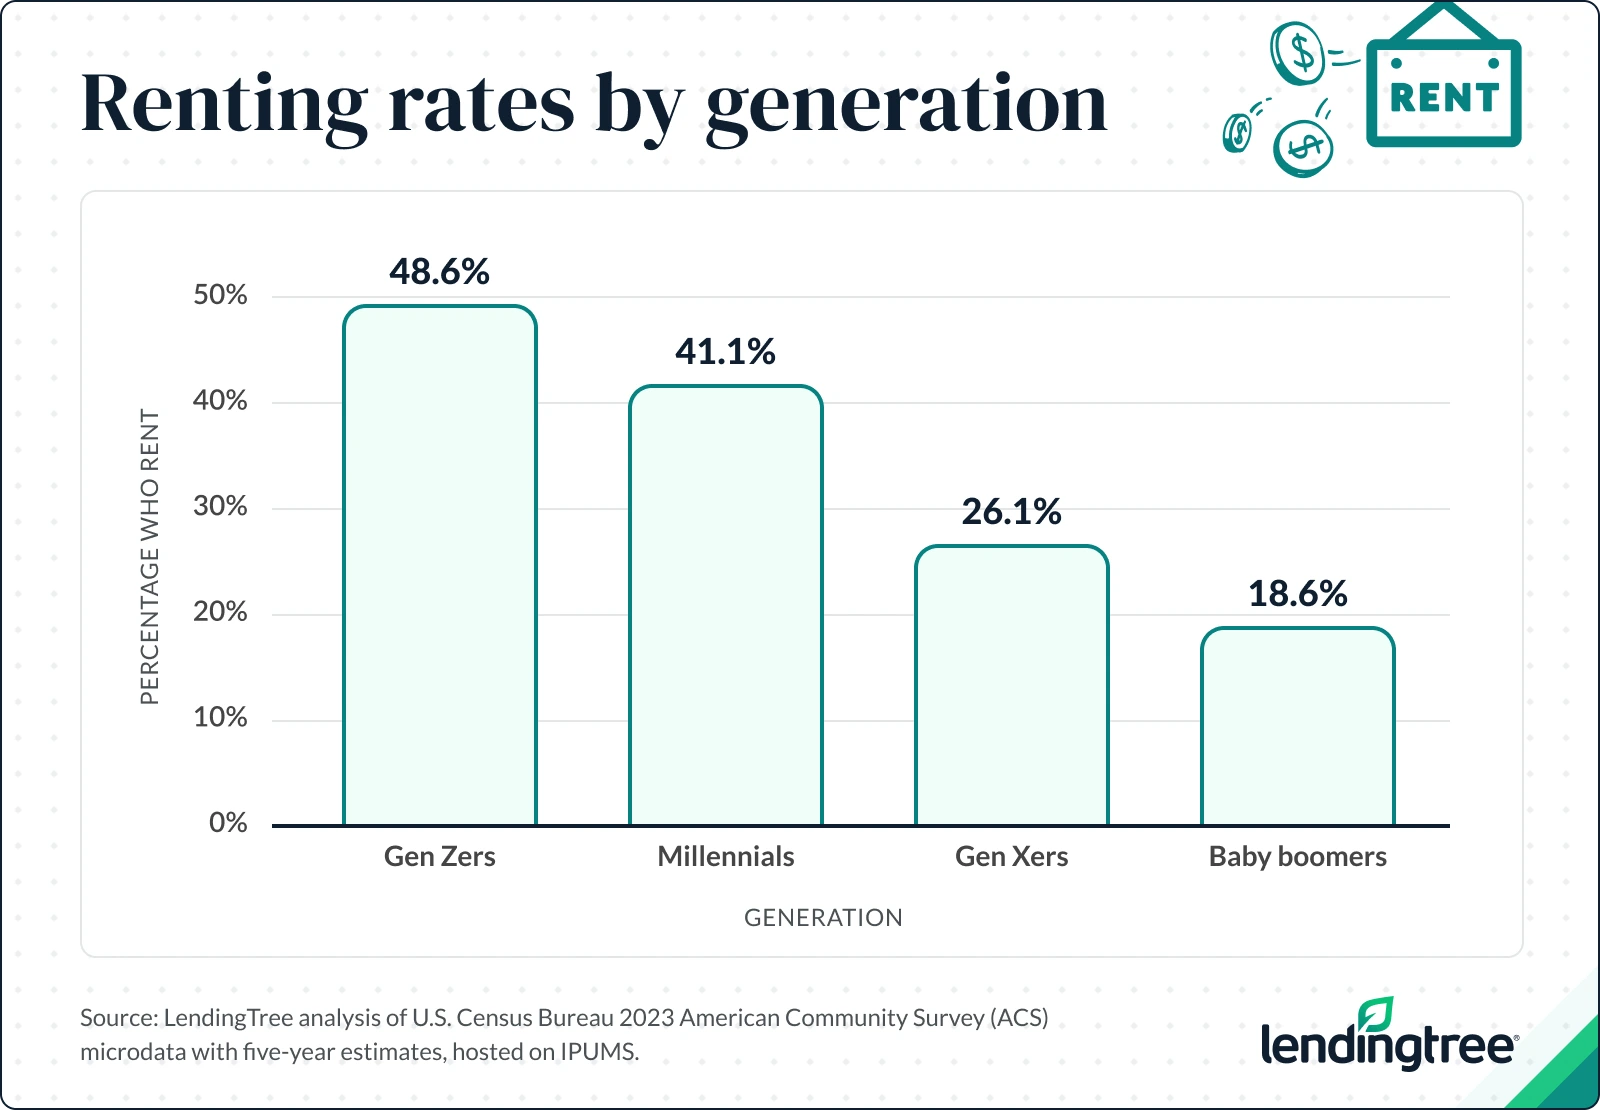
- 12 million baby boomers — or 18.6% of the generation — rent. That rate is far lower compared with Gen Zers (48.6%), millennials (41.1%) and Gen Xers (26.1%). Among baby boomers who rent, 55.2% are women.
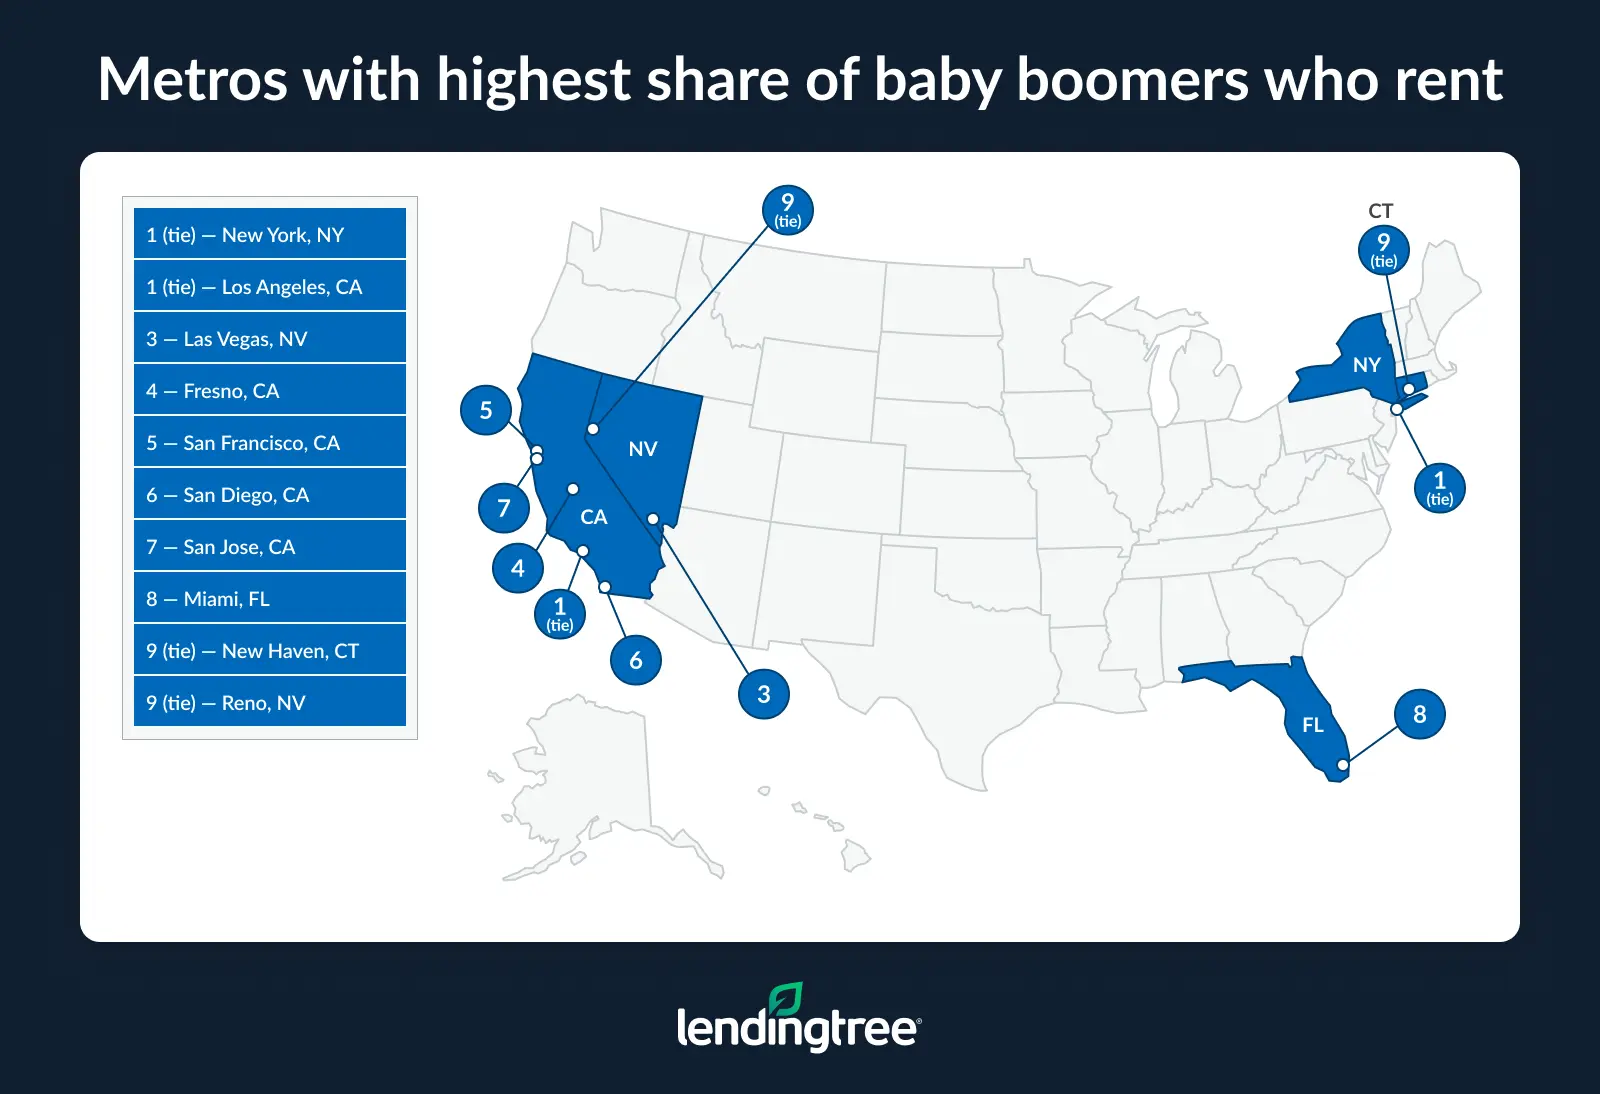
- Nearly 1 in 3 baby boomers (32.3%) rent in New York and Los Angeles — the highest by metro. Las Vegas ranks third, with 26.5% of baby boomers renting.
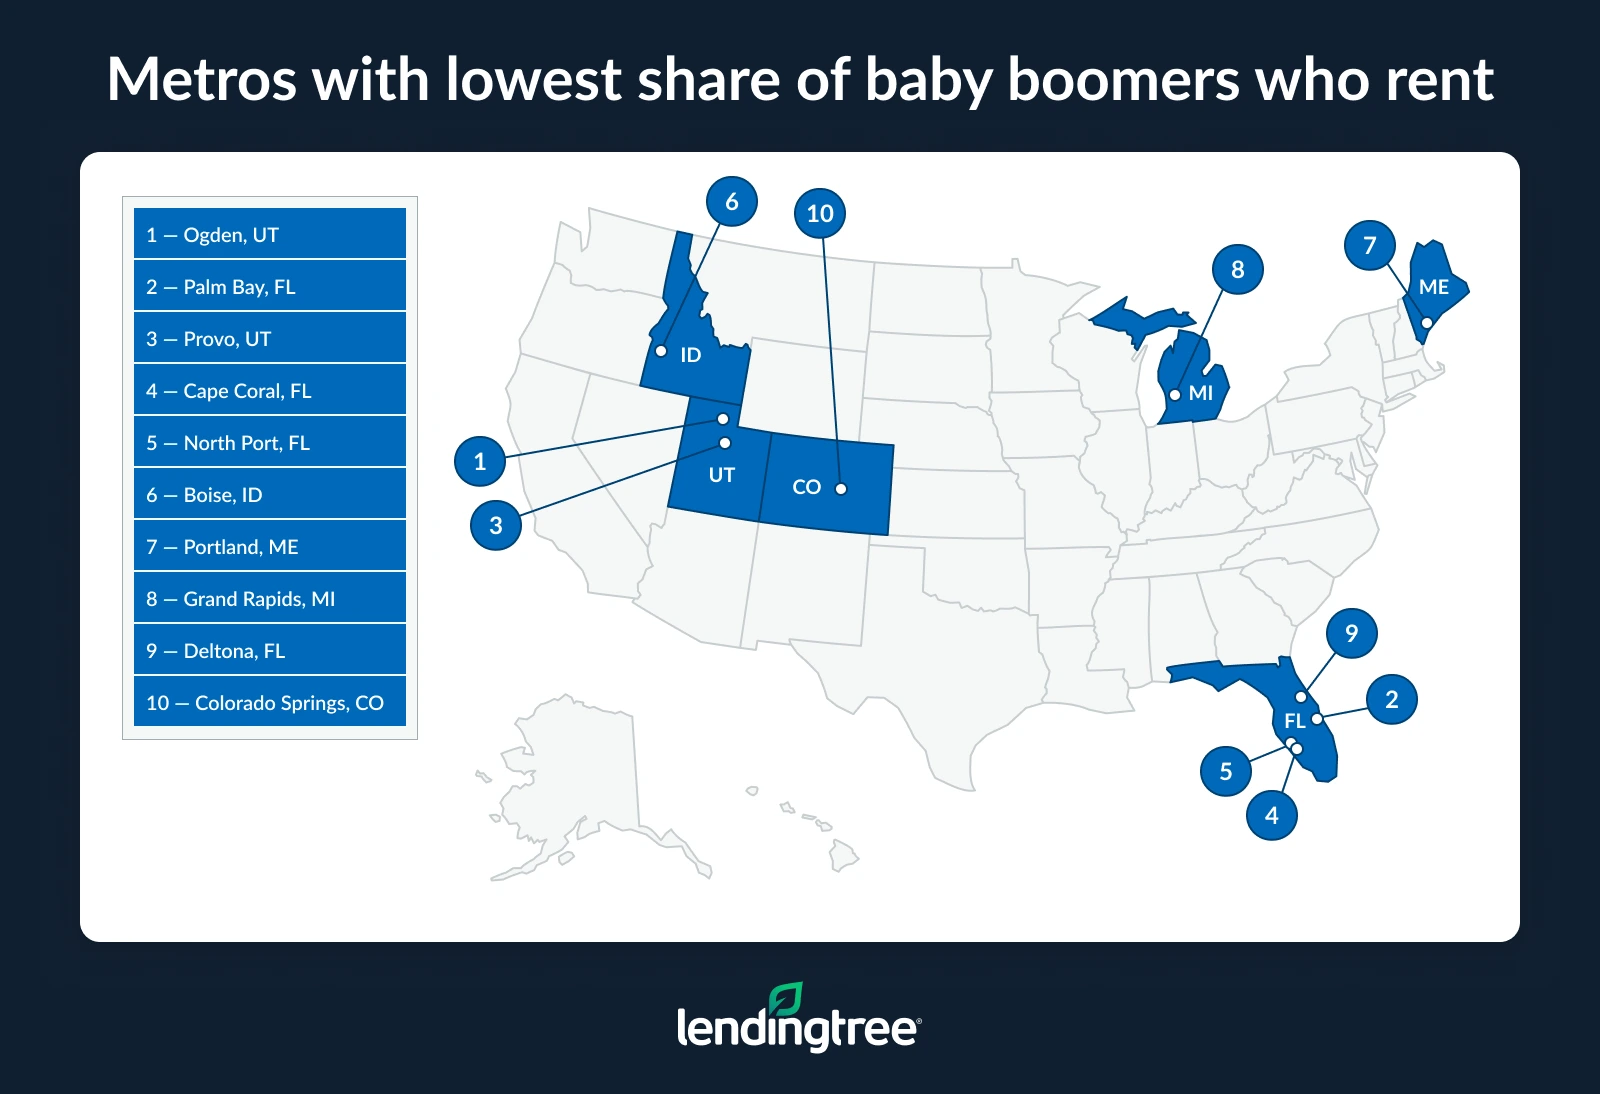
- Baby boomers in Ogden, Utah (11.0%), are the least likely to rent. Palm Bay, Fla. (11.5%), and Provo, Utah (11.8%), follow with low boomer rental rates. Four of the 10 locations with the lowest rental rates among baby boomers are in Florida.
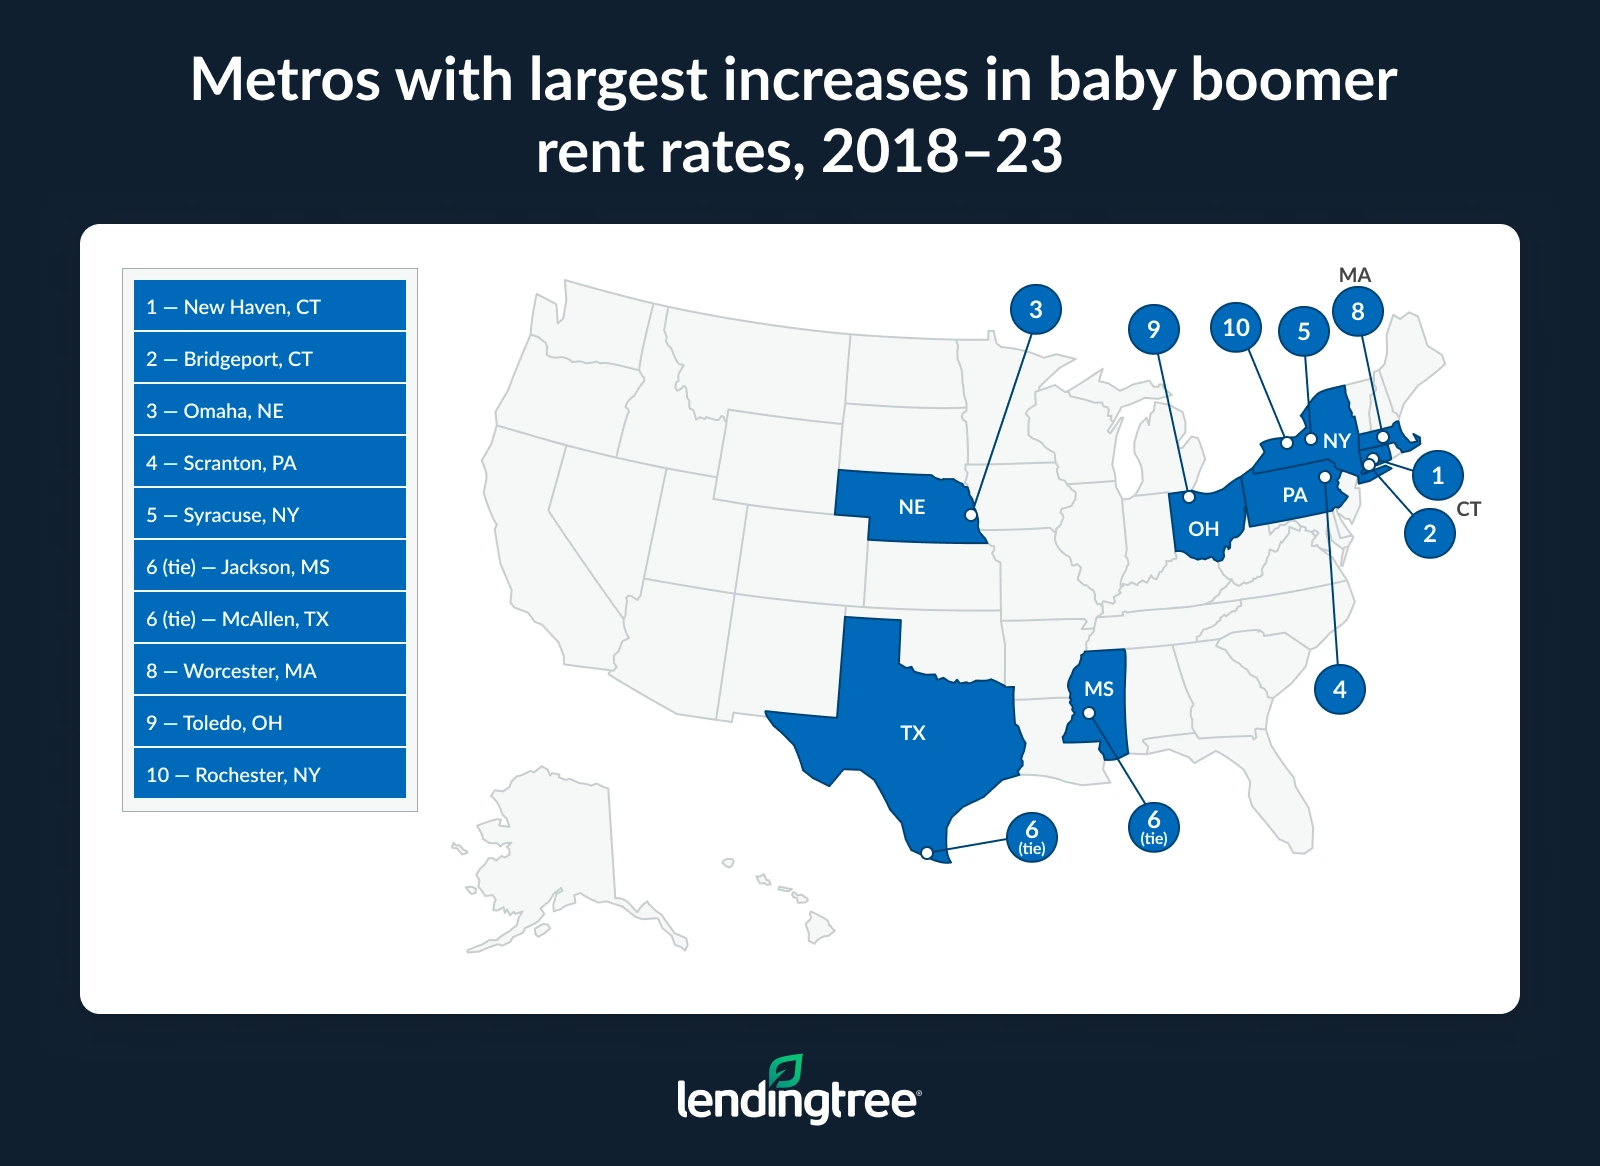
- Nationally, the share of baby boomers renting fell 8.9%, from 20.5% in 2018 to 18.6% in 2023. The share dropped the most in Cape Coral, Fla. (30.8%), North Port, Fla. (29.4%), and Stockton, Calif. (28.4%). In contrast, the share grew the most in New Haven, Conn. (11.2%), Bridgeport, Conn. (5.5%), and Omaha, Neb. (3.4%).
18.6% of baby boomers rent their homes
According to a LendingTree analysis of the latest available data from the U.S. Census Bureau, a little more than 1 in 6 baby boomers — around 12 million, or 18.6% of the generation — rented rather than owned a home as of 2023. (Baby boomers included in the research were born between 1946 and 1964, and were ages 59 to 77 in 2023.)
This percentage of renters is lower than it is in other generations:
- Gen Zers (born after 1996; ages 18 to 26 in 2023): 48.6%
- Millennials (born between 1981 and 1996; ages 27 to 42 in 2023): 41.1%
- Gen Xers (born between 1965 and 1980; ages 43 to 58 in 2023): 26.1%
“I think a lot of boomers rent simply because of the convenience,” says Matt Schulz, LendingTree chief consumer finance analyst and author of “Ask Questions, Save Money, Make More: How to Take Control of Your Financial Life.” “They want to be able to call someone if the pipes burst or if the air conditioning goes out. They don’t want to mess with mowing the lawn and pulling weeds. Renting makes a lot of things in life easier.”
Another possible reason boomers are renting is that they don’t need the amount of space they used to have. In fact, the LendingTree research revealed that 56.4% of boomers who rent live alone. Meanwhile, 14.4% live with a spouse and 9.6% live with relatives. Boomer women also outnumber men when it comes to renting (55.2% versus 44.8%).
Regardless of household dynamics, for some boomers, it makes sense to downsize. “Instead of paying to keep the big house they raised their family in, many have likely cashed out, moved into a rental and are using the profits from that home sale to make their retirement years a little more comfortable financially,” Schulz says.
New York, Los Angeles have highest baby boomer rent rates
Certain metros have a much higher rental rate among baby boomers. Tied for first in the nation are New York and Los Angeles, where nearly 1 in 3 boomers (32.3%) rent. In third is Las Vegas, with just over a quarter (26.5%) of boomers renting. Rounding out the top 10 are four more California cities: Fresno, San Francisco, San Diego and San Jose (ranking four through seven), followed by Miami, New Haven, Conn., and Reno, Nev.
California has an especially high concentration of boomer renters, accounting for 10 of the top 23 metros. Rent rates in these metros range from 32.3% in Los Angeles to 20.1% in Oxnard, all exceeding the national rate of 18.6%.
As for why certain cities are more conducive for boomers to rent versus own, it likely comes down to cost, Schulz says. “It’s crazy expensive to buy a home in places like LA and New York. Just a down payment can be outrageous. For those boomers who want to live in a big city, especially a big coastal city, renting may be the only reasonable option.”
This can be especially true for those with mortgage payments. Recent LendingTree research compared the cost difference between renting and owning a home with a mortgage and found that the gap in 2023 was widest in the San Francisco, Bridgeport, Conn., and New York metros (each of which is in the top 20 boomer rental areas). In those areas, people would save $1,300-plus per month by renting versus owning.
Generally speaking, renting tends to be more prevalent in areas with higher home prices. In fact, the only two metros in the nation where renters are the majority are New York (where 51.9% of households rent), followed by Los Angeles (51.5%), as of the fourth quarter of 2024, according to a Redfin report. It’s no coincidence that those cities also ranked atop our boomer rental list. For context, the median sales price for homes in Los Angeles in September 2025 was $1.1 million; in New York City, it was $745,000.
Even boomers who’ve fully paid off mortgages may find financial benefits to renting if it allows them to avoid high property taxes. This expense happens to run high in the majority of the top 10 cities where boomers rent, as revealed in recent LendingTree research on property taxes. The study found that New York, San Jose, San Francisco, Los Angeles and San Diego were among the 10 metros with the highest median property taxes. And while Las Vegas property taxes are on the lower side, they increased 13.6% from 2021 to 2023.
Baby boomers in Ogden, Utah, least likely to rent
On the other end of the spectrum, rental rates among boomers are much lower in some metros. The metro least likely to have boomer renters is Ogden, Utah, where just over 1 in 10 (11.0%) boomers don’t own the properties they live in. Palm Bay, Fla. (11.5%), and Provo, Utah (11.8%), have similarly low percentages.
In addition to Palm Bay, three more of the 10 metros with the lowest boomer rental rates are in Florida: Cape Coral, North Port and Deltona.
Just as there is a correlation between high home prices and high rental rates for the metros at the top of the list, renting tends to be less common in areas where homes are more affordable. For example, in Cape Coral, Fla., where the median sales price in September 2025 was $350,000 (compared to a national median sales price in September 2025 of $435,295), just 15.5% of households rent. Similarly, in North Port, Fla., where the median sales price was $347,350, the rental rate is lower at 22.3%.
The median home sales price in September 2025 was also low for the bottom two cities: In Ogden, Utah, it was $390,500, and in Palm Bay, Fla., it was $365,000.
As for property taxes, in Utah (which has two of the three metros with the lowest rental rates for boomers), the average effective property tax rate is 0.55%, the eighth-lowest in the U.S. Florida also has property taxes that are lower than the national average (though there is some variation in rates depending on the county).
Full rankings: Metros with highest/lowest share of baby boomers who rent
| Rank | Metro | % who rent |
|---|---|---|
| 1 | New York, NY | 32.3% |
| 1 | Los Angeles, CA | 32.3% |
| 3 | Las Vegas, NV | 26.5% |
| 4 | Fresno, CA | 25.8% |
| 5 | San Francisco, CA | 25.6% |
| 6 | San Diego, CA | 24.4% |
| 7 | San Jose, CA | 24.2% |
| 8 | Miami, FL | 24.0% |
| 9 | New Haven, CT | 23.8% |
| 9 | Reno, NV | 23.8% |
| 11 | Bakersfield, CA | 23.4% |
| 12 | Honolulu, HI | 22.3% |
| 13 | Providence, RI | 22.2% |
| 14 | Milwaukee, WI | 21.7% |
| 14 | Stockton, CA | 21.7% |
| 16 | Boston, MA | 21.3% |
| 17 | Bridgeport, CT | 21.0% |
| 18 | Worcester, MA | 20.8% |
| 19 | Riverside, CA | 20.5% |
| 20 | Memphis, TN | 20.3% |
| 20 | Sacramento, CA | 20.3% |
| 20 | Columbus, OH | 20.3% |
| 23 | Oxnard, CA | 20.1% |
| 24 | Virginia Beach, VA | 20.0% |
| 25 | El Paso, TX | 19.9% |
| 25 | Cleveland, OH | 19.9% |
| 27 | New Orleans, LA | 19.8% |
| 27 | Dallas, TX | 19.8% |
| 29 | Seattle, WA | 19.7% |
| 30 | Scranton, PA | 19.4% |
| 30 | Houston, TX | 19.4% |
| 32 | Portland, OR | 19.3% |
| 32 | Toledo, OH | 19.3% |
| 32 | Albany, NY | 19.3% |
| 35 | Chicago, IL | 19.1% |
| 36 | Buffalo, NY | 18.8% |
| 37 | Washington, DC | 18.7% |
| 38 | Dayton, OH | 18.6% |
| 39 | Syracuse, NY | 18.5% |
| 39 | Baltimore, MD | 18.5% |
| 41 | Wichita, KS | 18.3% |
| 42 | Hartford, CT | 18.2% |
| 42 | Omaha, NE | 18.2% |
| 42 | San Antonio, TX | 18.2% |
| 45 | Kansas City, MO | 18.0% |
| 45 | Greensboro, NC | 18.0% |
| 47 | Orlando, FL | 17.9% |
| 47 | Fayetteville, AR | 17.9% |
| 47 | Philadelphia, PA | 17.9% |
| 50 | Oklahoma City, OK | 17.8% |
| 50 | Austin, TX | 17.8% |
| 52 | Charlotte, NC | 17.7% |
| 53 | Tulsa, OK | 17.5% |
| 54 | Cincinnati, OH | 17.4% |
| 54 | Tampa, FL | 17.4% |
| 56 | Chattanooga, TN | 17.3% |
| 56 | Atlanta, GA | 17.3% |
| 56 | Jackson, MS | 17.3% |
| 59 | Rochester, NY | 17.1% |
| 59 | Indianapolis, IN | 17.1% |
| 59 | McAllen, TX | 17.1% |
| 59 | Allentown, PA | 17.1% |
| 63 | Denver, CO | 17.0% |
| 63 | Little Rock, AR | 17.0% |
| 65 | Winston-Salem, NC | 16.9% |
| 65 | Jacksonville, FL | 16.9% |
| 67 | Raleigh, NC | 16.8% |
| 68 | Augusta, GA | 16.7% |
| 69 | Spokane, WA | 16.6% |
| 69 | Akron, OH | 16.6% |
| 71 | Detroit, MI | 16.5% |
| 72 | Louisville, KY | 16.4% |
| 73 | Richmond, VA | 16.3% |
| 74 | Albuquerque, NM | 16.1% |
| 75 | Pittsburgh, PA | 16.0% |
| 76 | Nashville, TN | 15.9% |
| 76 | Lakeland, FL | 15.9% |
| 78 | Harrisburg, PA | 15.8% |
| 78 | St. Louis, MO | 15.8% |
| 80 | Baton Rouge, LA | 15.6% |
| 80 | Phoenix, AZ | 15.6% |
| 80 | Tucson, AZ | 15.6% |
| 83 | Knoxville, TN | 14.9% |
| 83 | Charleston, SC | 14.9% |
| 85 | Des Moines, IA | 14.6% |
| 86 | Minneapolis, MN | 14.5% |
| 86 | Columbia, SC | 14.5% |
| 86 | Birmingham, AL | 14.5% |
| 89 | Salt Lake City, UT | 14.2% |
| 90 | Greenville, SC | 13.7% |
| 91 | Colorado Springs, CO | 13.5% |
| 92 | Deltona, FL | 13.3% |
| 93 | Grand Rapids, MI | 12.4% |
| 94 | Portland, ME | 12.3% |
| 95 | Boise, ID | 12.1% |
| 96 | North Port, FL | 12.0% |
| 97 | Cape Coral, FL | 11.9% |
| 98 | Provo, UT | 11.8% |
| 99 | Palm Bay, FL | 11.5% |
| 100 | Ogden, UT | 11.0% |
Rate of baby boomers who rent is falling
Even though the rate of boomers renting seems significant, the share of baby boomers renting nationally is trending downward. It fell 8.9% between 2018 and 2023, from 20.5% to 18.6%.
Despite the overall trend, there are some large disparities depending on the area. Some areas saw increases in boomer rental rates during that five years, with the most notable jumps in New Haven, Conn. (11.2%), Bridgeport, Conn. (5.5%), and Omaha, Neb. (3.4%). In other areas, the boomer rental rate decreased even more dramatically, with the biggest drops occurring in Cape Coral, Fla. (30.8%), North Port, Fla. (29.4%), and Stockton, Calif. (28.4%).
The underlying explanation for these changes in rental habits could be attributed to any number of economic factors that have occurred in those five years, Schulz notes. But, he adds, the large swing in mortgage interest rates driven by the pandemic is the most likely to have influenced housing decisions.
“Many Americans who managed to keep their jobs throughout the darkest days of the pandemic found themselves flush with cash as things got back to normal, thanks to reduced spending, government stimulus and other factors,” Schulz explains. “At the same time, mortgage rates were at or near historic lows. That combination of low interest rates and excess cash on hand likely spurred many boomers to dive back into the housing market.”
As for what’s to come, Schulz is guessing that the downward rental trend for boomers may reverse itself in the coming years. “The convenience of renting combined with stubborn inflation, high housing costs and high interest rates will likely mean more boomers choosing not to buy.”
Full rankings: Metros with largest increases/decreases in baby boomer rent rates, 2018-23
| Rank | Metro | % renting in 2018 | % renting in 2023 | % change |
|---|---|---|---|---|
| 1 | New Haven, CT | 21.4% | 23.8% | 11.2% |
| 2 | Bridgeport, CT | 19.9% | 21.0% | 5.5% |
| 3 | Omaha, NE | 17.6% | 18.2% | 3.4% |
| 4 | Scranton, PA | 18.8% | 19.4% | 3.2% |
| 5 | Syracuse, NY | 18.0% | 18.5% | 2.8% |
| 6 | Jackson, MS | 17.0% | 17.3% | 1.8% |
| 6 | McAllen, TX | 16.8% | 17.1% | 1.8% |
| 8 | Worcester, MA | 20.5% | 20.8% | 1.5% |
| 9 | Toledo, OH | 19.1% | 19.3% | 1.0% |
| 10 | Rochester, NY | 17.0% | 17.1% | 0.6% |
| 11 | Cleveland, OH | 19.9% | 19.9% | 0.0% |
| 12 | Boston, MA | 21.4% | 21.3% | -0.5% |
| 12 | Buffalo, NY | 18.9% | 18.8% | -0.5% |
| 12 | Hartford, CT | 18.3% | 18.2% | -0.5% |
| 15 | Pittsburgh, PA | 16.1% | 16.0% | -0.6% |
| 16 | Philadelphia, PA | 18.1% | 17.9% | -1.1% |
| 17 | Milwaukee, WI | 22.0% | 21.7% | -1.4% |
| 18 | San Jose, CA | 24.7% | 24.2% | -2.0% |
| 19 | New York, NY | 33.1% | 32.3% | -2.4% |
| 20 | Wichita, KS | 18.8% | 18.3% | -2.7% |
| 21 | Allentown, PA | 17.7% | 17.1% | -3.4% |
| 22 | Portland, OR | 20.0% | 19.3% | -3.5% |
| 23 | Kansas City, MO | 18.7% | 18.0% | -3.7% |
| 24 | Seattle, WA | 20.5% | 19.7% | -3.9% |
| 25 | Albany, NY | 20.1% | 19.3% | -4.0% |
| 26 | Columbus, OH | 21.2% | 20.3% | -4.2% |
| 27 | Providence, RI | 23.3% | 22.2% | -4.7% |
| 28 | Salt Lake City, UT | 15.0% | 14.2% | -5.3% |
| 29 | Cincinnati, OH | 18.4% | 17.4% | -5.4% |
| 29 | Harrisburg, PA | 16.7% | 15.8% | -5.4% |
| 31 | Los Angeles, CA | 34.2% | 32.3% | -5.6% |
| 32 | Spokane, WA | 17.6% | 16.6% | -5.7% |
| 33 | Minneapolis, MN | 15.4% | 14.5% | -5.8% |
| 34 | Chicago, IL | 20.3% | 19.1% | -5.9% |
| 35 | Washington, DC | 19.9% | 18.7% | -6.0% |
| 36 | New Orleans, LA | 21.1% | 19.8% | -6.2% |
| 36 | Augusta, GA | 17.8% | 16.7% | -6.2% |
| 38 | Columbia, SC | 15.5% | 14.5% | -6.5% |
| 39 | Dayton, OH | 20.0% | 18.6% | -7.0% |
| 39 | Baltimore, MD | 19.9% | 18.5% | -7.0% |
| 41 | Bakersfield, CA | 25.2% | 23.4% | -7.1% |
| 42 | Oklahoma City, OK | 19.2% | 17.8% | -7.3% |
| 43 | San Francisco, CA | 27.7% | 25.6% | -7.6% |
| 44 | Oxnard, CA | 21.8% | 20.1% | -7.8% |
| 44 | Charlotte, NC | 19.2% | 17.7% | -7.8% |
| 44 | Akron, OH | 18.0% | 16.6% | -7.8% |
| 47 | Grand Rapids, MI | 13.5% | 12.4% | -8.1% |
| 48 | Virginia Beach, VA | 21.8% | 20.0% | -8.3% |
| 48 | Dallas, TX | 21.6% | 19.8% | -8.3% |
| 50 | Chattanooga, TN | 18.9% | 17.3% | -8.5% |
| 50 | Provo, UT | 12.9% | 11.8% | -8.5% |
| 52 | Knoxville, TN | 16.3% | 14.9% | -8.6% |
| 53 | Reno, NV | 26.1% | 23.8% | -8.8% |
| 54 | Houston, TX | 21.3% | 19.4% | -8.9% |
| 55 | St. Louis, MO | 17.4% | 15.8% | -9.2% |
| 56 | Baton Rouge, LA | 17.3% | 15.6% | -9.8% |
| 56 | Ogden, UT | 12.2% | 11.0% | -9.8% |
| 58 | Memphis, TN | 22.6% | 20.3% | -10.2% |
| 59 | San Diego, CA | 27.2% | 24.4% | -10.3% |
| 60 | Indianapolis, IN | 19.1% | 17.1% | -10.5% |
| 61 | El Paso, TX | 22.3% | 19.9% | -10.8% |
| 62 | Denver, CO | 19.1% | 17.0% | -11.0% |
| 63 | Riverside, CA | 23.1% | 20.5% | -11.3% |
| 64 | San Antonio, TX | 20.6% | 18.2% | -11.7% |
| 65 | Louisville, KY | 18.6% | 16.4% | -11.8% |
| 66 | Nashville, TN | 18.1% | 15.9% | -12.2% |
| 67 | Austin, TX | 20.3% | 17.8% | -12.3% |
| 68 | Raleigh, NC | 19.2% | 16.8% | -12.5% |
| 68 | Albuquerque, NM | 18.4% | 16.1% | -12.5% |
| 70 | Greensboro, NC | 20.6% | 18.0% | -12.6% |
| 70 | Des Moines, IA | 16.7% | 14.6% | -12.6% |
| 72 | Detroit, MI | 18.9% | 16.5% | -12.7% |
| 73 | Little Rock, AR | 19.5% | 17.0% | -12.8% |
| 74 | Fresno, CA | 29.8% | 25.8% | -13.4% |
| 75 | Honolulu, HI | 25.8% | 22.3% | -13.6% |
| 75 | Sacramento, CA | 23.5% | 20.3% | -13.6% |
| 77 | Miami, FL | 27.9% | 24.0% | -14.0% |
| 77 | Portland, ME | 14.3% | 12.3% | -14.0% |
| 79 | Birmingham, AL | 16.9% | 14.5% | -14.2% |
| 80 | Atlanta, GA | 20.2% | 17.3% | -14.4% |
| 81 | Fayetteville, AR | 21.0% | 17.9% | -14.8% |
| 82 | Jacksonville, FL | 19.9% | 16.9% | -15.1% |
| 83 | Lakeland, FL | 18.8% | 15.9% | -15.4% |
| 84 | Winston-Salem, NC | 20.0% | 16.9% | -15.5% |
| 85 | Richmond, VA | 19.4% | 16.3% | -16.0% |
| 86 | Colorado Springs, CO | 16.1% | 13.5% | -16.1% |
| 87 | Las Vegas, NV | 32.3% | 26.5% | -18.0% |
| 88 | Deltona, FL | 16.3% | 13.3% | -18.4% |
| 89 | Charleston, SC | 18.3% | 14.9% | -18.6% |
| 90 | Tampa, FL | 21.4% | 17.4% | -18.7% |
| 91 | Boise, ID | 15.0% | 12.1% | -19.3% |
| 92 | Orlando, FL | 22.6% | 17.9% | -20.8% |
| 93 | Greenville, SC | 17.6% | 13.7% | -22.2% |
| 94 | Tucson, AZ | 20.7% | 15.6% | -24.6% |
| 95 | Phoenix, AZ | 20.8% | 15.6% | -25.0% |
| 96 | Palm Bay, FL | 16.0% | 11.5% | -28.1% |
| 97 | Stockton, CA | 30.3% | 21.7% | -28.4% |
| 98 | North Port, FL | 17.0% | 12.0% | -29.4% |
| 99 | Cape Coral, FL | 17.2% | 11.9% | -30.8% |
Renting as an older American: Top expert tips
For baby boomers who are considering making the shift from homeowner to renter, it’s important to think through the factors that could impact your future finances and quality of life. Some of the most important things to consider include:
- Location, location, location. It’s advice you likely heard when you were buying, but deciding where you want to rent is equally important, especially in your golden years, Schulz says. “Make sure to think through what your priorities are, possibly including proximity to family, availability of health care options, low taxes and other costs, entertainment options and so on,” he says. Some retirees may want to live in areas that are walkable and have a high concentration of cultural activities, while others might want to be closer to nature or their grandchildren, for example. For others, the cost of living is a top concern. “Considering what you value most can go a long way toward leading you to the right location for your home,” Schulz says.
- The terms of the lease. Though renting might not be as big a financial decision as buying, it’s still important to approach your rental agreement with eagle eyes. “Your lease terms matter. For example, you might be able to negotiate a lower rate on your rental if you’re willing to sign a longer lease,” Schulz says. That doesn’t mean you should sign for longer than you’re comfortable with, he added, but if you expect to be living in that location for an extended period of time, it may be worth considering.
- Rental costs, and their potential rise. In some ways, you may reduce your expenses if you rent instead of own because you will no longer have to pay property taxes or home insurance, or be responsible for major home repairs. However, unlike a fixed mortgage payment, rent can increase over time, and that’s something you should plan for. “Everyone’s comfort level is different when it comes to spending on a home. A well-thought-out budget can help you figure out what works best for you, but you can’t get there unless you understand exactly how much money comes in and goes out of your home each month,” Schulz says. “Once you know that, you can choose how to spend based on your priorities. It may not sound fun to create a budget, but it’s important, especially when you’re on a fixed income.”
Methodology
LendingTree analysts used U.S. Census Bureau 2023 American Community Survey (ACS) microdata with five-year estimates, hosted on IPUMS, to identify baby boomers who rent their homes.
Researchers examined the 100 largest metros with available ACS data and calculated the share of baby boomers renting in each. To ensure results reflected the household population, the analysis excluded group quarters (such as dormitories, prisons and nursing homes), vacant housing and cases where tenure was unreported.
The generations researchers examined include:
- Generation Zers (born after 1996; ages 18 to 26 in 2023)
- Millennials (born between 1981 and 1996; ages 27 to 42 in 2023)
- Generation Xers (born between 1965 and 1980; ages 43 to 58 in 2023)
- Baby boomers (born between 1946 and 1964; ages 59 to 77 in 2023)
Analysts also used the 2018 ACS with five-year estimates to compare changes in baby boomer renting between 2018 (when baby boomers were between 54 and 72 years old) and 2023.
View mortgage loan offers from up to 5 lenders in minutes