Property Taxes Rose in Every Large US Metro Between 2023 and 2024
Property taxes are a growing burden for American homeowners, with costs rising across every major metro. Homeowners pay a median of more than $3,000 a year in property taxes, climbing 5.1% from 2023 to 2024.
Here’s a closer look at where property taxes rose the most.
- Homeowners pay a median of $3,119 annually in property taxes, or $260 a month. Those with a mortgage pay $913 more annually than those without one ($3,489 versus $2,576). Overall, property taxes increased by 5.1%, or $150, from 2023 to 2024.
- Property taxes increased in each of the largest metros between 2023 and 2024. The biggest increases were in Tampa, Fla. (7.7%), Denver (7.4%) and Miami (7.1%), while the smallest were in Milwaukee (0.7%), Phoenix (1.0%) and Memphis, Tenn. (1.1%).
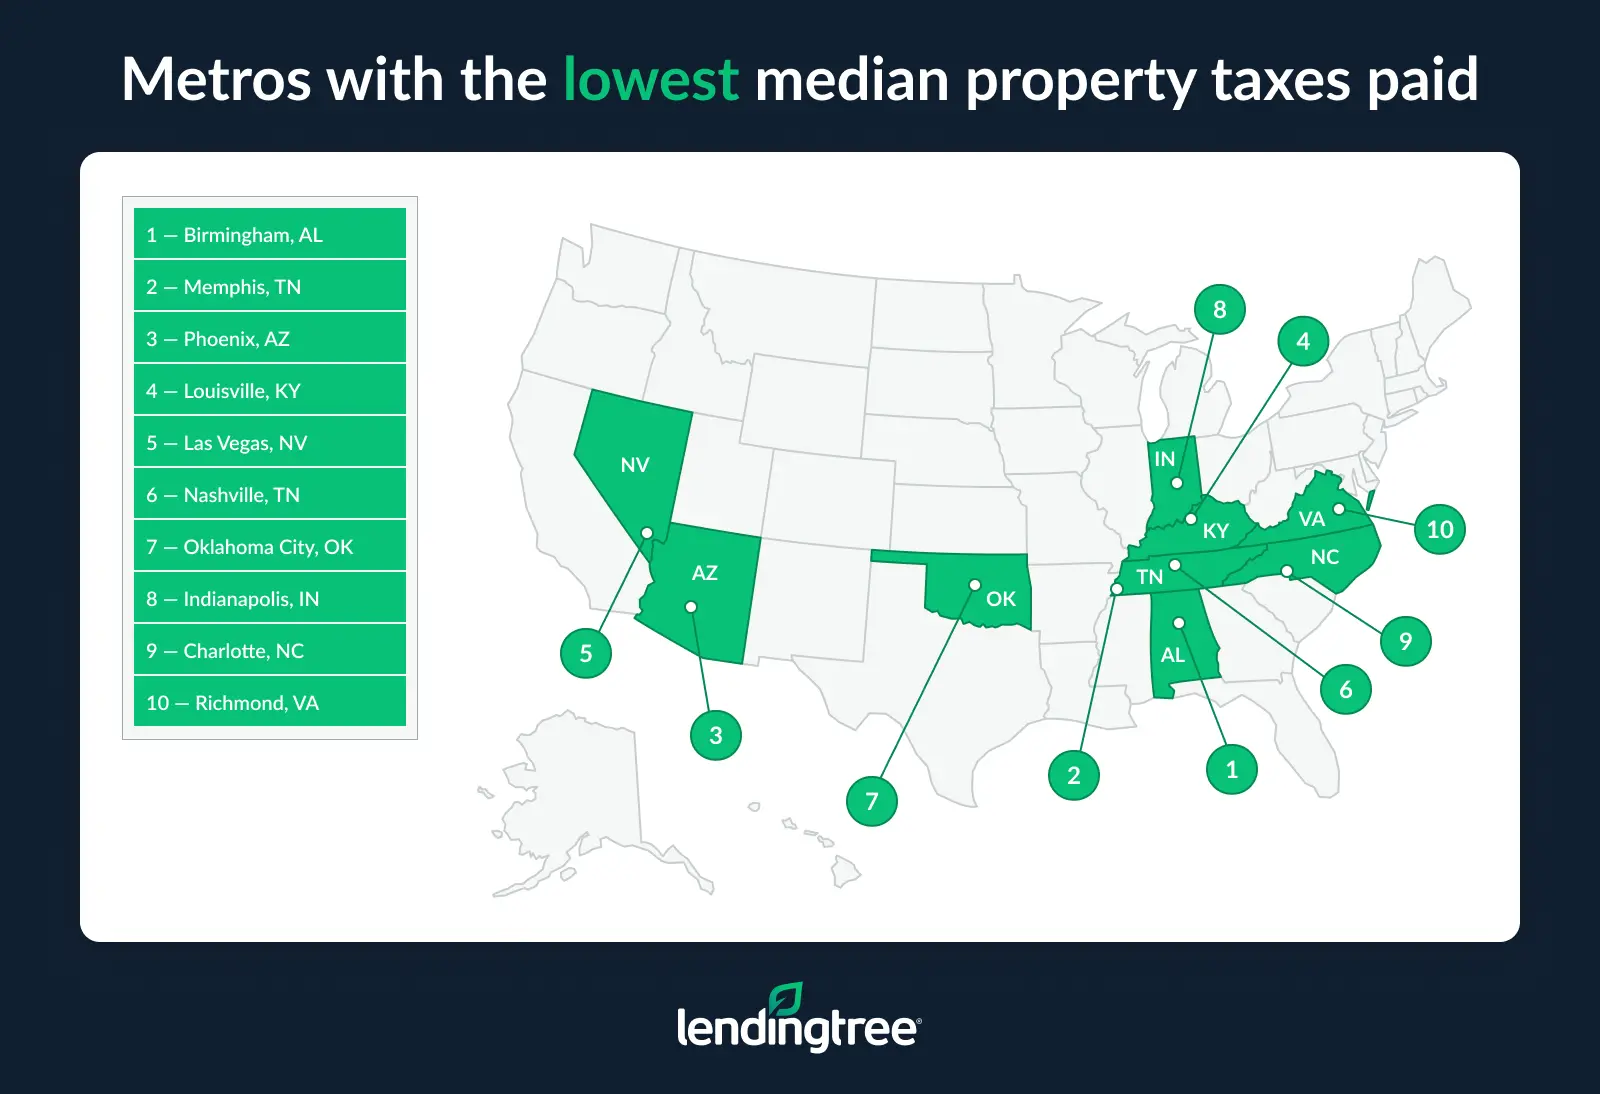
- Among the 50 largest metros, Birmingham, Ala., has the lowest median property taxes at $1,156. Memphis and Phoenix follow at $1,877 and $1,947, respectively.
- New York, San Jose, Calif., and San Francisco have the highest median property taxes. In New York, the median exceeds $10,000, followed by San Jose ($9,901) and San Francisco ($8,522). Among the 10 metros with the highest property taxes, four are in California and two are in Texas.
- Among the largest metros, Phoenix, Las Vegas and Birmingham pay the smallest percentage of their home value in property taxes. Homeowners in Phoenix have an effective tax rate of 0.44%, ahead of Las Vegas and Birmingham at 0.48%. Conversely, the highest rates are in Buffalo, N.Y. (2.00%), Chicago (1.98%) and Cleveland (1.67%).
Property taxes cost homeowners a median of $3,100+ a year
Owning a home has never been cheap, and property taxes are a big reason why. Homeowners pay a median of $3,119 annually in property taxes — or $260 a month — as of 2024, according to our analysis.
Overall, property taxes increased 5.1% — or $150 — from 2023 to 2024.
That figure reflects a years-long upward trend. The last time we conducted this study, we found that property taxes rose 10.4% between 2021 and 2023. And between 2019 and 2024, property taxes nationwide increased by 30%, according to the Institute on Taxation and Economic Policy (ITEP) — a direct consequence of the pandemic-era housing boom, which sent assessed home values soaring across much of the country.
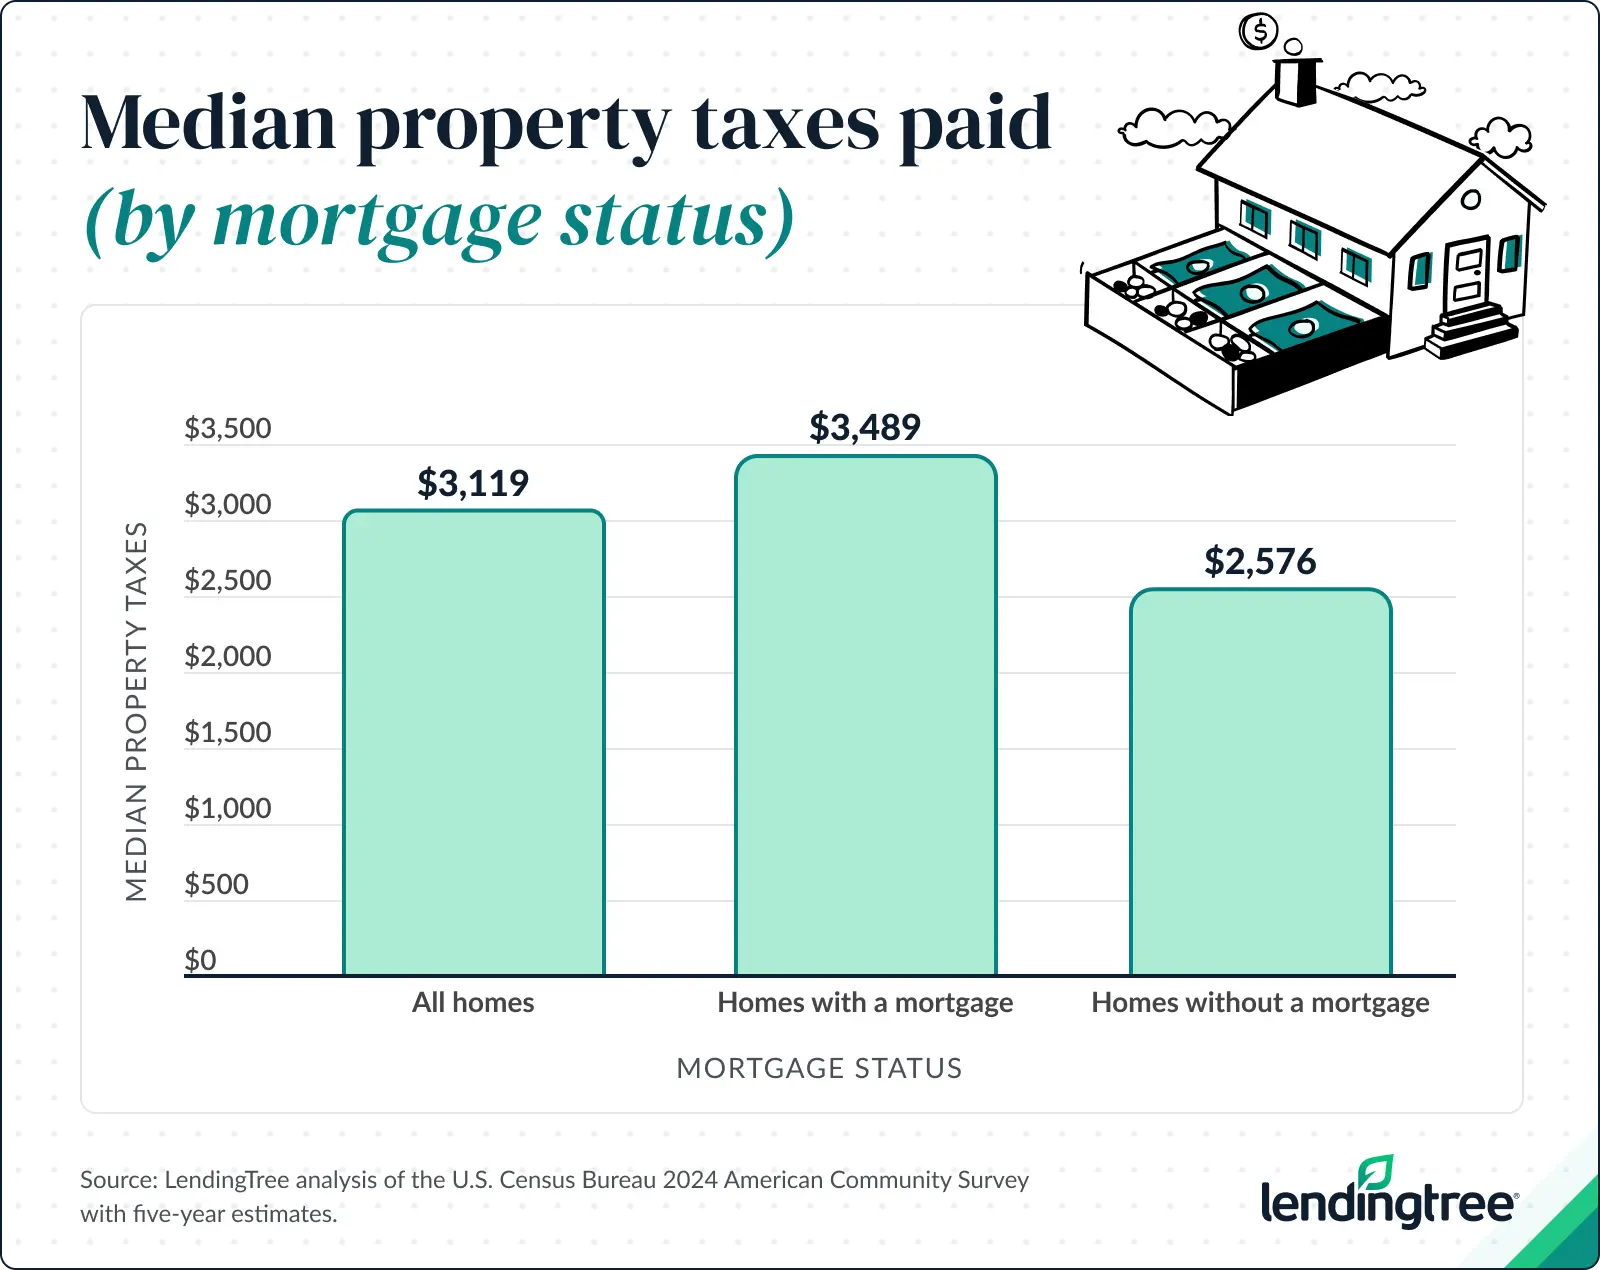
The tax burden isn’t distributed evenly, though. Homeowners carrying a mortgage pay $913 more per year than those who own their homes outright — $3,489 versus $2,576.
Matt Schulz, LendingTree chief consumer finance analyst and author of “Ask Questions, Save Money, Make More: How to Take Control of Your Financial Life,” says that difference is a big deal for first-time homebuyers.
“When considering the costs of homeownership, too many people take too narrow a view,” he says. “They think about the home price, interest rates and closing costs, but they don’t always consider other recurring costs over the long run, including property taxes, homeowners association (HOA) fees and insurance. If you’re not considering all these costs and more when thinking about how much house you can afford, you’re doing yourself a disservice. These costs matter, and you ignore them at your peril.”
Part of the property tax gap between those with a mortgage and those without one may come down to where these two groups typically sit on the housing ladder. Mortgaged homeowners are more often recent buyers who purchased at elevated prices and carry higher assessed values as a result.
There could be a structural factor, too. Most mortgage lenders require an escrow account, through which a portion of the monthly mortgage payment is set aside to cover property taxes. If the tax bill increases, the escrow portion adjusts upward to cover the difference. This setup can make the obligation more visible and more immediately felt than it might be for a homeowner who pays taxes on their own schedule.
The difference in property tax payments tends to play out more sharply at the lower end of the tax spectrum. Households without a mortgage are 2.4 times more likely to pay less than $800 in property taxes than those with one. Across the metros measured, 17.7% of mortgage-free households fall into that bracket, compared with just 7.5% of mortgage holders.
On the other end, more than half (56.1%) of mortgaged households paid $3,000 or more in property taxes in 2024, compared with 43.8% of those without a mortgage.
Property taxes rise in every major metro
No matter where homeowners live, property taxes are heading in one direction: upward. Property taxes increased in every one of the 50 largest U.S. metros between 2023 and 2024.
As for the hardest hit metros, Tampa, Fla., ranks first, with property taxes rising 7.7%. Denver (7.4%) and Miami (7.1%) follow.
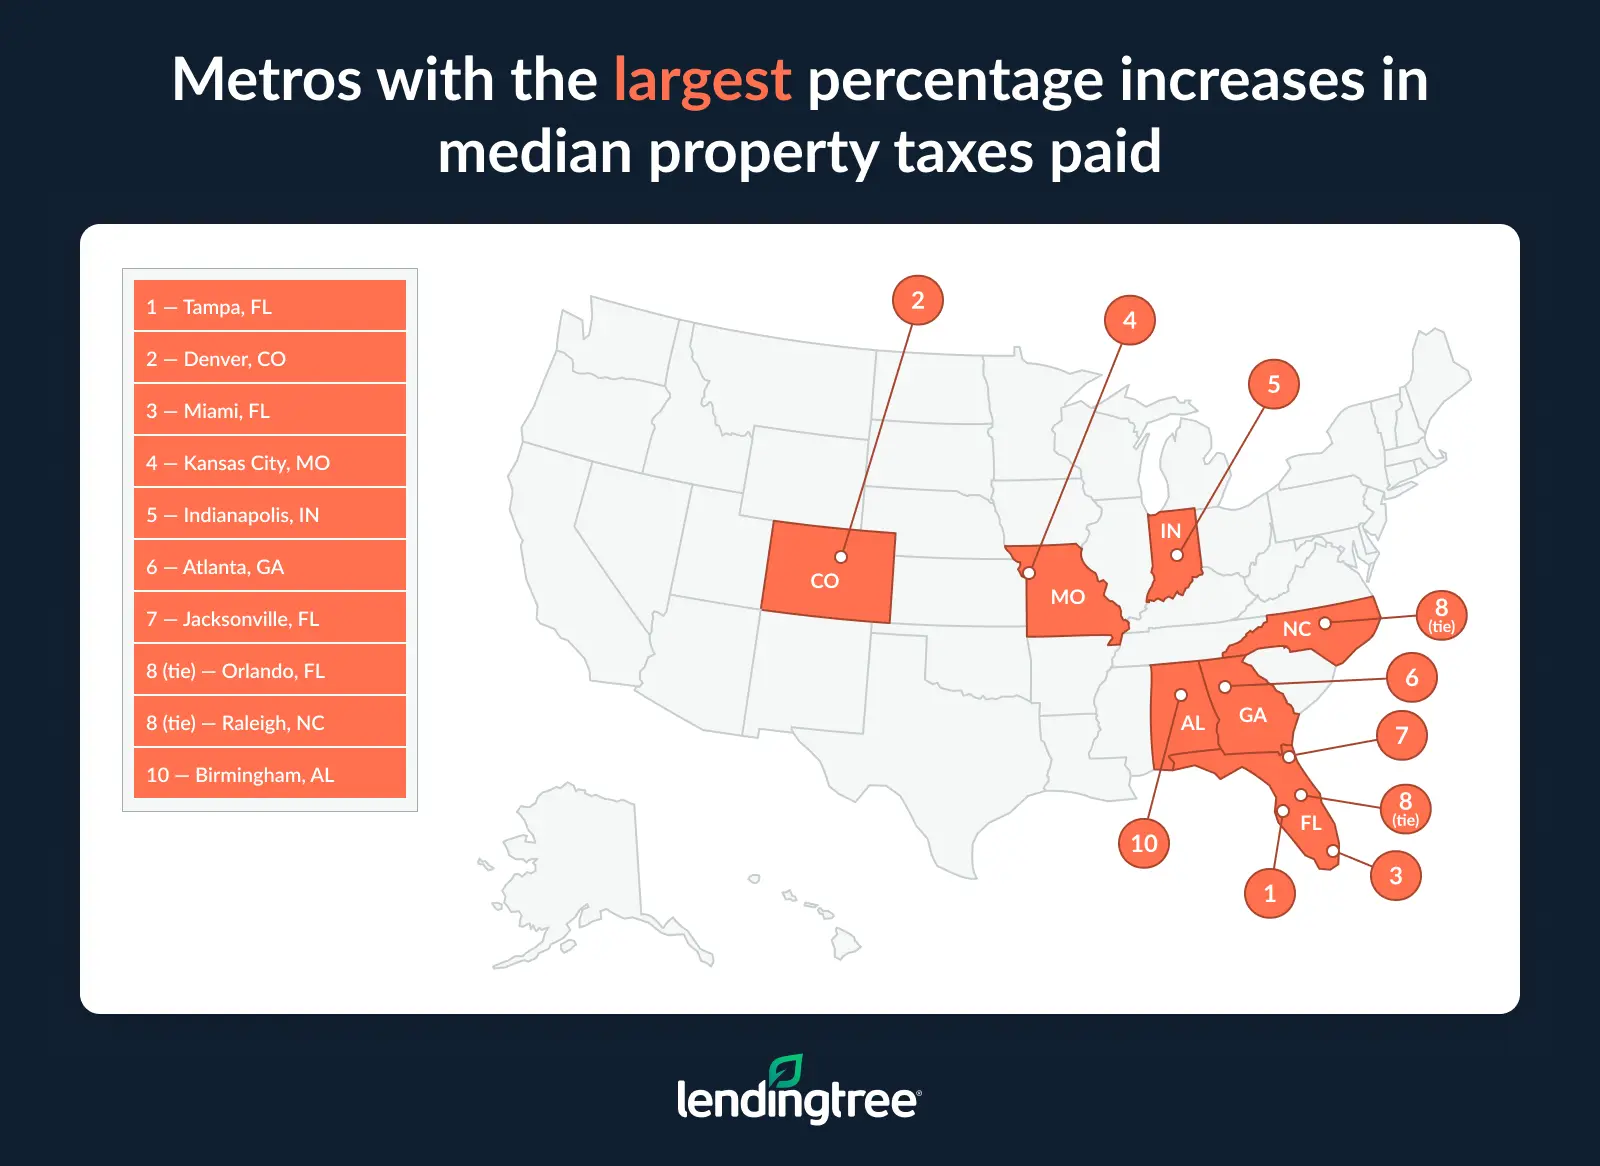
Notably, Florida relies on property taxes to supplement its lack of income taxes, which may explain Tampa’s ranking here.
While lower property tax bills may feel like a good thing, Schulz says there could be trade-offs. “For one, the typical property tax bill could be lower because home prices in the area are lower or stagnant, making it harder for homeowners to build equity,” he says. “Also, in many areas, schools rely on property taxes heavily, so lower taxes could mean lower-quality schools. In addition, sales taxes or income taxes could be higher in some places to make up for lower property taxes.”
On the other end of the spectrum, Milwaukee (0.7%), Phoenix (1.0%) and Memphis, Tenn. (1.1%), saw the smallest increases in property taxes.
Note: New York is included in our analysis but excluded from our rankings because median property taxes here exceeded $10,000 in 2024. Data is capped at $10,000-plus in the American Community Survey (ACS) and can’t be precisely ranked.
Full rankings: Metros with the largest/smallest percentage increases in median property taxes paid
| Rank | Metro | Median property taxes paid, 2024 | Median property taxes paid, 2023 | % change |
|---|---|---|---|---|
| 1 | Tampa, FL | $2,569 | $2,385 | 7.7% |
| 2 | Denver, CO | $3,086 | $2,873 | 7.4% |
| 3 | Miami, FL | $3,823 | $3,570 | 7.1% |
| 4 | Kansas City, MO | $3,126 | $2,921 | 7.0% |
| 5 | Indianapolis, IN | $2,168 | $2,029 | 6.9% |
| 6 | Atlanta, GA | $2,920 | $2,738 | 6.6% |
| 7 | Jacksonville, FL | $2,549 | $2,401 | 6.2% |
| 8 | Orlando, FL | $2,749 | $2,592 | 6.1% |
| 8 | Raleigh, NC | $2,878 | $2,712 | 6.1% |
| 10 | Birmingham, AL | $1,156 | $1,091 | 6.0% |
| 11 | Fresno, CA | $2,844 | $2,685 | 5.9% |
| 12 | Charlotte, NC | $2,331 | $2,205 | 5.7% |
| 13 | Cincinnati, OH | $3,053 | $2,901 | 5.2% |
| 14 | Oklahoma City, OK | $2,157 | $2,053 | 5.1% |
| 14 | Richmond, VA | $2,532 | $2,410 | 5.1% |
| 14 | Grand Rapids, MI | $3,047 | $2,898 | 5.1% |
| 17 | Virginia Beach, VA | $2,773 | $2,652 | 4.6% |
| 18 | Seattle, WA | $6,092 | $5,832 | 4.5% |
| 18 | San Francisco, CA | $8,522 | $8,156 | 4.5% |
| 20 | Nashville, TN | $2,060 | $1,976 | 4.3% |
| 20 | Riverside, CA | $3,945 | $3,784 | 4.3% |
| 22 | Sacramento, CA | $4,432 | $4,254 | 4.2% |
| 22 | San Diego, CA | $5,774 | $5,542 | 4.2% |
| 24 | Louisville, KY | $1,991 | $1,912 | 4.1% |
| 24 | Salt Lake City, UT | $2,813 | $2,701 | 4.1% |
| 24 | Los Angeles, CA | $5,854 | $5,621 | 4.1% |
| 27 | St. Louis, MO | $2,939 | $2,828 | 3.9% |
| 28 | Detroit, MI | $3,417 | $3,292 | 3.8% |
| 29 | Minneapolis, MN | $3,974 | $3,833 | 3.7% |
| 29 | Columbus, OH | $3,976 | $3,835 | 3.7% |
| 31 | San Jose, CA | $9,901 | $9,554 | 3.6% |
| 32 | Las Vegas, NV | $2,057 | $1,990 | 3.4% |
| 33 | Washington, DC | $5,251 | $5,082 | 3.3% |
| 34 | Boston, MA | $6,883 | $6,696 | 2.8% |
| 35 | Portland, OR | $4,765 | $4,643 | 2.6% |
| 35 | Dallas, TX | $5,737 | $5,589 | 2.6% |
| 37 | Cleveland, OH | $3,590 | $3,507 | 2.4% |
| 37 | Austin, TX | $7,140 | $6,973 | 2.4% |
| 39 | Baltimore, MD | $3,922 | $3,833 | 2.3% |
| 39 | San Antonio, TX | $4,432 | $4,331 | 2.3% |
| 41 | Buffalo, NY | $4,528 | $4,432 | 2.2% |
| 41 | Chicago, IL | $6,401 | $6,266 | 2.2% |
| 43 | Houston, TX | $4,810 | $4,713 | 2.1% |
| 44 | Pittsburgh, PA | $2,827 | $2,776 | 1.8% |
| 45 | Providence, RI | $4,867 | $4,793 | 1.5% |
| 45 | Philadelphia, PA | $5,066 | $4,993 | 1.5% |
| 47 | Memphis, TN | $1,877 | $1,856 | 1.1% |
| 48 | Phoenix, AZ | $1,947 | $1,927 | 1.0% |
| 49 | Milwaukee, WI | $4,420 | $4,390 | 0.7% |
These metros have the most — and least — affordable property tax bills
Among the 50 largest metros, Birmingham, Ala., has the lowest median property taxes at $1,156, with Memphis and Phoenix following at $1,877 and $1,947, respectively.
Low bills in these markets tend to reflect a combination of more modest home values, lower local government spending needs and, in some cases, state-level policies that limit how much assessments can rise year to year.
At the other end of the spectrum, New York homeowners face a median property tax bill that exceeds $10,000 annually — the highest of any major metro. San Jose ($9,901) and San Francisco ($8,522) follow.
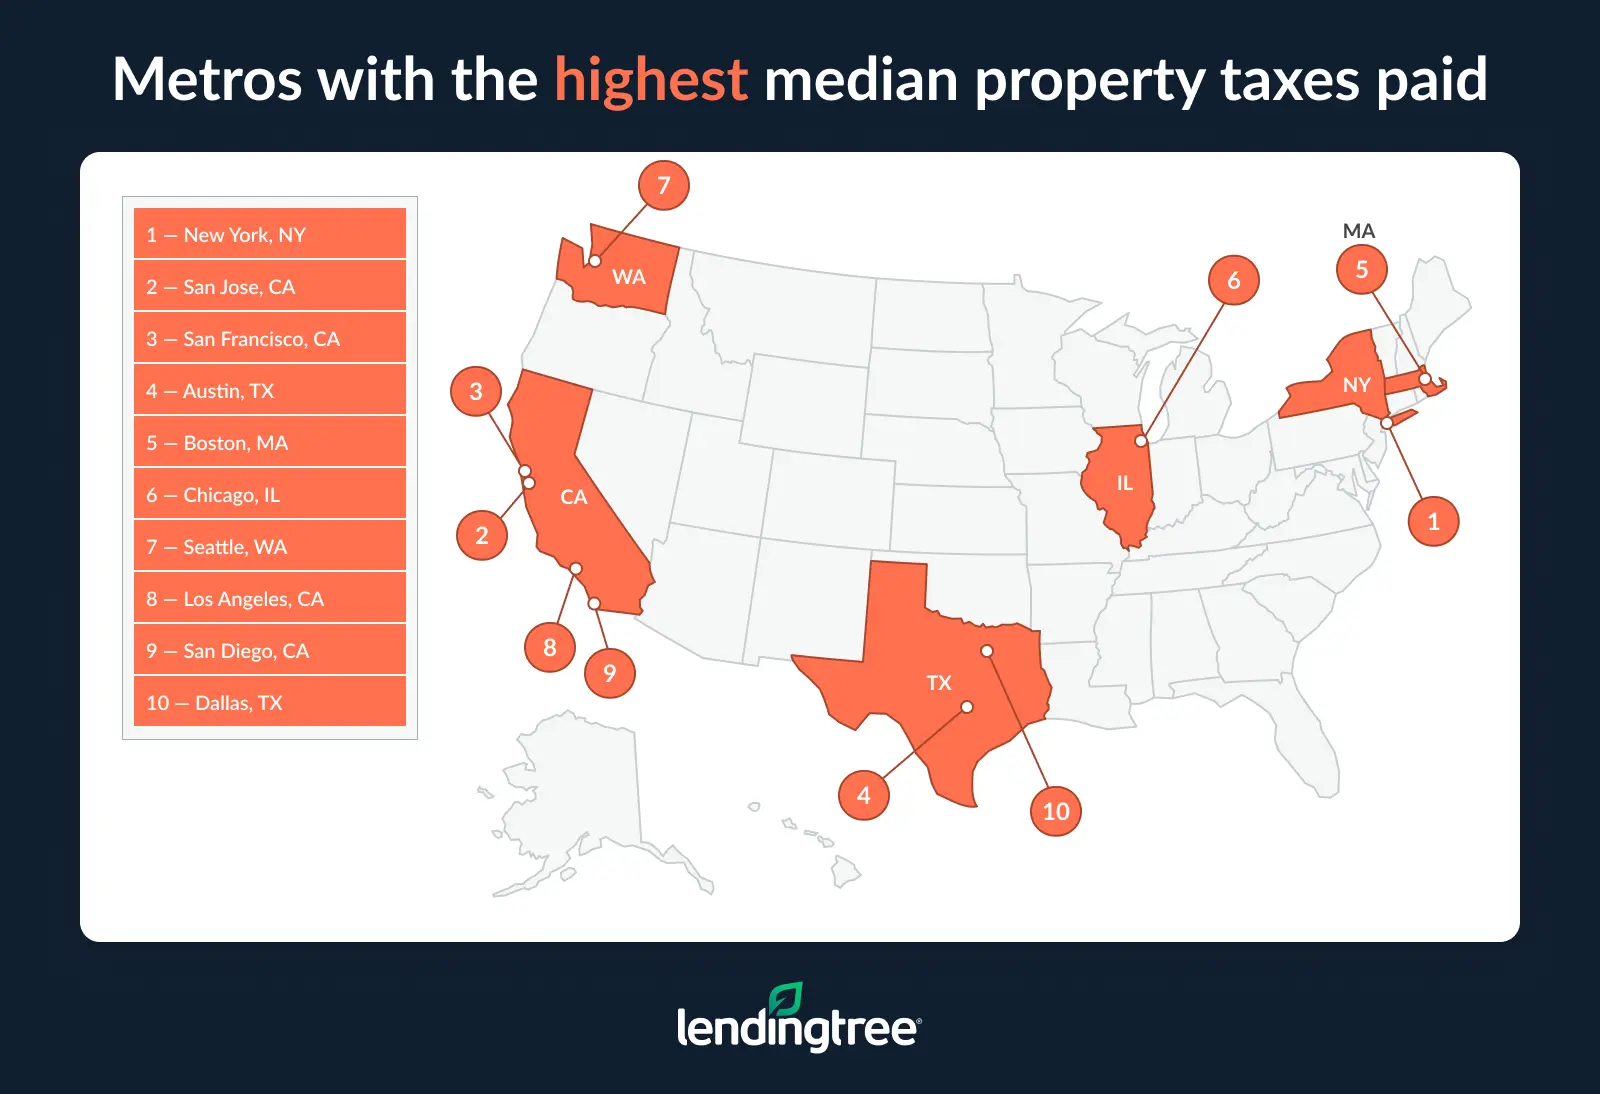
Among the 10 metros with the highest property taxes, four are in California and two are in Texas — seemingly contradictory given the two states’ contrasting political and fiscal identities.
While Schulz says high home values play a role here, it isn’t everything. “The property tax rates are a major factor as well,” he says. “For example, homes in Austin and Dallas aren’t nearly as expensive as homes in the biggest coastal cities, but they have property tax rates that can be double or more what you’d find in those cities. As a longtime homeowner in Austin, I can tell you first-hand that the property tax burden here is no joke.”
Because home values in California are generally higher, homeowners can pay more in raw dollars even when the rate is lower. In Texas, however, it’s the rate itself that drives the burden. Texas reassesses property values annually based on current market data, with no equivalent to California’s Proposition 13 to prevent large year-over-year increases — meaning faster-growing areas like Austin and Dallas have seen tax bills climb significantly without any changes to the property itself.
Finally, while mortgaged homeowners generally face higher property tax bills than those who own their homes free and clear, there are a handful of exceptions. While homeowners with mortgages typically pay higher property taxes in nearly all metros, that’s not the case in Seattle, Salt Lake City, Boston, Washington, D.C., and Virginia Beach, where mortgage-free homeowners carry a comparatively heavier tax load.
Full rankings: Metros with the lowest/highest median property taxes
| Rank | Metro | Median property taxes paid, all homes | Median property taxes paid, homes with a mortgage | Median property taxes paid, homes without a mortgage |
|---|---|---|---|---|
| 1 | Birmingham, AL | $1,156 | $1,285 | $897 |
| 2 | Memphis, TN | $1,877 | $2,025 | $1,550 |
| 3 | Phoenix, AZ | $1,947 | $1,996 | $1,827 |
| 4 | Louisville, KY | $1,991 | $2,093 | $1,845 |
| 5 | Las Vegas, NV | $2,057 | $2,108 | $1,953 |
| 6 | Nashville, TN | $2,060 | $2,100 | $1,983 |
| 7 | Oklahoma City, OK | $2,157 | $2,402 | $1,748 |
| 8 | Indianapolis, IN | $2,168 | $2,258 | $1,960 |
| 9 | Charlotte, NC | $2,331 | $2,505 | $1,877 |
| 10 | Richmond, VA | $2,532 | $2,536 | $2,523 |
| 11 | Jacksonville, FL | $2,549 | $2,732 | $2,125 |
| 12 | Tampa, FL | $2,569 | $2,963 | $1,927 |
| 13 | Orlando, FL | $2,749 | $2,952 | $2,290 |
| 14 | Virginia Beach, VA | $2,773 | $2,765 | $2,794 |
| 15 | Salt Lake City, UT | $2,813 | $2,782 | $2,895 |
| 16 | Pittsburgh, PA | $2,827 | $3,142 | $2,452 |
| 17 | Fresno, CA | $2,844 | $3,107 | $2,321 |
| 18 | Raleigh, NC | $2,878 | $2,937 | $2,694 |
| 19 | Atlanta, GA | $2,920 | $3,191 | $2,223 |
| 20 | St. Louis, MO | $2,939 | $3,064 | $2,734 |
| 21 | Grand Rapids, MI | $3,047 | $3,170 | $2,881 |
| 22 | Cincinnati, OH | $3,053 | $3,231 | $2,769 |
| 23 | Denver, CO | $3,086 | $3,161 | $2,908 |
| 24 | Kansas City, MO | $3,126 | $3,290 | $2,839 |
| 25 | Detroit, MI | $3,417 | $3,719 | $2,938 |
| 26 | Cleveland, OH | $3,590 | $3,751 | $3,318 |
| 27 | Miami, FL | $3,823 | $4,229 | $3,226 |
| 28 | Baltimore, MD | $3,922 | $3,999 | $3,748 |
| 29 | Riverside, CA | $3,945 | $4,354 | $2,943 |
| 30 | Minneapolis, MN | $3,974 | $4,000 | $3,916 |
| 31 | Columbus, OH | $3,976 | $4,132 | $3,633 |
| 32 | Milwaukee, WI | $4,420 | $4,495 | $4,273 |
| 33 | Sacramento, CA | $4,432 | $4,760 | $3,580 |
| 33 | San Antonio, TX | $4,432 | $5,193 | $3,145 |
| 35 | Buffalo, NY | $4,528 | $4,833 | $4,088 |
| 36 | Portland, OR | $4,765 | $4,767 | $4,758 |
| 37 | Houston, TX | $4,810 | $5,703 | $3,596 |
| 38 | Providence, RI | $4,867 | $4,916 | $4,774 |
| 39 | Philadelphia, PA | $5,066 | $5,307 | $4,615 |
| 40 | Washington, DC | $5,251 | $5,251 | $5,254 |
| 41 | Dallas, TX | $5,737 | $6,459 | $4,225 |
| 42 | San Diego, CA | $5,774 | $6,375 | $4,129 |
| 43 | Los Angeles, CA | $5,854 | $6,540 | $4,290 |
| 44 | Seattle, WA | $6,092 | $6,066 | $6,160 |
| 45 | Chicago, IL | $6,401 | $6,698 | $5,827 |
| 46 | Boston, MA | $6,883 | $6,866 | $6,920 |
| 47 | Austin, TX | $7,140 | $7,600 | $6,072 |
| 48 | San Francisco, CA | $8,522 | $9,680 | $5,970 |
| 49 | San Jose, CA | $9,901 | 10,000+ | $6,554 |
| 50 | New York, NY | 10,000+ | 10,000+ | $9,650 |
Phoenix and Las Vegas homeowners get the most bang for their buck
A high property tax bill isn’t the only thing that matters. The effective tax rate, which measures property taxes as a percentage of a home’s value, is also important because it offers a standardized way to compare tax burdens across markets with very different home prices.
Across the metros analyzed, Phoenix has the lowest effective tax rate. While the median home value was $440,900, homeowners paid a median of $1,947 in taxes — a rate of just 0.44%. Las Vegas and Birmingham tie for second, at 0.48%. The median property value in Las Vegas was $431,000, with homeowners paying a median of $2,057 in taxes. In Birmingham, those figures were $240,200 and $1,156, respectively.
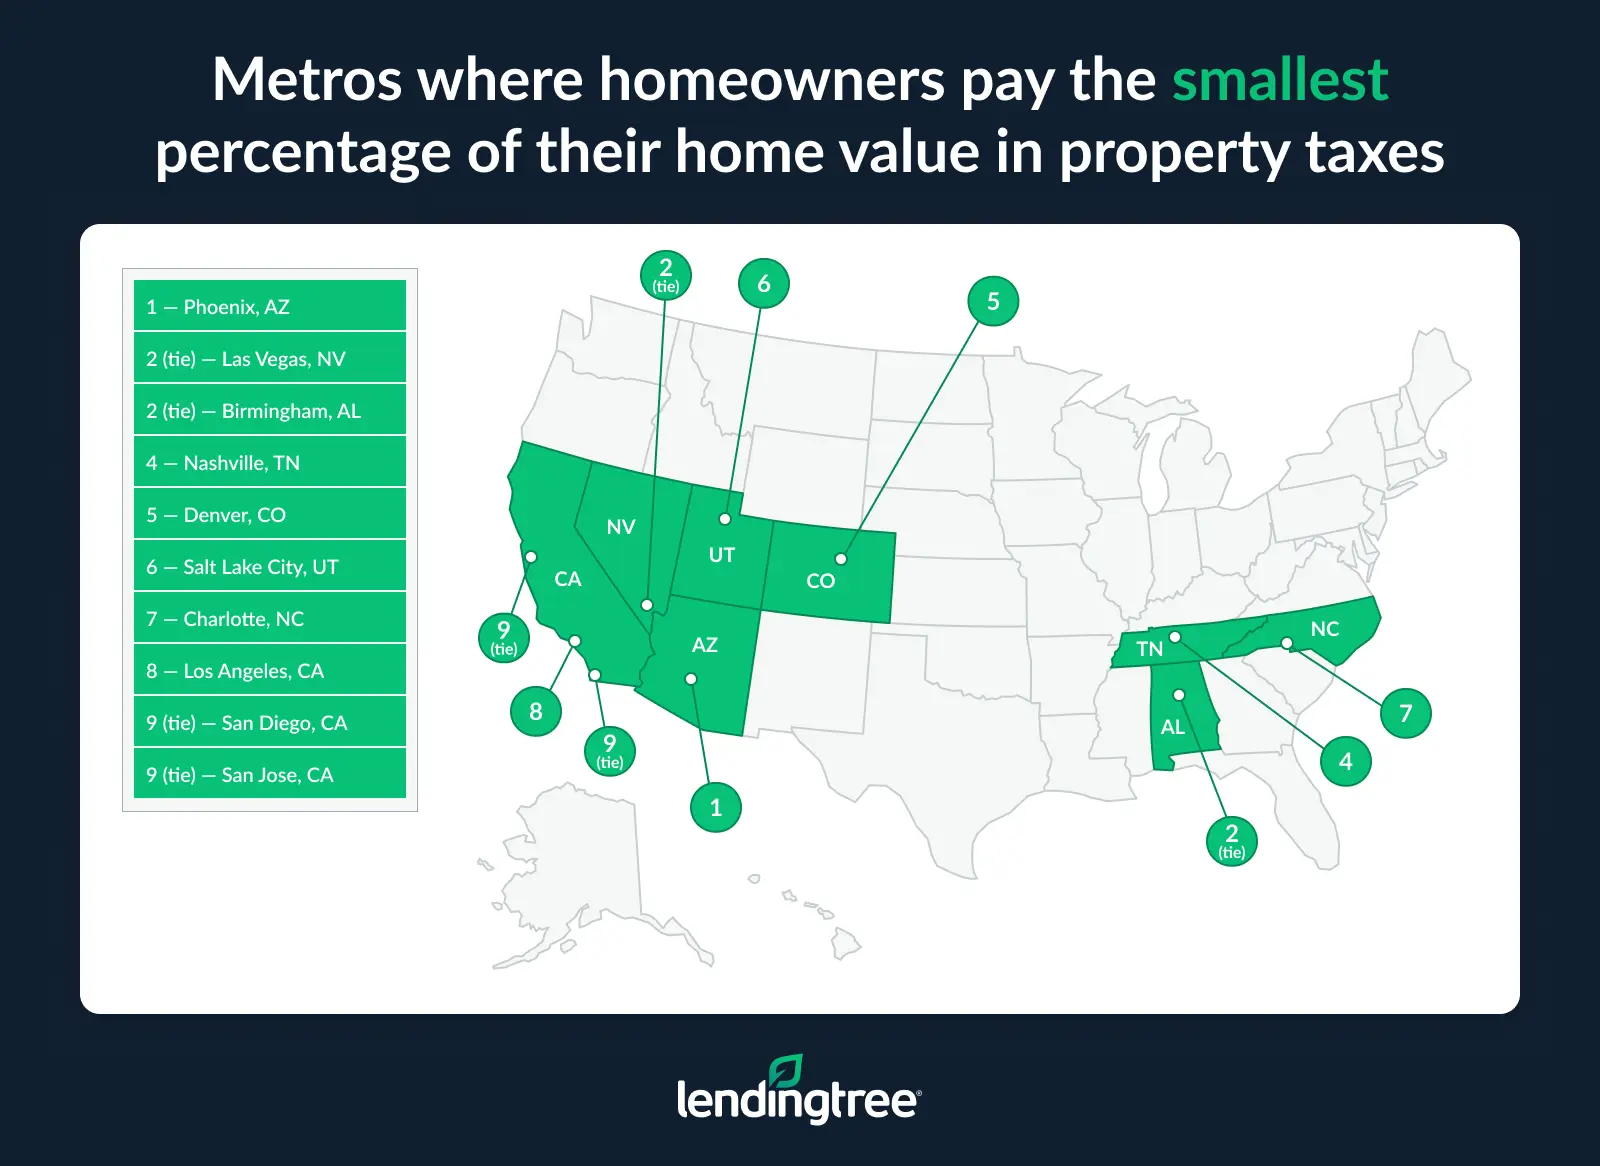
Meanwhile, Buffalo, N.Y. (2.00%), had the highest effective rate, with a median property value of $226,100 and a median property tax bill of $4,528. That’s followed by Chicago (1.98%) and Cleveland (1.67%).
Once again, New York was included in our analysis but couldn’t be included in our rankings because the median property tax bill exceeded $10,000.
Full rankings: Metros where homeowners paid the lowest/highest percentage of their home value in property taxes
| Rank | Metro | Median home value | Median property taxes paid | Effective tax rate |
|---|---|---|---|---|
| 1 | Phoenix, AZ | $440,900 | $1,947 | 0.44% |
| 2 | Las Vegas, NV | $431,000 | $2,057 | 0.48% |
| 2 | Birmingham, AL | $240,200 | $1,156 | 0.48% |
| 4 | Nashville, TN | $409,600 | $2,060 | 0.50% |
| 5 | Denver, CO | $603,800 | $3,086 | 0.51% |
| 6 | Salt Lake City, UT | $515,400 | $2,813 | 0.55% |
| 7 | Charlotte, NC | $356,400 | $2,331 | 0.65% |
| 8 | Los Angeles, CA | $871,300 | $5,854 | 0.67% |
| 9 | San Diego, CA | $854,700 | $5,774 | 0.68% |
| 9 | San Jose, CA | $1,447,800 | $9,901 | 0.68% |
| 11 | Raleigh, NC | $418,400 | $2,878 | 0.69% |
| 12 | Richmond, VA | $353,500 | $2,532 | 0.72% |
| 13 | Fresno, CA | $389,400 | $2,844 | 0.73% |
| 14 | Riverside, CA | $536,300 | $3,945 | 0.74% |
| 14 | Jacksonville, FL | $343,400 | $2,549 | 0.74% |
| 14 | Orlando, FL | $369,800 | $2,749 | 0.74% |
| 14 | Tampa, FL | $345,100 | $2,569 | 0.74% |
| 18 | San Francisco, CA | $1,140,700 | $8,522 | 0.75% |
| 18 | Sacramento, CA | $589,500 | $4,432 | 0.75% |
| 20 | Memphis, TN | $245,900 | $1,877 | 0.76% |
| 21 | Atlanta, GA | $367,600 | $2,920 | 0.79% |
| 22 | Louisville, KY | $248,700 | $1,991 | 0.80% |
| 23 | Virginia Beach, VA | $340,900 | $2,773 | 0.81% |
| 24 | Indianapolis, IN | $265,900 | $2,168 | 0.82% |
| 25 | Seattle, WA | $717,500 | $6,092 | 0.85% |
| 25 | Portland, OR | $559,400 | $4,765 | 0.85% |
| 27 | Miami, FL | $443,300 | $3,823 | 0.86% |
| 28 | Washington, DC | $579,900 | $5,251 | 0.91% |
| 29 | Oklahoma City, OK | $230,000 | $2,157 | 0.94% |
| 30 | Baltimore, MD | $391,300 | $3,922 | 1.00% |
| 31 | Minneapolis, MN | $374,000 | $3,974 | 1.06% |
| 31 | Boston, MA | $646,300 | $6,883 | 1.06% |
| 33 | Grand Rapids, MI | $285,300 | $3,047 | 1.07% |
| 34 | Kansas City, MO | $287,300 | $3,126 | 1.09% |
| 35 | Providence, RI | $422,500 | $4,867 | 1.15% |
| 36 | Cincinnati, OH | $258,600 | $3,053 | 1.18% |
| 37 | St. Louis, MO | $244,800 | $2,939 | 1.20% |
| 38 | Pittsburgh, PA | $215,000 | $2,827 | 1.31% |
| 39 | Columbus, OH | $300,800 | $3,976 | 1.32% |
| 40 | Detroit, MI | $249,700 | $3,417 | 1.37% |
| 41 | Philadelphia, PA | $351,900 | $5,066 | 1.44% |
| 41 | Milwaukee, WI | $306,400 | $4,420 | 1.44% |
| 43 | Austin, TX | $465,000 | $7,140 | 1.54% |
| 44 | San Antonio, TX | $278,800 | $4,432 | 1.59% |
| 45 | Dallas, TX | $359,500 | $5,737 | 1.60% |
| 46 | Houston, TX | $298,000 | $4,810 | 1.61% |
| 47 | Cleveland, OH | $215,400 | $3,590 | 1.67% |
| 48 | Chicago, IL | $323,000 | $6,401 | 1.98% |
| 49 | Buffalo, NY | $226,100 | $4,528 | 2.00% |
Weighing tax rates alongside home prices: Top expert tips
When comparing where to buy a home, it’s easy to fixate on sticker price alone. However, taxes can significantly shape your true monthly cost. We offer the following advice for homebuyers:
- Look beyond the listing price. A lower-priced home in a high-tax area can cost more over time than a higher-priced home with lower taxes. Use a mortgage calculator to compare total monthly payments across locations.
- Compare after-tax affordability. State income taxes and local tax burdens affect how much home you can realistically afford. Reviewing mortgage options and prequalifying can help you align your budget with real take-home pay.
- Watch for tax advantages and deductions. Mortgage interest and property tax deductions may offset some costs, depending on your situation. Understanding how these benefits apply can make a higher-tax area more manageable.
- Think long term, not just upfront. Taxes can rise, but so can home values. Evaluate whether higher taxes come with benefits, like better schools or infrastructure, that may support appreciation and quality of life over time.
Methodology
LendingTree researchers analyzed the U.S. Census Bureau 2024 American Community Survey with five-year estimates (the latest available) to determine the median real estate tax paid for homes in the 50 largest U.S. metros.
Additionally, analysts calculated the estimated effective tax rate by dividing the median property taxes paid by the median value of owner-occupied housing units.
The Census Bureau uses the term “real estate tax” to define a tax charged on an “entire property (land and buildings) payable to all taxing jurisdictions, including special assessments, school taxes, county taxes and so forth.”
Real estate taxes are often referred to as property taxes. The terms are used interchangeably in this study.
View mortgage loan offers from up to 5 lenders in minutes