LendingTree Analysis Reveals Mortgage Denials at Cycle Low

Ten years after the financial crisis, the housing and mortgage markets are far healthier. As talk builds of a possible recession on the horizon, housing is not likely to be the cause or suffer significantly in a potential downturn. One measure of how the housing market has changed is recently released Home Mortgage Disclosure Act (HMDA) data showing purchase mortgage denials at the lowest level since the financial crisis — and the lowest since at least 2004. The rate is the percentage of mortgage applications that are not approved.
A mortgage denial can be a devastating experience, depriving potential homeowners of one of the pillars of the American dream. Understanding the frequency and drivers of mortgage application denials helps prospective homeowners better prepare for the homebuying journey. Our study does just that, and we suggest measures that borrowers can take to avoid being denied a mortgage.
In this analysis, LendingTree delved into data from more than 10 million mortgage applications using the most recent available HMDA data for 2018 to find out the main reasons would-be borrowers were rejected.
“Most reasons for denial are financial, but some are not borrower-specific, such as concerns about the collateral,” said LendingTree chief mortgage economist Tendayi Kapfidze, who led the study.
“The low denial rate is encouraging, though some of this is because the financial profile of mortgage applicants has improved. The key for homebuyers is to be well-educated on the homebuying and mortgage process,” said Kapfidze. “Understanding the key reasons mortgages are denied can help borrowers avoid missteps and compete effectively to secure their dream home.”
Key findings
- Nearly 1 in 10 borrowers get denied for mortgages. On a national level, 9.8% of loan applications were denied.
- Debt and credit history are the biggest barriers. The leading reasons for denial were debt-to-income at 33% and credit history (which includes credit score) at 23% of denied loans. This was a change from 2017 when these factors were virtually tied, and may reflect the effect of higher home prices and interest rates on the DTI ratio in 2018.
- Inspections and appraisals still matter. Collateral was the third-highest denial reason at 17%. Despite the increased use of big data driven automated underwriting and valuation, it still matters to get a physical look at the property.
- Good professional help is important. Incomplete applications were fourth at 13% and unverifiable information was sixth at 8%. There is no excuse for these denial reasons. This highlights the importance of borrower education and working with reputable, experienced mortgage industry participants who put the borrower first.
- Florida cities took the top spots. Miami, Orlando, Tampa and Jacksonville were ranked No. 1-4 by denial rates. They all had debt-to-income as a leading cause, but Miami and Tampa had disproportionately high rates of collateral as a denial reason.
- There are discrepancies by race and ethnicity. African-American borrowers have the highest denial rates at 17.4%, and Non-Hispanic whites have the lowest at 7.9%.
| | Debt-to-income ratio | Credit history | Collateral | Credit application incomplete | Insufficient cash | Unverifiable information | Employment history | Mortgage insurance denied | Other |
|---|---|---|---|---|---|---|---|---|---|
| All applicants | 32.6 | 23.1 | 16.9 | 13 | 9.9 | 8.4 | 5.1 | 0.4 | 12.4 |
| Asian | 39.8 | 12.6 | 13.6 | 15.6 | 11.5 | 13 | 6.1 | 0.3 | 12.7 |
| Black or African-American | 35.6 | 30.4 | 13.8 | 10.1 | 10.5 | 7.5 | 4.7 | 0.5 | 12.6 |
| Hispanic white | 35.9 | 21.5 | 17 | 10.4 | 10.5 | 10.6 | 5.7 | 0.5 | 14 |
| Non-Hispanic white | 30.4 | 23 | 18.3 | 13.1 | 9.5 | 7.5 | 5.1 | 0.5 | 12.2 |
| Other minority | 34.5 | 28.9 | 14.6 | 11 | 10.8 | 8 | 5.3 | 0.5 | 13.4 |
We parsed out the data geographically, looking at the top 50 metro areas, and found a wide range of results. In some cities, denial rates were as low as 5%, while in others denial rates were as high as 12%.
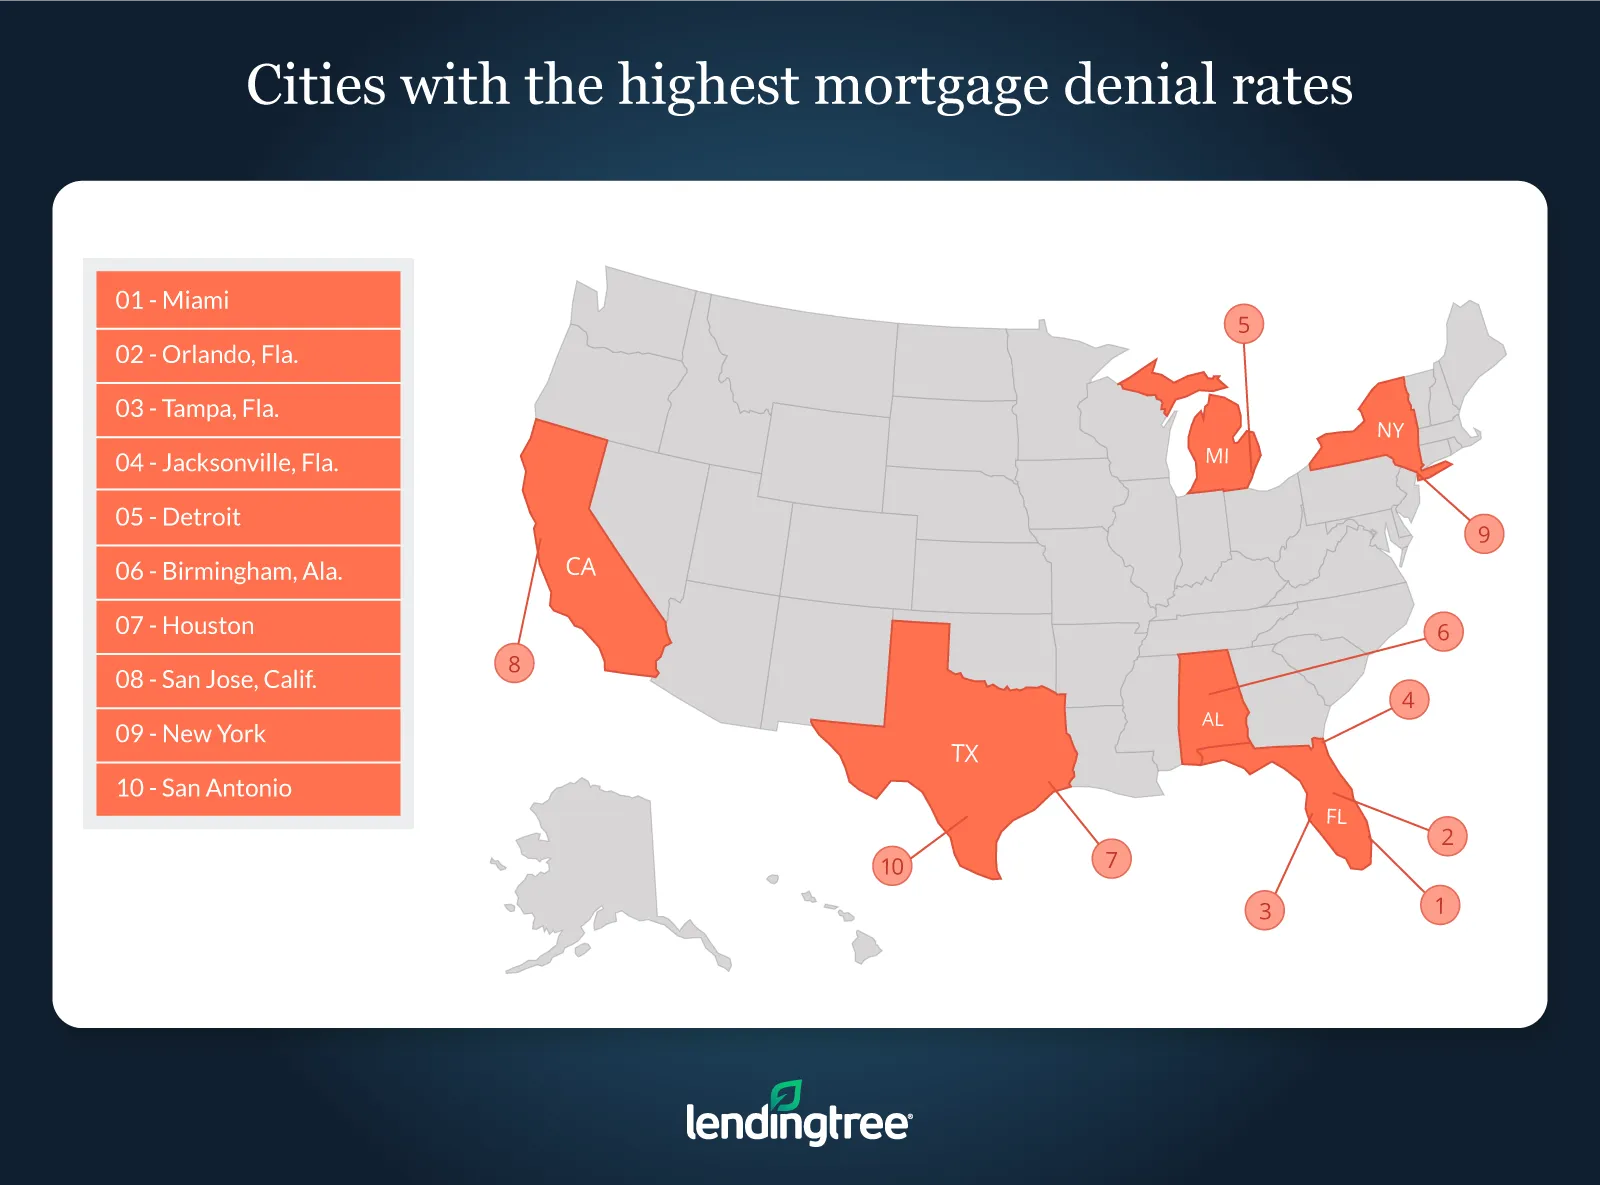
Metros where borrowers are most likely to get denied for a mortgage
Miami
- Denial rate: 11.6%
- Leading cause of denials: The leading cause of rejection in Miami is debt-to-income, which was cited in 32.4% of failed loan applications. Collateral was next at 22.7%.
Orlando, Fla.
- Denial rate: 10.9%
- Leading cause of denials: Debt-to-income at 36.5%, then credit history at 18.8%
Tampa, Fla.
- Denial rate: 9.5%
- Leading cause of denials: Debt-to-income at 33.1%, then collateral at 19.1%
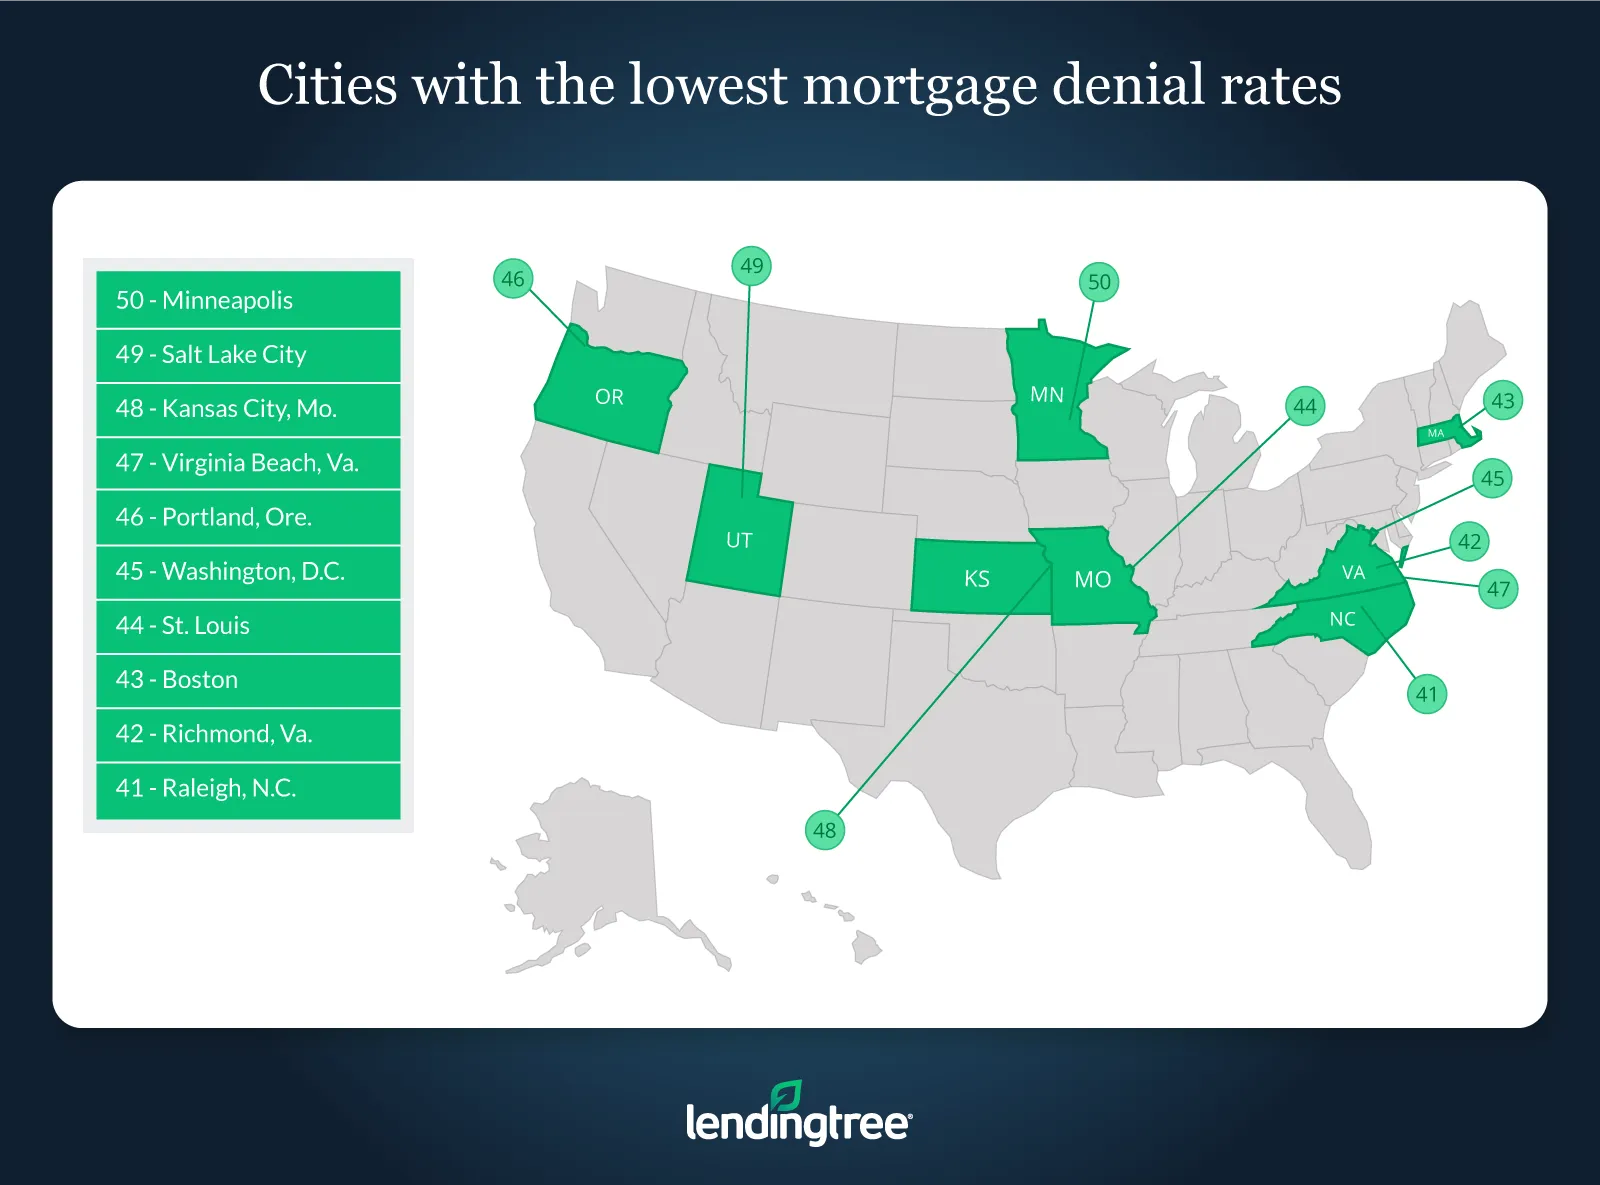
Metros where borrowers are least likely to get denied for a mortgage
Minneapolis
- Denial rate: 4.6%
- Leading cause of denials: Debt-to-income at 30.7%, then credit history at 21.0%
Salt Lake City
- Denial rate: 4.9%
- Leading cause of denials: Debt-to-income at 27.7%, then credit history at 18.0%
Kansas City, Mo.
- Denial rate: 4.9%
- Leading cause of denials: Debt-to-income at 26.7%, then credit history at 21.1%
Tips to get your mortgage application approved
- Credit history: Review your credit report and ensure it is accurate. Work to address any adverse records before applying for the loan.
- Debt-to-income ratio: Don’t reach for a loan that stretches your ability to pay. Shop for a lower-priced home if need be, perhaps in a different neighborhood, or a smaller house. Work to pay off debt prior to applying for a loan and keep your monthly expenses low.
- Collateral: Make sure you have a look at the property and have a trusted home inspector look it over. When markets are hot, some buyers bid on unseen homes. You can do this, but just know that if you’re using a lender, they are going to eventually do their own appraisal. If it comes in lower than your purchase price, you’re either going to get denied for the amount you want or you’re going to have to make up the difference in cash. Remember, if the lender does not accept the collateral, they likely just saved you from making a bad or overpriced purchase.
- Verifiable information: Make sure everything in your application, from your tax records to your employment history, is accurate and you have documentation. Be proactive and gather all the typical documentation you’ll need before you apply so you aren’t delayed in closing.
Methodology
LendingTree analyzed more than 10 million mortgage application records from the Federal Financial Institutions Examination Council’s Home Mortgage Disclosure Act 2018 data set, the most recent available. The data represents mortgage applications from over 5,000 financial institutions.
View mortgage loan offers from up to 5 lenders in minutes