LendingTree Reveals the Cities with the Biggest Houses in America

When people travel outside their hometowns, they often marvel at the differences in living space. Non-New Yorkers will often say, “I can’t believe you pay so much to live in a shoebox,” while city dwellers are awed by the expanse of real estate that many homeowners have in less densely populated areas.
LendingTree compared home sizes across the country, but first, let’s look at some national data. The Census Bureau reports that the median size of new homes completed in the second quarter was 2,412 square feet. Home sizes have leveled off the past few years from a peak of 2,488 square feet in the third quarter of 2015, though homes sizes are generally larger today than they were for previous generations. Because only a small proportion of the housing stock is new each year, the median size of all homes is lower given a median house age of 37 years.
To assess the median home size, we used LendingTree’s proprietary database of almost all homes in the United States. We calculated median home sizes for single-family homes. We also calculated the median value so that we could get a cost per square foot and reveal where homeowners get the most bang for their buck, at least in terms of living space. We show results for the 45 largest cities in the country.
Key findings
- Everything is bigger in Texas. Whoever coined this phrase must have been thinking about real estate. Houston leads the list, with Austin and Dallas also in the top five. Besides having a lot of space, Texas has been adding new residents at a steady pace, with the nation’s largest annual population growth between 2010 and 2016. More new homes means larger homes.
- South equals size. Other Southern cities dominate the top 10, with Atlanta, known for its sprawl, at No. 2.
- Money talks. The Washington, D.C., area, whose suburbs includes the three wealthiest counties in the country, comes in third. Boston, another wealthy city, shows up at ninth.
- Show me? The Midwest lives up to its unpretentious reputation by having the most cities with the smallest houses. Missouri’s Show Me State nickname clearly does not refer to houses, with its two largest cities both in the bottom 10.
- Older is smaller. Cities with older housing stock have smaller houses, including Detroit at No. 45 on our list.
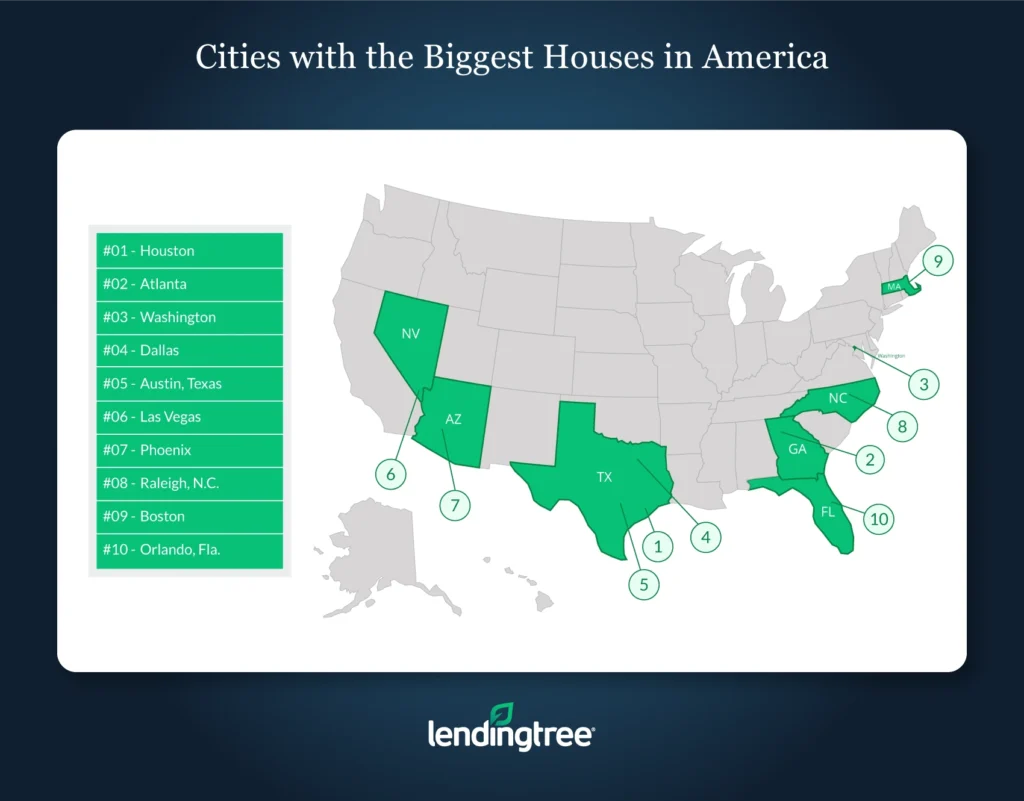
Cities with the biggest houses in America
No. 1: Houston
- Median size: 1,952 square feet
- Median value: $196,000
- Cost per square foot: $100
No. 2: Atlanta
- Median size: 1,914 square feet
- Median value: $196,000
- Cost per square foot: $102
No. 3: Washington
- Median size: 1,908 square feet
- Median value: $446,000
- Cost per square foot: $228
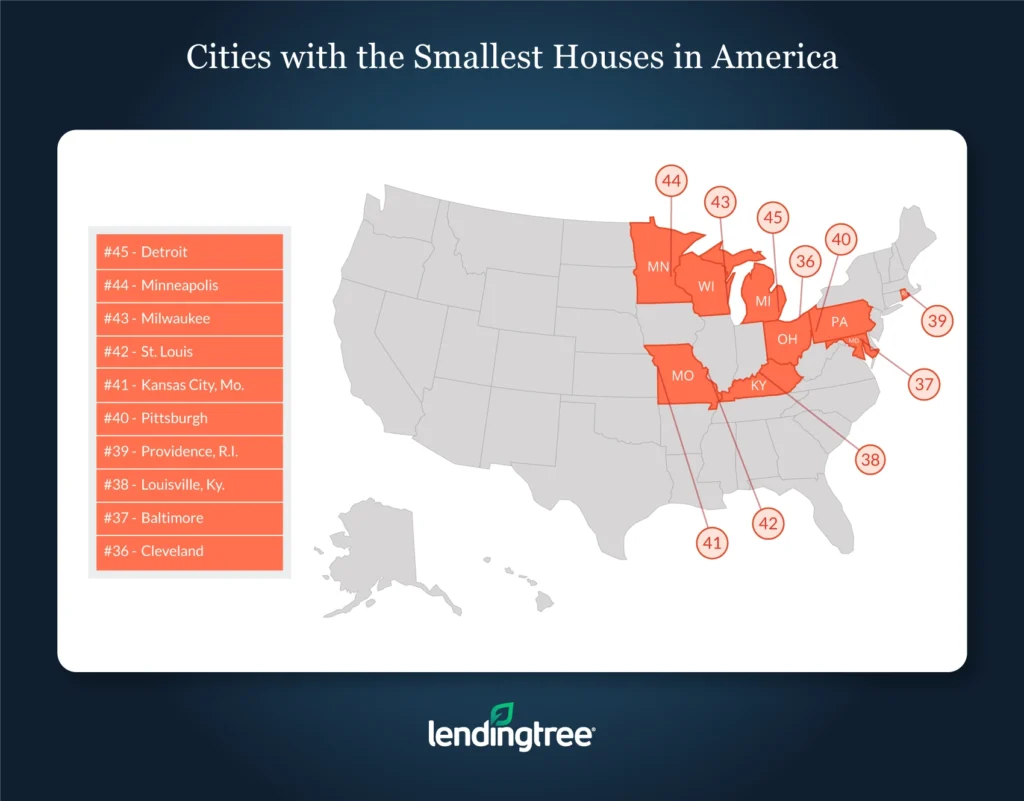
Cities with the smallest houses in America
No. 43: Milwaukee
- Median size: 1,388 square feet
- Median value: $175,000
- Cost per square foot: $130
No. 44: Minneapolis
- Median size: 1,360 square feet
- Median value: $273,000
- Cost per square foot: $200
No. 45: Detroit
- Median size: 1,333 square feet
- Median value: $140,000
- Cost per square foot: $108
Top 45 cities ranked by median single-family house size
Methodology
To determine the cities with the biggest houses, we looked at data pulled on Sept. 4, 2018, from the LendingTree property value database. The database includes estimated home values for more than 155 million properties in the U.S. based on public tax, deed, mortgage, and foreclosure data, as well as proprietary local data used to power home financing recommendations for My LendingTree users. The home size is the median livable area for each city as defined by the Core-Based Statistical Area (CBSA).
View mortgage loan offers from up to 5 lenders in minutes
Read more
How to Downsize Your Home: 13 Tips to Declutter and Get Moving (to Your New Home) Updated October 31, 2022 Downsizing a home might mean reducing clutter or it could mean moving into a smaller…Read more
10 Must-Haves for Your House-Hunting Checklist Updated November 27, 2023 A great house hunting checklist could make the difference between getting the home you want…Read more